📉 DOGE/USDT 4H: Structural Breakdown and Retest of S/R Flip for Continuation Short
📝 Market Overview and Trend Context
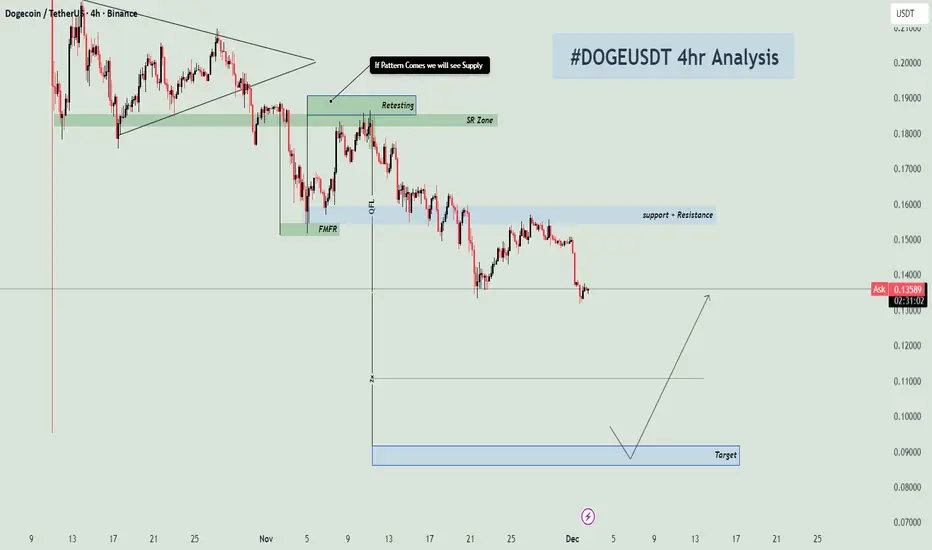
The DOGE/USDT pair, as observed on the 4-hour chart, has undergone a significant structural breakdown following an extended period of consolidation (a potential triangle or pennant pattern). The initial support zone, which held price during the consolidation, was decisively broken around the 0.18000 level.
The current price action is characterized by a bearish trend, with the most recent move being a retest of the broken support level, which has now flipped to become a critical Resistance Zone (S/R Flip). The overall expectation is for a continuation of the bearish trend towards much lower structural lows.
🔑 Key Technical Zones and Structural Elements
The analysis focuses on the structural change and the re-entry point for selling:
1. S/R Flip Zone (The Supply Entry) 🔴
Zone Location: The green shaded area, spanning roughly 0.18000 to 0.18500.
Significance: This zone was the last significant area of support before the decisive breakdown. After the break, price rallied back up to this zone in a retesting maneuver. This confirms the S/R Flip, where former support becomes new, strong resistance (a high-quality Supply Zone).
Trading Thesis: This is the high-probability area where institutional sell orders are expected to enter the market, initiating the next leg down of the bearish trend.
2. False Move Failure Retest (FMFR)
Marking: An area labeled FMFR (False Move Failure Retest) appears near the retesting area. This highlights a specific pattern often used in Smart Money Concepts (SMC) where the initial move into a zone is often complex or fails before the true move begins, adding confluence to the resistance/supply thesis.
3. Target Zone (Accumulation Zone) 🔵
Zone Location: The blue shaded box, spanning approximately 0.08800 to 0.09100.
Significance: This is the primary long-term Target for the short trade. It represents the next major structural low or a historical area of strong accumulation/demand, which is likely to attract the price once the supply pressure is confirmed.
📊 Trading Hypothesis: Shorting the Retest
The trade plan is contingent on confirming the bearish pattern at the S/R flip zone:
Trade Direction: Short (Sell).
Entry Strategy: The condition for entry is strictly: "If Pattern Comes we will see Supply". This means traders must wait for a clear bearish pattern (e.g., bearish engulfing candle, pin bar, or an indication of supply overwhelming demand) to form within the S/R Flip Zone on the 4H chart or a lower confirmation timeframe (e.g., 1H).
Stop Loss (S/L): The Stop Loss should be placed securely above the highest wick of the S/R Flip Zone retest (e.g., above 0.19000), protecting against a false breakdown and a move back into the prior consolidation range.
Take Profit (T/P): The primary and most aggressive target is the Target Zone around 0.09000. Given the size of the move, interim profit targets may be placed at psychological levels (e.g., 0.12000 or 0.10000).
⚠️ Risk Management and Invalidation
The critical factor is adherence to the "If Pattern Comes" rule. Entering before a clear rejection of the S/R Flip Zone is premature. A decisive close above the S/R Flip Zone (e.g., above 0.19000) would invalidate this bearish setup, potentially signaling a large deviation move or a false structural break.
📝 Market Overview and Trend Context
The DOGE/USDT pair, as observed on the 4-hour chart, has undergone a significant structural breakdown following an extended period of consolidation (a potential triangle or pennant pattern). The initial support zone, which held price during the consolidation, was decisively broken around the 0.18000 level.
The current price action is characterized by a bearish trend, with the most recent move being a retest of the broken support level, which has now flipped to become a critical Resistance Zone (S/R Flip). The overall expectation is for a continuation of the bearish trend towards much lower structural lows.
🔑 Key Technical Zones and Structural Elements
The analysis focuses on the structural change and the re-entry point for selling:
1. S/R Flip Zone (The Supply Entry) 🔴
Zone Location: The green shaded area, spanning roughly 0.18000 to 0.18500.
Significance: This zone was the last significant area of support before the decisive breakdown. After the break, price rallied back up to this zone in a retesting maneuver. This confirms the S/R Flip, where former support becomes new, strong resistance (a high-quality Supply Zone).
Trading Thesis: This is the high-probability area where institutional sell orders are expected to enter the market, initiating the next leg down of the bearish trend.
2. False Move Failure Retest (FMFR)
Marking: An area labeled FMFR (False Move Failure Retest) appears near the retesting area. This highlights a specific pattern often used in Smart Money Concepts (SMC) where the initial move into a zone is often complex or fails before the true move begins, adding confluence to the resistance/supply thesis.
3. Target Zone (Accumulation Zone) 🔵
Zone Location: The blue shaded box, spanning approximately 0.08800 to 0.09100.
Significance: This is the primary long-term Target for the short trade. It represents the next major structural low or a historical area of strong accumulation/demand, which is likely to attract the price once the supply pressure is confirmed.
📊 Trading Hypothesis: Shorting the Retest
The trade plan is contingent on confirming the bearish pattern at the S/R flip zone:
Trade Direction: Short (Sell).
Entry Strategy: The condition for entry is strictly: "If Pattern Comes we will see Supply". This means traders must wait for a clear bearish pattern (e.g., bearish engulfing candle, pin bar, or an indication of supply overwhelming demand) to form within the S/R Flip Zone on the 4H chart or a lower confirmation timeframe (e.g., 1H).
Stop Loss (S/L): The Stop Loss should be placed securely above the highest wick of the S/R Flip Zone retest (e.g., above 0.19000), protecting against a false breakdown and a move back into the prior consolidation range.
Take Profit (T/P): The primary and most aggressive target is the Target Zone around 0.09000. Given the size of the move, interim profit targets may be placed at psychological levels (e.g., 0.12000 or 0.10000).
⚠️ Risk Management and Invalidation
The critical factor is adherence to the "If Pattern Comes" rule. Entering before a clear rejection of the S/R Flip Zone is premature. A decisive close above the S/R Flip Zone (e.g., above 0.19000) would invalidate this bearish setup, potentially signaling a large deviation move or a false structural break.
For Daily Trade Setups and Forecast: 📈 t.me/xauusdoptimizer
Premium Signals Fr33: 💯 t.me/xauusdoptimizer
🥰🥳🤩
Premium Signals Fr33: 💯 t.me/xauusdoptimizer
🥰🥳🤩
관련 발행물
면책사항
해당 정보와 게시물은 금융, 투자, 트레이딩 또는 기타 유형의 조언이나 권장 사항으로 간주되지 않으며, 트레이딩뷰에서 제공하거나 보증하는 것이 아닙니다. 자세한 내용은 이용 약관을 참조하세요.
For Daily Trade Setups and Forecast: 📈 t.me/xauusdoptimizer
Premium Signals Fr33: 💯 t.me/xauusdoptimizer
🥰🥳🤩
Premium Signals Fr33: 💯 t.me/xauusdoptimizer
🥰🥳🤩
관련 발행물
면책사항
해당 정보와 게시물은 금융, 투자, 트레이딩 또는 기타 유형의 조언이나 권장 사항으로 간주되지 않으며, 트레이딩뷰에서 제공하거나 보증하는 것이 아닙니다. 자세한 내용은 이용 약관을 참조하세요.