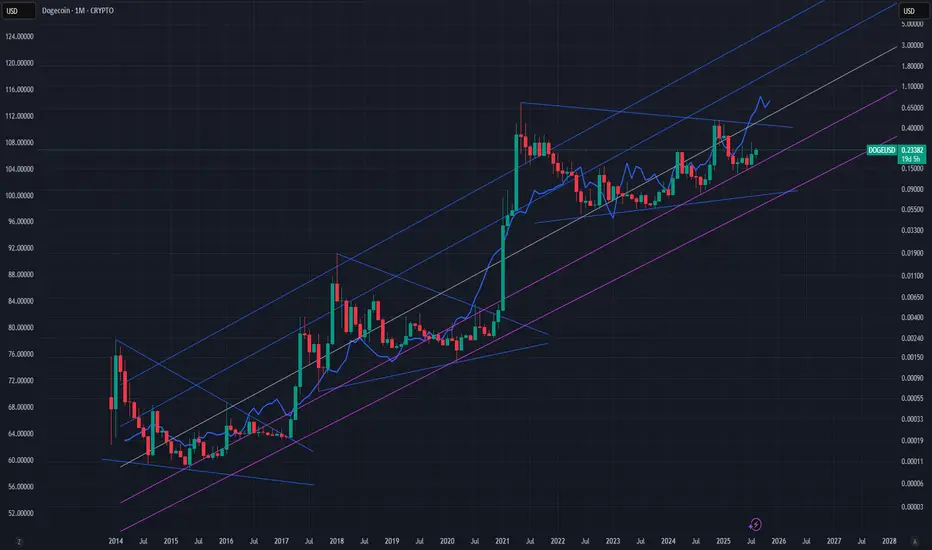
This logarithmic Dogecoin chart combines three distinct analytical tools to paint a compelling picture for what might be next for Elon’s favorite crypto.
1. The Power of Triangles
Over the years, Dogecoin has formed three large triangle patterns on its chart. In the past, once price broke out of these consolidations, it expanded dramatically before reaching a cycle top. We’re now inside the third triangle — and price action suggests it’s approaching another breakout.
2. Liquidity as the Hidden Driver
Overlaying global M2 (the broad measure of money supply) reveals that Dogecoin’s price tends to follow it with about an 11-week lag. Liquidity growth has been picking up, and historically, that has provided the fuel for Doge rallies. If the pattern holds, the odds of breaking out of the current triangle rise significantly.
3. Linear Regression Targets
The standard linear regression channel helps us frame potential price targets. Dogecoin currently trades around $0.233. If it reaches the upper band of this regression channel — as it has in previous strong uptrends — the model suggests a potential target near $5, which would represent roughly a 2,045% gain from current levels.
Why This Matters
This chart doesn’t guarantee a repeat of history — but it combines pattern structure, macro liquidity trends, and statistical price channels into one clear roadmap. If global liquidity keeps expanding, and history rhymes, Dogecoin could be setting up for another explosive leg.
Not financial advice. Do your own research.
면책사항
해당 정보와 게시물은 금융, 투자, 트레이딩 또는 기타 유형의 조언이나 권장 사항으로 간주되지 않으며, 트레이딩뷰에서 제공하거나 보증하는 것이 아닙니다. 자세한 내용은 이용 약관을 참조하세요.
면책사항
해당 정보와 게시물은 금융, 투자, 트레이딩 또는 기타 유형의 조언이나 권장 사항으로 간주되지 않으며, 트레이딩뷰에서 제공하거나 보증하는 것이 아닙니다. 자세한 내용은 이용 약관을 참조하세요.