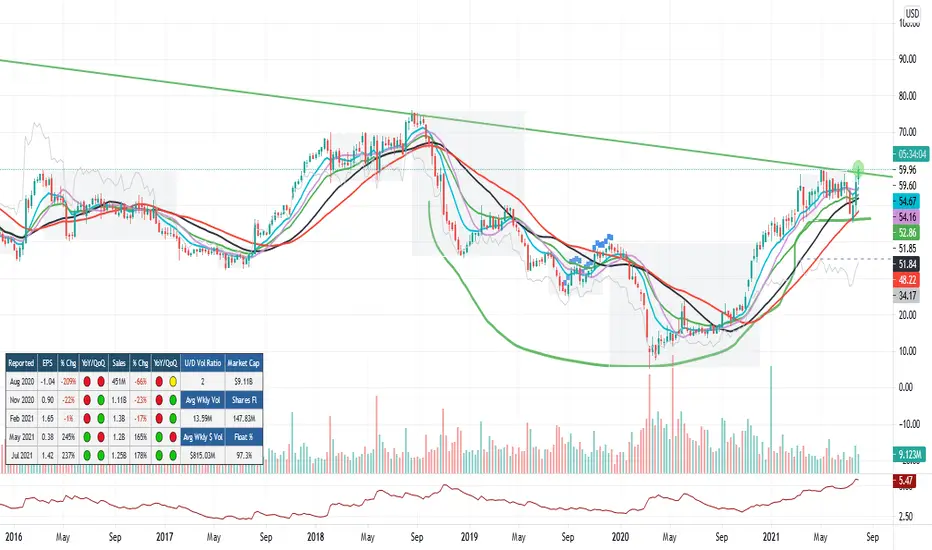
Wow,  CPRI looks to be breaking out of a long term down trend. This is a weekly chart. The longer term down trend line was drawn from a monthly chart. This looks like it's breaking out of a Cup with Handle formation on the weekly and the monthly long term down trend. I have this on my watch list to see how it acts next week. Take a look at the last 2 earnings beat on the chart ( Earnings Indicator courtesy of @JohnMuchow on TradingView ). Ideas, not investing / trading advice.
Ideas I publish are my own. They are not meant to be investment / trading advice. You are encouraged to do your own due diligence.
I am under no obligation to post any action or update to any idea.
Follow me on "X" where I post more content.
I am under no obligation to post any action or update to any idea.
Follow me on "X" where I post more content.
면책사항
이 정보와 게시물은 TradingView에서 제공하거나 보증하는 금융, 투자, 거래 또는 기타 유형의 조언이나 권고 사항을 의미하거나 구성하지 않습니다. 자세한 내용은 이용 약관을 참고하세요.