Bitcoin Analyze (Short Term, Timeframe 2H)!!!🧐

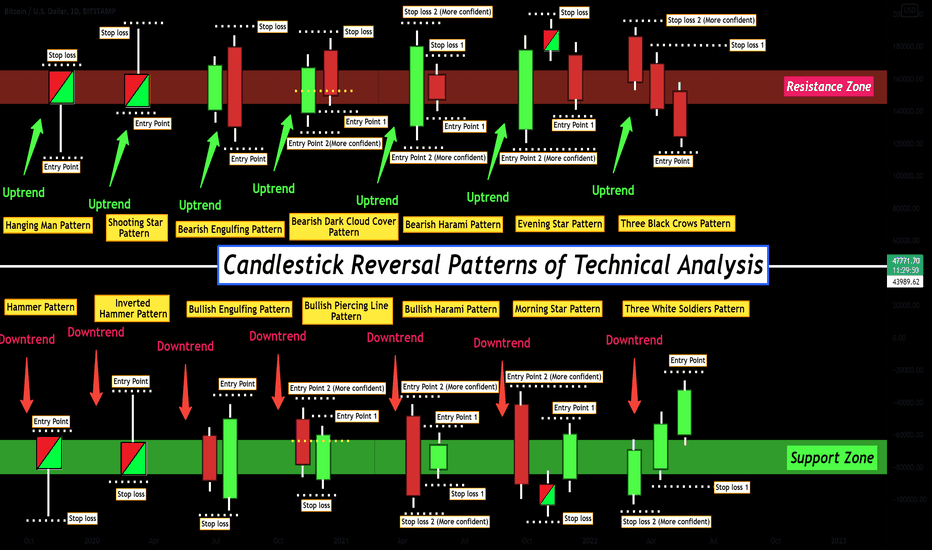
If we look at carefully to Bitcoin chart at the 2H timeframe, we can see the Inverted Hammer & Tweezer Bottom candlestick patterns inside the support lines.
Also, we can see Regular Divergence (RD+) in RSI Indicator.
I expect Bitcoin to go up(about ➕4%) to near the Resistance line & Monthly Pivot Point (Better, we wait for the trigger of the candlestick pattern).
❗️Note❗️: under 20720$, Bitcoin will continue to fall.
If you don't know about candlestick patterns, you can visit this post👇

Bitcoin Analyze ( BTCUSDT ) Timeframe 2H⏰
Do not forget to put Stop loss for your positions (For every position that you want to open).
Please follow your strategy, this is just my Idea, and I will be glad to see your ideas in this post.
Please do not forget the ✅' like'✅ button 🙏😊 & Share it with your friends; thanks, and Trade safe.
Also, we can see Regular Divergence (RD+) in RSI Indicator.
I expect Bitcoin to go up(about ➕4%) to near the Resistance line & Monthly Pivot Point (Better, we wait for the trigger of the candlestick pattern).
❗️Note❗️: under 20720$, Bitcoin will continue to fall.
If you don't know about candlestick patterns, you can visit this post👇

Bitcoin Analyze ( BTCUSDT ) Timeframe 2H⏰
Do not forget to put Stop loss for your positions (For every position that you want to open).
Please follow your strategy, this is just my Idea, and I will be glad to see your ideas in this post.
Please do not forget the ✅' like'✅ button 🙏😊 & Share it with your friends; thanks, and Trade safe.
👑Real & Accurcy Free & VIP Signals👉 t.me/ProTrader_365
📚Contact & Learning Technical Analysis 👉t.me/Ad_ProTrader365
📚Contact & Learning Technical Analysis 👉t.me/Ad_ProTrader365
관련 발행물
면책사항
이 정보와 게시물은 TradingView에서 제공하거나 보증하는 금융, 투자, 거래 또는 기타 유형의 조언이나 권고 사항을 의미하거나 구성하지 않습니다. 자세한 내용은 이용 약관을 참고하세요.