Bitcoin recently experienced a large downtrend, this is mainly because there was 'Competition' between it's relative, 'Bitcoin Cash' which saw prices of $2800 on some exchanges.
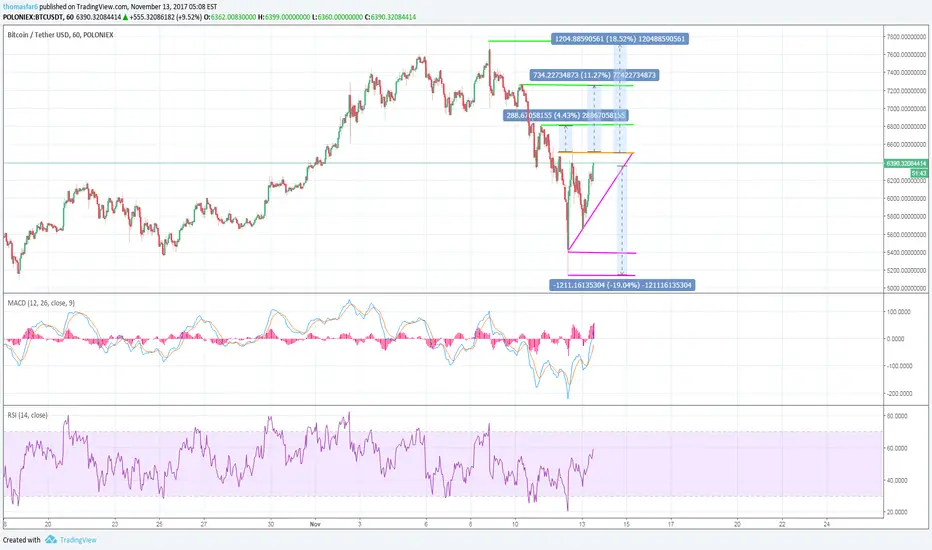
An ascending triangle pattern has formed which can indicate an upcoming bullish trend, the price is also trying to break the resistance price of $6,500 which you want to watch out for. If we break this we could see prices heading back up to $7,000, on the other hand, we may fall back to the support line on the triangle and if broken we could be plummeting even lower.
As always trade the lines accordingly.
An ascending triangle pattern has formed which can indicate an upcoming bullish trend, the price is also trying to break the resistance price of $6,500 which you want to watch out for. If we break this we could see prices heading back up to $7,000, on the other hand, we may fall back to the support line on the triangle and if broken we could be plummeting even lower.
- Orange - Resistance.
- Purple - Support.
As always trade the lines accordingly.
면책사항
이 정보와 게시물은 TradingView에서 제공하거나 보증하는 금융, 투자, 거래 또는 기타 유형의 조언이나 권고 사항을 의미하거나 구성하지 않습니다. 자세한 내용은 이용 약관을 참고하세요.
면책사항
이 정보와 게시물은 TradingView에서 제공하거나 보증하는 금융, 투자, 거래 또는 기타 유형의 조언이나 권고 사항을 의미하거나 구성하지 않습니다. 자세한 내용은 이용 약관을 참고하세요.