Chart analysis for Bitcoin.
A view of Bitcoin, focusing on key technical levels and market structure:
Trend and Price Activity
Downtrend Confirmation:
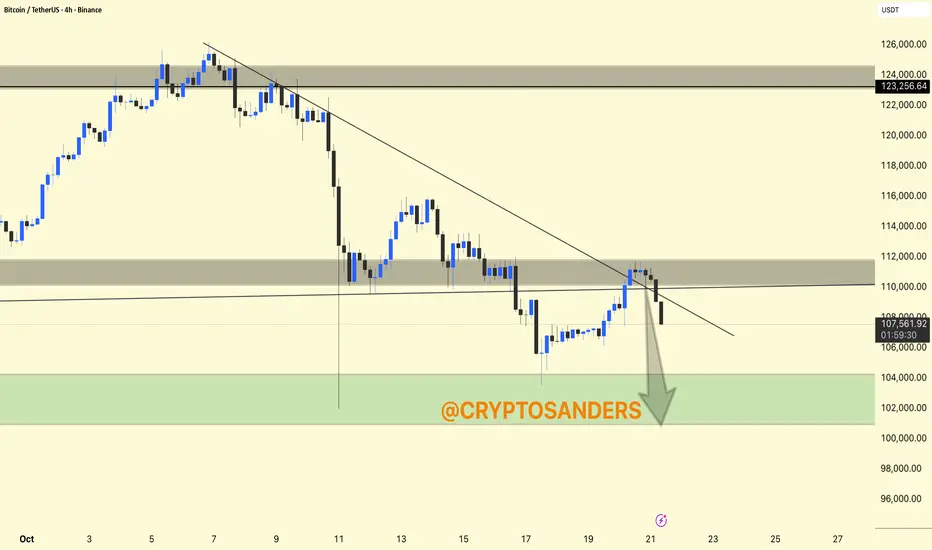
The price is clearly following a descending trendline. Attempts to break this line near the $111,000-$112,000 resistance level have failed.
Resistance Zone:
The gray area around $111,000-$112,000 represents a supply zone where the price struggled and faced selling pressure.
A very high resistance band exists near $123,000-$124,000 (upper chart), but the price is still well below this level.
Support Zone:
The large green box at $102,000-$106,000 marks a key demand zone, indicating where buyers could step in for a potential reversal or bounce.
DYOR | NFA
A view of Bitcoin, focusing on key technical levels and market structure:
Trend and Price Activity
Downtrend Confirmation:
The price is clearly following a descending trendline. Attempts to break this line near the $111,000-$112,000 resistance level have failed.
Resistance Zone:
The gray area around $111,000-$112,000 represents a supply zone where the price struggled and faced selling pressure.
A very high resistance band exists near $123,000-$124,000 (upper chart), but the price is still well below this level.
Support Zone:
The large green box at $102,000-$106,000 marks a key demand zone, indicating where buyers could step in for a potential reversal or bounce.
DYOR | NFA
관련 발행물
면책사항
해당 정보와 게시물은 금융, 투자, 트레이딩 또는 기타 유형의 조언이나 권장 사항으로 간주되지 않으며, 트레이딩뷰에서 제공하거나 보증하는 것이 아닙니다. 자세한 내용은 이용 약관을 참조하세요.
관련 발행물
면책사항
해당 정보와 게시물은 금융, 투자, 트레이딩 또는 기타 유형의 조언이나 권장 사항으로 간주되지 않으며, 트레이딩뷰에서 제공하거나 보증하는 것이 아닙니다. 자세한 내용은 이용 약관을 참조하세요.