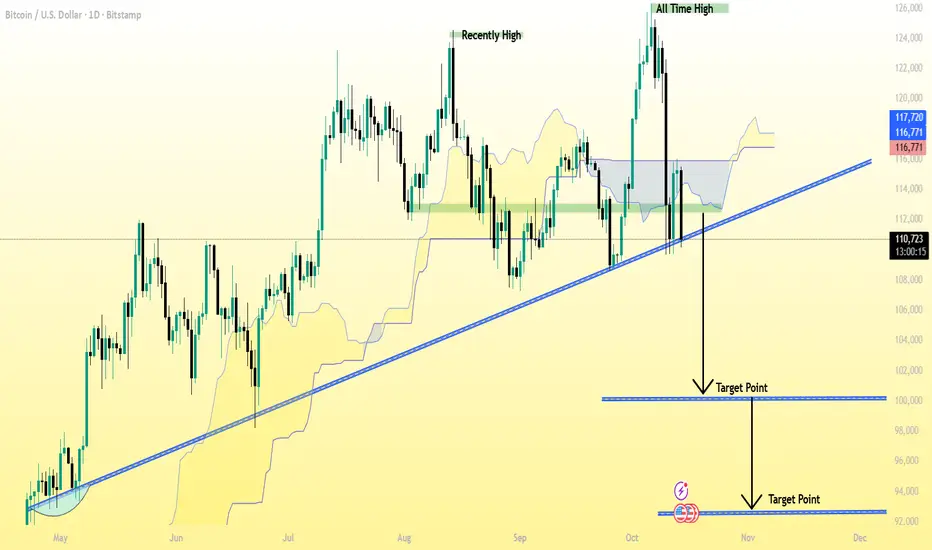
BTC/USD (Bitcoin) 1D (Daily) chart 👇
✅ Current Price: around $110,685
✅ Trend: Bearish breakdown — price has clearly broken below the long-term ascending trendline.
✅ Market structure: After rejecting near $117,000, BTC dropped below both the Ichimoku cloud and the trendline — confirming downside pressure.
---
🎯 Target Levels (Downside)
1. Primary Target: $100,000 – $98,000
This matches my first marked “Target Point”.
It’s a strong historical support zone and aligns with previous price consolidation.
2. Extended / Final Target: $94,000 – $92,000
This is the second target point shown on my chart.
It would be the next major support if BTC continues falling after $98,000 breaks.
---
🛡 Resistance / Stop-Loss
Immediate resistance: $113,000 – $114,000 (broken trendline retest zone).
Stop-loss for short trades: above $115,000 – $116,000 (invalidates bearish setup).
---
🔍 Summary
Trend bias: Bearish (break of trendline + below cloud)
Sell zone: $111,000 – $113,000
Target 1: $100,000 – $98,000
Target 2: $94,000 – $93,000
Stop-loss: above $115,000
액티브 트레이드
trade active📲 Join telegram channel free ..
t.me/goldtradingpk710
Forex, Gold & Crypto Signals with detailed analysis & get consistent results..
t.me/XauusdGlobalSignal17
Gold Signal's with proper TP & SL for high profit opportunities..
t.me/goldtradingpk710
Forex, Gold & Crypto Signals with detailed analysis & get consistent results..
t.me/XauusdGlobalSignal17
Gold Signal's with proper TP & SL for high profit opportunities..
면책사항
이 정보와 게시물은 TradingView에서 제공하거나 보증하는 금융, 투자, 거래 또는 기타 유형의 조언이나 권고 사항을 의미하거나 구성하지 않습니다. 자세한 내용은 이용 약관을 참고하세요.
📲 Join telegram channel free ..
t.me/goldtradingpk710
Forex, Gold & Crypto Signals with detailed analysis & get consistent results..
t.me/XauusdGlobalSignal17
Gold Signal's with proper TP & SL for high profit opportunities..
t.me/goldtradingpk710
Forex, Gold & Crypto Signals with detailed analysis & get consistent results..
t.me/XauusdGlobalSignal17
Gold Signal's with proper TP & SL for high profit opportunities..
면책사항
이 정보와 게시물은 TradingView에서 제공하거나 보증하는 금융, 투자, 거래 또는 기타 유형의 조언이나 권고 사항을 의미하거나 구성하지 않습니다. 자세한 내용은 이용 약관을 참고하세요.