"Think of RSI like a car’s speedometer:
The speed (RSI) changes before the position (price) changes direction."
1. What RSI actually is?
RSI (Relative Strength Index) is just a math transformation of price data.
It measures the ratio of recent upward moves to downward moves over a period (often 14 candles) and compresses it into a 0–100 scale.
2. Why RSI sometimes “moves first”
This isn’t magic — it’s because RSI is sensitive to the speed and size of recent price changes, not just direction.
- If price is still going up but at a slower pace, RSI can already start turning down.
- If price is falling more gently than before, RSI can start curling up before price actually reverses.
3. Why traders care about RSI reversals?
- If RSI starts turning down from an overbought level while price is still climbing, it can be an early warning of a possible price top.
- Same for the opposite: RSI turning up from oversold while price still dips can signal an upcoming bounce.
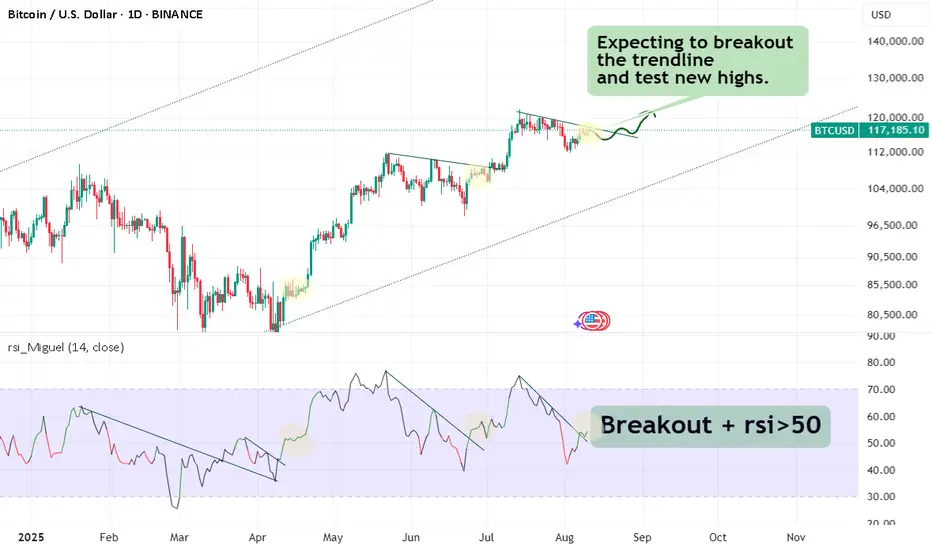
4. RSI above or below 50
50 on the RSI is the “momentum neutral” line.
- When RSI is above 50, recent gains outweigh recent losses → momentum is bullish.
- When RSI is below 50, recent losses outweigh recent gains → momentum is bearish.
5. The “delay” you see
The delay is more about your eyes than the math:
- RSI smooths recent price moves (average gains/losses), so it reacts slightly ahead to changes in momentum.
- Price must actually reverse for you to “see” it, but RSI reflects that change in momentum first.
- Think of RSI like a car’s speedometer:
The speed (RSI) changes before the position (price) changes direction.
6. How to deal with noise* in RSI?
Use higher timeframes (1D, 1W, 1M) to confirm signals from small charts.
*Noise in trading = small, random price movements that don’t reflect the bigger trend.
On a 1-minute or 5-minute chart, there’s a lot of this — caused by scalpers, bots, spreads, liquidity gaps, and normal market “chatter.”
The speed (RSI) changes before the position (price) changes direction."
1. What RSI actually is?
RSI (Relative Strength Index) is just a math transformation of price data.
It measures the ratio of recent upward moves to downward moves over a period (often 14 candles) and compresses it into a 0–100 scale.
2. Why RSI sometimes “moves first”
This isn’t magic — it’s because RSI is sensitive to the speed and size of recent price changes, not just direction.
- If price is still going up but at a slower pace, RSI can already start turning down.
- If price is falling more gently than before, RSI can start curling up before price actually reverses.
3. Why traders care about RSI reversals?
- If RSI starts turning down from an overbought level while price is still climbing, it can be an early warning of a possible price top.
- Same for the opposite: RSI turning up from oversold while price still dips can signal an upcoming bounce.
4. RSI above or below 50
50 on the RSI is the “momentum neutral” line.
- When RSI is above 50, recent gains outweigh recent losses → momentum is bullish.
- When RSI is below 50, recent losses outweigh recent gains → momentum is bearish.
5. The “delay” you see
The delay is more about your eyes than the math:
- RSI smooths recent price moves (average gains/losses), so it reacts slightly ahead to changes in momentum.
- Price must actually reverse for you to “see” it, but RSI reflects that change in momentum first.
- Think of RSI like a car’s speedometer:
The speed (RSI) changes before the position (price) changes direction.
6. How to deal with noise* in RSI?
Use higher timeframes (1D, 1W, 1M) to confirm signals from small charts.
*Noise in trading = small, random price movements that don’t reflect the bigger trend.
On a 1-minute or 5-minute chart, there’s a lot of this — caused by scalpers, bots, spreads, liquidity gaps, and normal market “chatter.”
노트
Feel free to comment or ask something 🤑관련 발행물
면책사항
이 정보와 게시물은 TradingView에서 제공하거나 보증하는 금융, 투자, 거래 또는 기타 유형의 조언이나 권고 사항을 의미하거나 구성하지 않습니다. 자세한 내용은 이용 약관을 참고하세요.
면책사항
이 정보와 게시물은 TradingView에서 제공하거나 보증하는 금융, 투자, 거래 또는 기타 유형의 조언이나 권고 사항을 의미하거나 구성하지 않습니다. 자세한 내용은 이용 약관을 참고하세요.