1. Introduction
Every trader has heard of support and resistance. They are the most common levels drawn on charts, and for good reason: markets consistently react to them.
But what makes these levels so powerful? Why do millions of traders watch them and why does price often respect them?
Support and resistance are not magic. They are simply psychological levels, supply and demand zones, and self-fulfilling expectations all converging.

2. Defining Support and Resistance
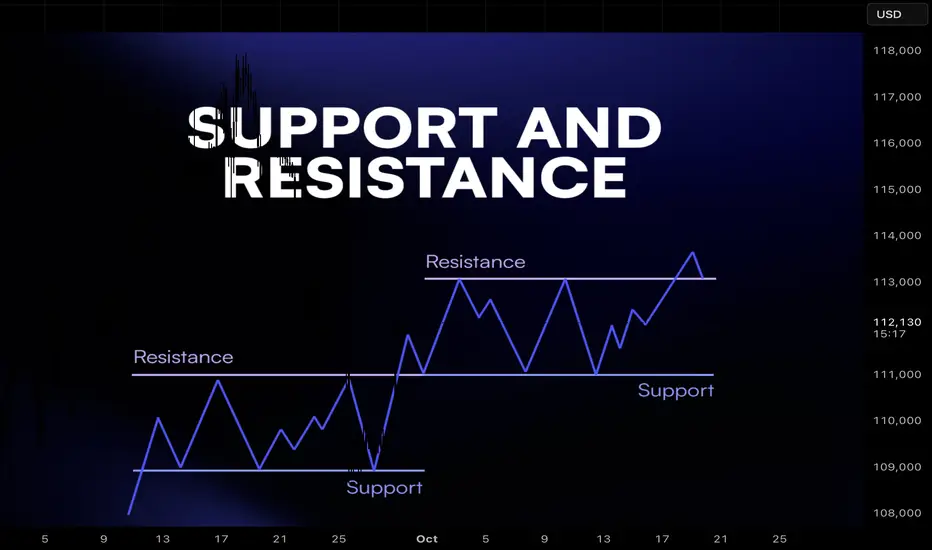
Support: A price level where demand is strong enough to stop price from falling further. Traders buy here, creating a “floor.”
Resistance: A price level where selling pressure outweighs demand, stopping price from rising further. Traders sell here, creating a “ceiling.”
Think of them as zones, not exact lines. Markets are messy, and price often wicks through before reacting.
3. Why They Work: The Psychology
Support and resistance function because traders remember these levels:
Fear & Greed: Traders who missed buying at support wait for price to return. Sellers at resistance wait to “get out at breakeven.”
Anchoring: Once a level has reacted multiple times, more traders trust it.
Stop Placement: Traders often put stop losses beyond support/resistance, creating liquidity pools that attract price.
In short: these levels represent collective memory of the market.
4. The Supply and Demand Connection
Behind every level is a simple truth: markets move because of imbalances.
At support, buyers step in, creating excess demand.
At resistance, sellers dominate, creating excess supply.

5. Types of Support and Resistance
Not all levels are created equal. Common ones include:
Horizontal Levels – obvious highs/lows on the chart.
Trendlines – diagonal support/resistance following direction of trend.
Moving Averages – dynamic levels that act as support in uptrends and resistance in downtrends.
Psychological Round Numbers – like $1,000 or $2,000 on ETH, where traders naturally cluster orders.
6. How Traders Use Them
Support and resistance are used in multiple ways:
Entries: Buying near support, selling near resistance.
Exits: Taking profit at resistance, cutting loss below support.
Stop Loss Placement: Stops often go just below support or above resistance.
Breakouts: When resistance breaks, it can turn into new support (and vice versa).

7. Limitations and Traps
Support and resistance are not invincible.
False Breakouts: Price can wick beyond levels to trigger stops before reversing.
Changing Market Conditions: A strong support can fail in a new trend.
Overcrowding: When everyone sees the same level, liquidity hunts occur.
Good traders combine S/R with confirmation, volume, candlestick signals, or broader market context.
8. Closing Thought
Support and resistance work because markets are driven by human behavior and collective memory. They reflect where buyers and sellers previously fought and where they are likely to fight again.
But the real edge isn’t just knowing the levels. It’s knowing how to act when price reaches them, and how to manage risk if they fail.
Every trader has heard of support and resistance. They are the most common levels drawn on charts, and for good reason: markets consistently react to them.
But what makes these levels so powerful? Why do millions of traders watch them and why does price often respect them?
Support and resistance are not magic. They are simply psychological levels, supply and demand zones, and self-fulfilling expectations all converging.
2. Defining Support and Resistance
Support: A price level where demand is strong enough to stop price from falling further. Traders buy here, creating a “floor.”
Resistance: A price level where selling pressure outweighs demand, stopping price from rising further. Traders sell here, creating a “ceiling.”
Think of them as zones, not exact lines. Markets are messy, and price often wicks through before reacting.
3. Why They Work: The Psychology
Support and resistance function because traders remember these levels:
Fear & Greed: Traders who missed buying at support wait for price to return. Sellers at resistance wait to “get out at breakeven.”
Anchoring: Once a level has reacted multiple times, more traders trust it.
Stop Placement: Traders often put stop losses beyond support/resistance, creating liquidity pools that attract price.
In short: these levels represent collective memory of the market.
4. The Supply and Demand Connection
Behind every level is a simple truth: markets move because of imbalances.
At support, buyers step in, creating excess demand.
At resistance, sellers dominate, creating excess supply.
5. Types of Support and Resistance
Not all levels are created equal. Common ones include:
Horizontal Levels – obvious highs/lows on the chart.
Trendlines – diagonal support/resistance following direction of trend.
Moving Averages – dynamic levels that act as support in uptrends and resistance in downtrends.
Psychological Round Numbers – like $1,000 or $2,000 on ETH, where traders naturally cluster orders.
6. How Traders Use Them
Support and resistance are used in multiple ways:
Entries: Buying near support, selling near resistance.
Exits: Taking profit at resistance, cutting loss below support.
Stop Loss Placement: Stops often go just below support or above resistance.
Breakouts: When resistance breaks, it can turn into new support (and vice versa).
7. Limitations and Traps
Support and resistance are not invincible.
False Breakouts: Price can wick beyond levels to trigger stops before reversing.
Changing Market Conditions: A strong support can fail in a new trend.
Overcrowding: When everyone sees the same level, liquidity hunts occur.
Good traders combine S/R with confirmation, volume, candlestick signals, or broader market context.
8. Closing Thought
Support and resistance work because markets are driven by human behavior and collective memory. They reflect where buyers and sellers previously fought and where they are likely to fight again.
But the real edge isn’t just knowing the levels. It’s knowing how to act when price reaches them, and how to manage risk if they fail.
관련 발행물
면책사항
해당 정보와 게시물은 금융, 투자, 트레이딩 또는 기타 유형의 조언이나 권장 사항으로 간주되지 않으며, 트레이딩뷰에서 제공하거나 보증하는 것이 아닙니다. 자세한 내용은 이용 약관을 참조하세요.
관련 발행물
면책사항
해당 정보와 게시물은 금융, 투자, 트레이딩 또는 기타 유형의 조언이나 권장 사항으로 간주되지 않으며, 트레이딩뷰에서 제공하거나 보증하는 것이 아닙니다. 자세한 내용은 이용 약관을 참조하세요.