Hello everyone !
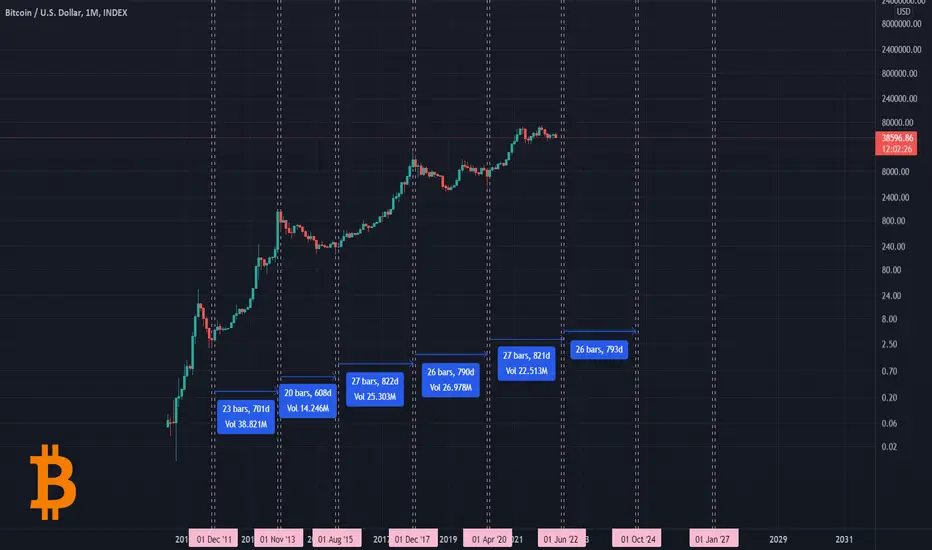
With this chart you can always know when the exact time for BTC and the whole crypto market to turn Bullish or Bearish in this repetitive cycle.
Each part consists of two lines, the first line to indicate the end of the current cycle and the second line to indicate the beginning of the new cycle.
The average is 748 Days for all cycles, And as you can see in terms of time market is too close to turn, So be aware of Bears!
----------------------------------------------------------------
Liked the idea?
Comment, Like, Follow ✌
면책사항
이 정보와 게시물은 TradingView에서 제공하거나 보증하는 금융, 투자, 거래 또는 기타 유형의 조언이나 권고 사항을 의미하거나 구성하지 않습니다. 자세한 내용은 이용 약관을 참고하세요.
면책사항
이 정보와 게시물은 TradingView에서 제공하거나 보증하는 금융, 투자, 거래 또는 기타 유형의 조언이나 권고 사항을 의미하거나 구성하지 않습니다. 자세한 내용은 이용 약관을 참고하세요.