Bitcoin long-term view - bottom after MACD divergence
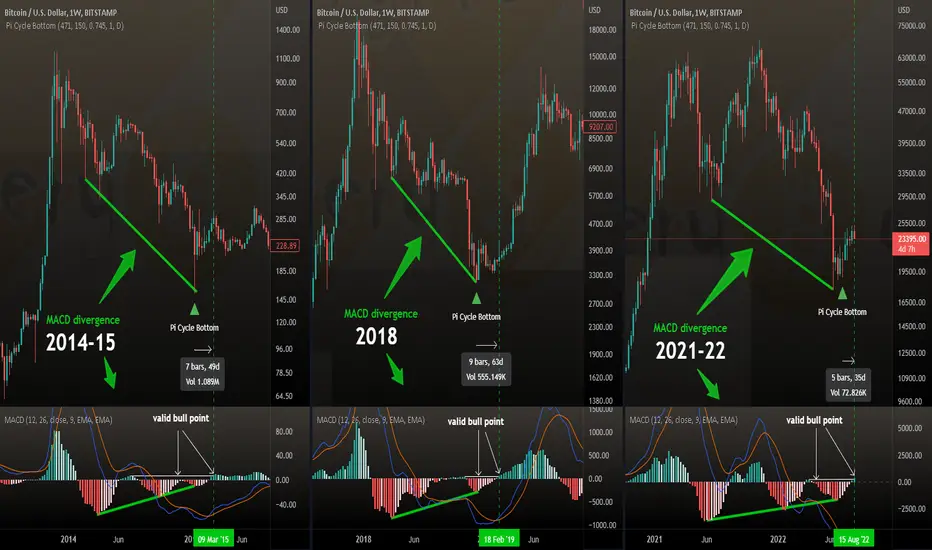
Looking back to 2014-15 and 2018 we had a huge bullish divergence with lower lows on price chart but higher lows in MACD histogram
A further confirmation can be found by a higher high on MACD histrogram after the MACD cross - called valid bull point in the chart
Will history repeat dear Crypto Nation?
*not financial advice
do your own research before investing
The shown ideas are my personal opinion and findings... no financial advice
Please always do your own research before investing
Please always do your own research before investing
면책사항
이 정보와 게시물은 TradingView에서 제공하거나 보증하는 금융, 투자, 거래 또는 기타 유형의 조언이나 권고 사항을 의미하거나 구성하지 않습니다. 자세한 내용은 이용 약관을 참고하세요.
The shown ideas are my personal opinion and findings... no financial advice
Please always do your own research before investing
Please always do your own research before investing
면책사항
이 정보와 게시물은 TradingView에서 제공하거나 보증하는 금융, 투자, 거래 또는 기타 유형의 조언이나 권고 사항을 의미하거나 구성하지 않습니다. 자세한 내용은 이용 약관을 참고하세요.