Chart Overview (BTC.D – Weekly Timeframe)
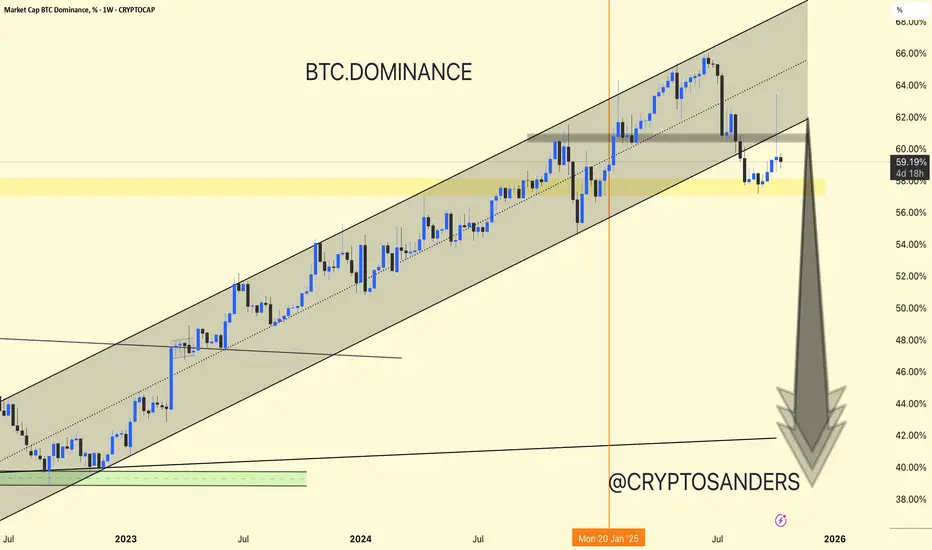
Current Level: ~59.24%
Trend: BTC dominance is still moving within a long-term ascending channel, but recently retested the lower boundary after encountering resistance around 64-65%.
Retest of Rising Channel Support:
BTC dominance touched the lower trendline of the ascending channel and found short-term support near the 58% area (marked in yellow).
Resistance Area (60-62%)
The chart shows a gray resistance area where dominance was previously rejected. This area is crucial for confirmation.
If BTC.D does not close above this, we could see further downside movement.
Potential Downside Ahead:
The large downward arrow indicates a potential correction phase, targeting the 50-45% dominance levels – a scenario that typically benefits altcoins (altseason signal).
Support Zone: 56-58%
Resistance Zone: 60-62%
Potential Downside Target: Around 45%
Trend Structure: Still bullish in the long term, but bearish momentum is possible in the short term.
If BTC dominance decreases, it means altcoins could strengthen.
If BTC dominance increases again, Bitcoin will continue to outperform altcoins.
BTC dominance is strengthening after a long bullish run.
If it fails to reach 60-62%, a trend toward altcoins is expected in the coming weeks.
DYOR | NFA
관련 발행물
면책사항
해당 정보와 게시물은 금융, 투자, 트레이딩 또는 기타 유형의 조언이나 권장 사항으로 간주되지 않으며, 트레이딩뷰에서 제공하거나 보증하는 것이 아닙니다. 자세한 내용은 이용 약관을 참조하세요.
관련 발행물
면책사항
해당 정보와 게시물은 금융, 투자, 트레이딩 또는 기타 유형의 조언이나 권장 사항으로 간주되지 않으며, 트레이딩뷰에서 제공하거나 보증하는 것이 아닙니다. 자세한 내용은 이용 약관을 참조하세요.