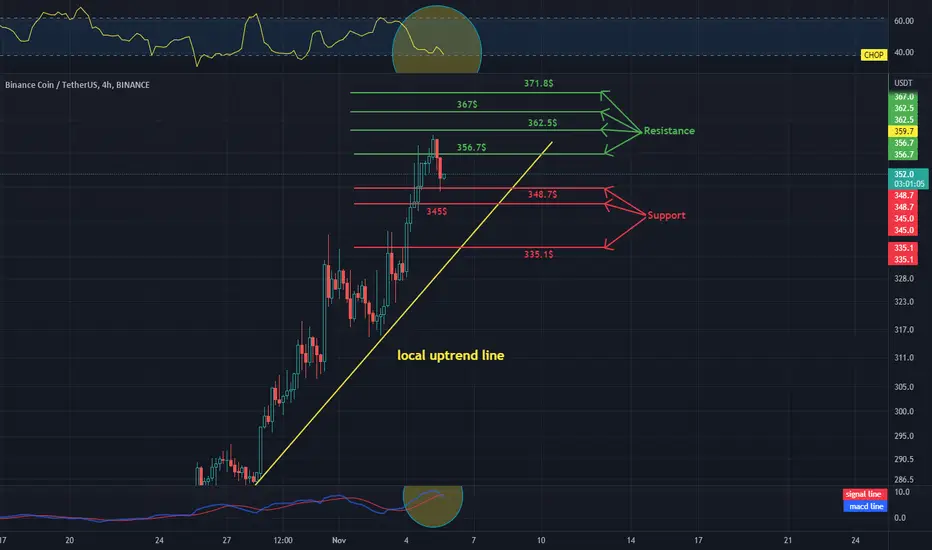
Hello everyone, let's take a look at the BNB to USDT chart over the four hour timeframe. As you can see, the price is moving above the local uptrend line.
Let's start with the line of support, and as you can see, the first support is three hundred and forty-eight dollars and seventy cents, the second support is three hundred and forty-five dollars, and the third support is three hundred and thirty-five dollars and ten cents.
Now let's move to the line of resistance, as you can see, the first resistance is three hundred and fifty-six dollars and seventy cents, the second resistance is at three hundred and sixty-two dollars fifty cents, the third is three hundred and sixty-seven dollars, and the fourth is three hundred and seventy-one dollars and eighty cents.
Looking at the CHOP indicator, we can see that the energy has been used up in the four-hour interval, and the makdi indicator shows a local downward trend.
면책사항
이 정보와 게시물은 TradingView에서 제공하거나 보증하는 금융, 투자, 거래 또는 기타 유형의 조언이나 권고 사항을 의미하거나 구성하지 않습니다. 자세한 내용은 이용 약관을 참고하세요.
면책사항
이 정보와 게시물은 TradingView에서 제공하거나 보증하는 금융, 투자, 거래 또는 기타 유형의 조언이나 권고 사항을 의미하거나 구성하지 않습니다. 자세한 내용은 이용 약관을 참고하세요.