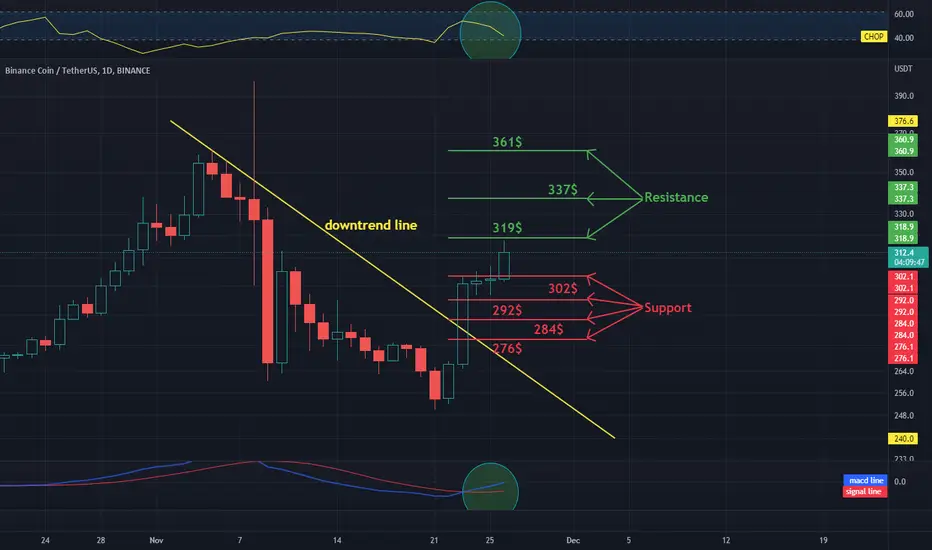
Hello everyone, let's look at the BNB to USDT 1 day chart. As you can see, the price has moved above the downtrend line.
Let's start with the support line and as you can see the first support we should consider is $302, if the support is broken then the next support is $292, $284 and $276.
Now let's go from the resistance line, as you can see the first resistance is $319, if you manage to break it, the next resistance will be $337 and $361.
Looking at the CHOP indicator, we see that most of the energy has been used on the one-day time frame, while the MACD indicator indicates a local uptrend.
면책사항
이 정보와 게시물은 TradingView에서 제공하거나 보증하는 금융, 투자, 거래 또는 기타 유형의 조언이나 권고 사항을 의미하거나 구성하지 않습니다. 자세한 내용은 이용 약관을 참고하세요.
면책사항
이 정보와 게시물은 TradingView에서 제공하거나 보증하는 금융, 투자, 거래 또는 기타 유형의 조언이나 권고 사항을 의미하거나 구성하지 않습니다. 자세한 내용은 이용 약관을 참고하세요.