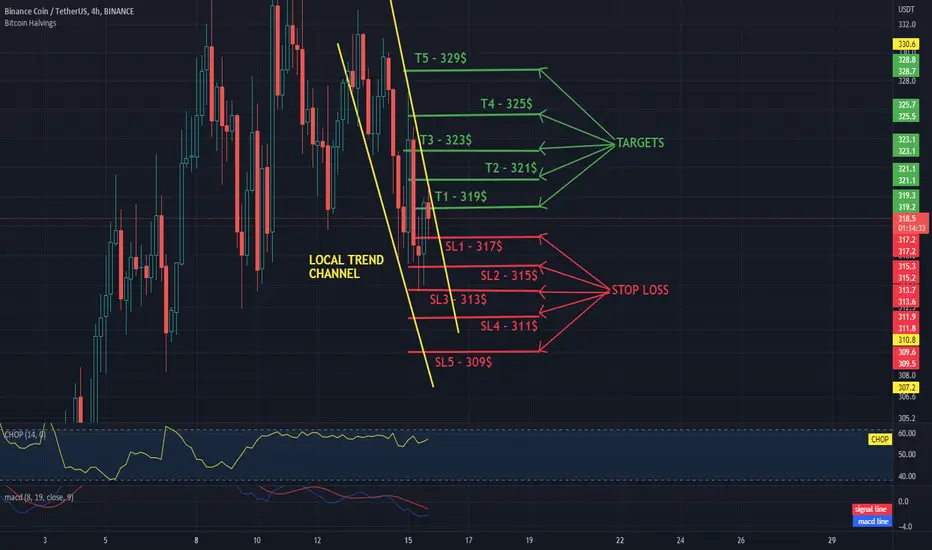
Hello everyone, let's take a look at the 4H BNB to USDT chart as you can see the price is moving in the local downtrend channel.
Let's start by setting goals for the near future that we can consider:
T1 - $ 319
T2 - $ 321
T3 - $ 323
T4 - $ 325
and
T5 - $ 329
Now let's move on to the stop loss in case of further market declines:
SL1 - $ 317
SL2 - $ 315
SL3 - $ 313
SL4 - $ 311
and
SL5 - $ 309
Looking at the CHOP indicator, we can see that there is a lot of energy in the 4H range and the MACD indicator confirms the local downward trend.
면책사항
이 정보와 게시물은 TradingView에서 제공하거나 보증하는 금융, 투자, 거래 또는 기타 유형의 조언이나 권고 사항을 의미하거나 구성하지 않습니다. 자세한 내용은 이용 약관을 참고하세요.
면책사항
이 정보와 게시물은 TradingView에서 제공하거나 보증하는 금융, 투자, 거래 또는 기타 유형의 조언이나 권고 사항을 의미하거나 구성하지 않습니다. 자세한 내용은 이용 약관을 참고하세요.