Avalanche (AVAX) technical analysis:
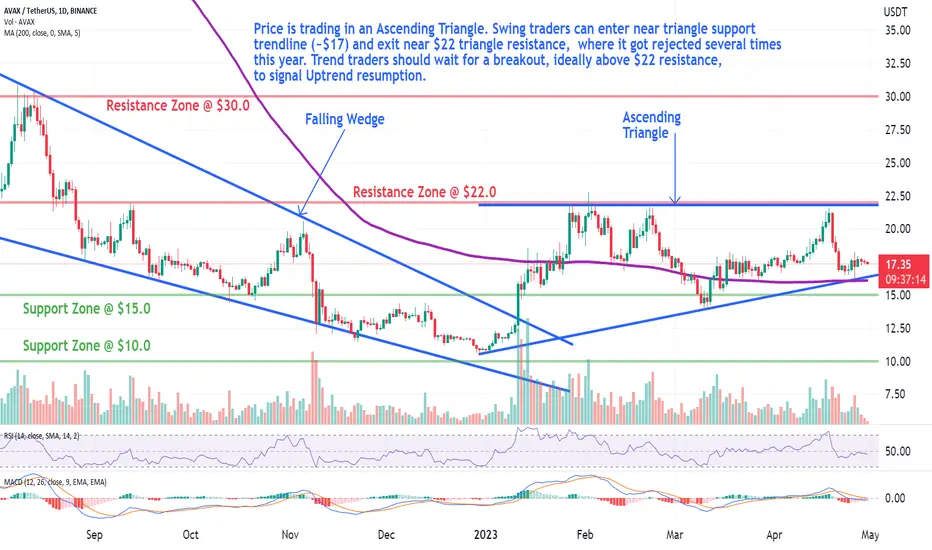
Trade setup: Price is trading in an Ascending Triangle. Swing traders can enter near triangle support trendline (~ 17) and exit near
  22 triangle resistance, where it got rejected several times this year. Trend traders should wait for a breakout, ideally above 22 resistance, to signal Uptrend resumption.
Trend: Downtrend on Short-Term basis, Neutral on Medium-Term basis and Uptrend on Long-Term basis.
Momentum is Mixed as MACD Line is below MACD Signal Line (Bearish) but RSI ~ 50 (Neutral). MACD Histogram bars are rising, which suggests that momentum could be nearing another upswing.
Support and Resistance: Nearest Support Zone is $15, (previous resistance), then $10. The nearest Resistance Zone is22, then $30.
Trade setup: Price is trading in an Ascending Triangle. Swing traders can enter near triangle support trendline (~
Trend: Downtrend on Short-Term basis, Neutral on Medium-Term basis and Uptrend on Long-Term basis.
Momentum is Mixed as MACD Line is below MACD Signal Line (Bearish) but RSI ~ 50 (Neutral). MACD Histogram bars are rising, which suggests that momentum could be nearing another upswing.
Support and Resistance: Nearest Support Zone is $15, (previous resistance), then $10. The nearest Resistance Zone is
면책사항
이 정보와 게시물은 TradingView에서 제공하거나 보증하는 금융, 투자, 거래 또는 기타 유형의 조언이나 권고 사항을 의미하거나 구성하지 않습니다. 자세한 내용은 이용 약관을 참고하세요.
면책사항
이 정보와 게시물은 TradingView에서 제공하거나 보증하는 금융, 투자, 거래 또는 기타 유형의 조언이나 권고 사항을 의미하거나 구성하지 않습니다. 자세한 내용은 이용 약관을 참고하세요.