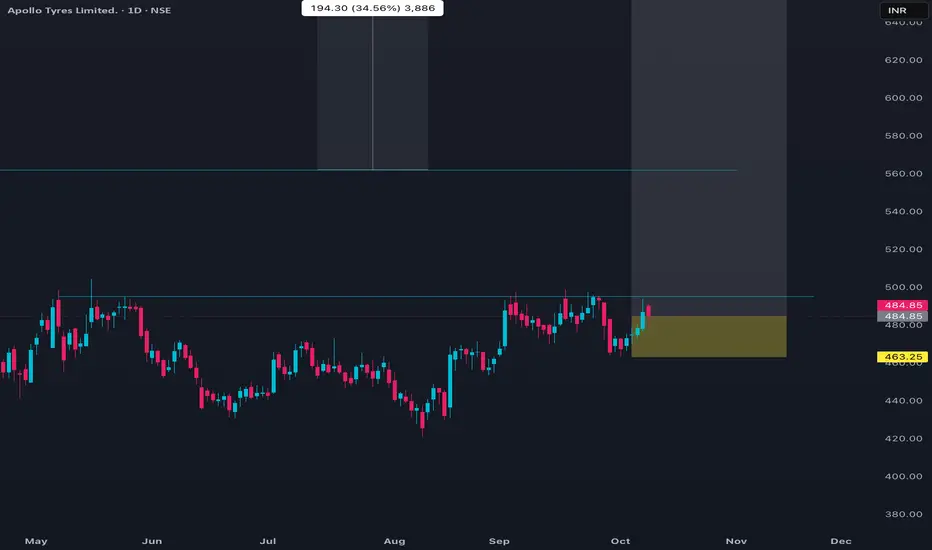
Apollo Tyres is currently trading in the range of 479 to 492. The last recorded price was about 487, following a recent day’s high of 491.5 and a low of 479.65. The volume on the last trading day exceeded 5.8 lakh shares, with an average delivery percentage around 50%. The stock is experiencing mild upward price momentum on short-term technicals, with several recent bullish EMA crossovers on daily charts.
Financially, the market capitalisation is about ₹30,800 crore. The trailing P/E ratio stands high over 36, while the P/B is just above 2. The EPS has seen a notable YoY decline. Over the last month, price movement has been flat to slightly positive, while medium-term (six months) shows a rise of more than 20%. Returns over the past year remain negative. The 52-week high is 557, and the low is 371.
Analyst consensus is positive with several recent buy ratings and a target clustered around the ₹590 level. The overall trend is positive in the short term, supported by technical indicators, while valuation remains elevated.
면책사항
이 정보와 게시물은 TradingView에서 제공하거나 보증하는 금융, 투자, 거래 또는 기타 유형의 조언이나 권고 사항을 의미하거나 구성하지 않습니다. 자세한 내용은 이용 약관을 참고하세요.
면책사항
이 정보와 게시물은 TradingView에서 제공하거나 보증하는 금융, 투자, 거래 또는 기타 유형의 조언이나 권고 사항을 의미하거나 구성하지 않습니다. 자세한 내용은 이용 약관을 참고하세요.