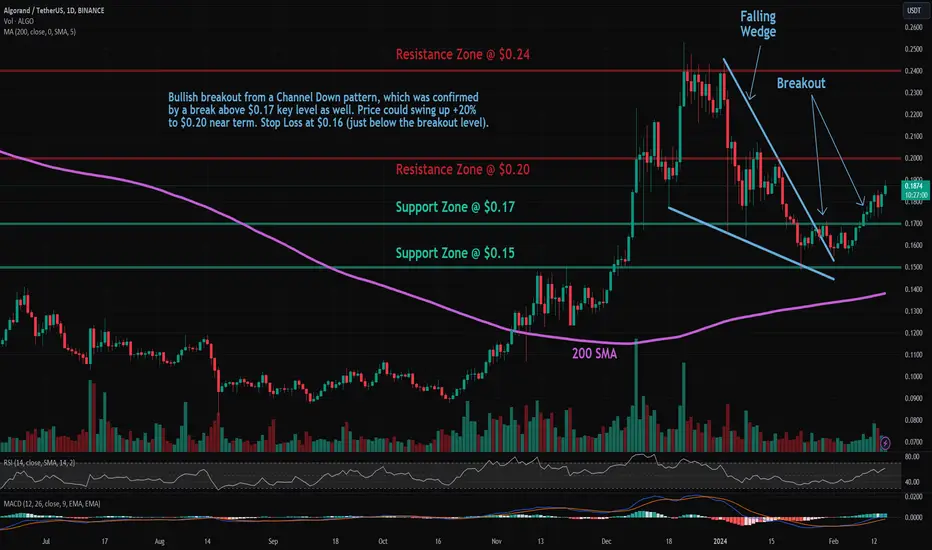
Trade setup: Bullish breakout from a Channel Down pattern was confirmed by a break above $0.17 key level. Price could swing up +20% to $0.20 near term. Stop Loss at $0.15 (just below the next support).
Patterns: Falling Wedge Usually results in a bullish breakout. When price breaks the upper trend line the price is expected to trend higher. Most traders should wait for a completed pattern with a breakout and then place a BUY order.
Trend: Neutral on Medium-Term basis and Uptrend on Short- and Long-Term basis.
Momentum is Bullish (MACD Line is above MACD Signal Line and RSI is above 55).
Support and Resistance: Nearest Support Zone is $0.17 (previous resistance), then $0.15. The nearest Resistance Zone is $0.20, then $0.24.
면책사항
해당 정보와 게시물은 금융, 투자, 트레이딩 또는 기타 유형의 조언이나 권장 사항으로 간주되지 않으며, 트레이딩뷰에서 제공하거나 보증하는 것이 아닙니다. 자세한 내용은 이용 약관을 참조하세요.
면책사항
해당 정보와 게시물은 금융, 투자, 트레이딩 또는 기타 유형의 조언이나 권장 사항으로 간주되지 않으며, 트레이딩뷰에서 제공하거나 보증하는 것이 아닙니다. 자세한 내용은 이용 약관을 참조하세요.