Cardano (ADA) technical analysis:
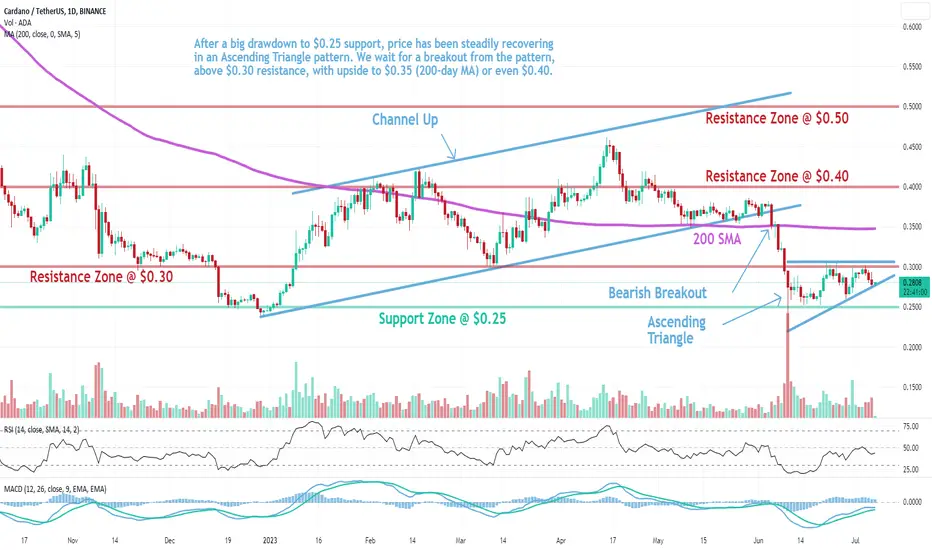
Trade setup: After a big drawdown to $0.25 support, price has been steadily recovering in an Ascending Triangle pattern. We wait for a breakout from the pattern, above $0.30 resistance, with upside to $0.35 (200-day MA) or even $0.40.
Trend: Downtrend across all time horizons (Short- Medium- and Long-Term).
Momentum is Mixed as MACD Line is above MACD Signal Line (Bullish) but RSI < 45 (Bearish). MACD Histogram bars are declining, which suggests that momentum is weakening.
Support and Resistance: Nearest Support Zone is $0.25. The nearest Resistance Zone is $0.30 (previous support), then $0.40, and $0.50.
면책사항
이 정보와 게시물은 TradingView에서 제공하거나 보증하는 금융, 투자, 거래 또는 기타 유형의 조언이나 권고 사항을 의미하거나 구성하지 않습니다. 자세한 내용은 이용 약관을 참고하세요.
면책사항
이 정보와 게시물은 TradingView에서 제공하거나 보증하는 금융, 투자, 거래 또는 기타 유형의 조언이나 권고 사항을 의미하거나 구성하지 않습니다. 자세한 내용은 이용 약관을 참고하세요.