EPS YoY% Labels (MarketSurge / IBD style)This script automatically calculates and displays year-over-year quarterly EPS growth (%) directly on the chart, in the same style used by MarketSurge / IBD.
🔹 Key Features
Detects each quarterly earnings report and shows EPS YoY growth as a label above the bar.
Works with both reported EPS and standardized EPS (selectable in settings).
Positive growth is highlighted in green, while negative growth is highlighted in red.
Optional setting to hide negative results for a cleaner, bullish-focused view.
Adjustable decimal precision (0–2 decimals) for percentage display.
🔹 Why it’s useful
EPS growth is one of the core fundamentals that top traders like Mark Minervini and William O’Neil (IBD) focus on when screening for market leaders.
Now you can see at a glance how a stock’s earnings power is accelerating or decelerating — without flipping between platforms.
Combine with Relative Strength (RS) analysis and price/volume patterns for a complete growth-stock trading workflow.
🔹 Example
If a company reports EPS of $1.20 this quarter vs. $0.80 in the same quarter last year, the label will display:
EPS +50% (green).
Yoy

EPS, Revenue & NPM Growth Marker v2This indicator visually tracks fundamental growth by plotting smart labels on earnings dates, showing three key metrics:
EPS (Earnings Per Share)
Revenue (Sales)
Net Profit Margin (NPM)
It overlays compact, readable labels on the chart allowing you to evaluate a company's financial performance — both sequentially (QoQ) and annually (YoY).
EPS, Revenue & NPM Growth Marker v2 uses both official earnings data and fallback logic (EPS/Revenue/NPM changes) to ensure consistent detection of earnings events.
⭐ Key Features
Three Metrics: Displays EPS, Revenue, and Net Profit Margin
Growth Breakdown: Shows Absolute, Quarter-over-Quarter %, and Year-over-Year % change
Smart Arrows: Trend direction shown with emoji arrows (🡩🡫)
Earnings Detection: Aligns labels to official earnings events or fallback data
Highly Customizable: Full control over visible metrics, growth types, label style, placement, and max label count
Clean Display: Keeps the chart clean with a limit on max labels
⚙️ Customization Options
You can personalize the indicator to match your charting style:
Select metrics to display: EPS, Revenue, NPM
Toggle row types: Absolute, QoQ %, YoY %
Choose label position: Above Bar, Below Bar, Top, or Bottom
Customize line style, colors, and label text color
Set the maximum number of labels shown on chart
🧠How It Works
Absolute Value: Latest reported figure for each metric (e.g., EPS = ₹3.20)
QoQ % Change: (Current - Previous Quarter) / |Previous| * 100
YoY % Change: (Current - Same Quarter Last Year) / |Previous Year| * 100
The script uses TradingView’s request.earnings() data when available. If official earnings data is missing, it intelligently detects earnings events based on changes in EPS, Revenue, or NPM figures.
This is a major update to EPS & Sales/Revenue Growth Marker script, with expanded metrics, enhanced logic, and greater customization.
Developed & Published by: @learningvitals

Retail Sales v Inflation YoYAre high retail sales increases really positive if the inflation rate is higher?
This year over year indicator of retail sales versus inflation levels can be placed in concert with any security to determine how symbols trade when inflation or retail sales are higher. A green histogram is when retail sales are higher than the inflation rate on a year over year basis. Red indicates inflation is higher rate.
The indicator can work with any symbols to see divergences. Feel free to change the positive and negative symbols to run other comparisons.

YoY or MoM ReturnsThis script is a technical indicator that calculates the year-over-year (YoY) or month-over-month (MoM) returns of a security.
The returns are then plotted on a chart, with positive returns colored in green and negative returns colored in red.

[Antipanicos] Year-over-Year YoY ChangeYear-over-year growth compares a company's recent financial performance with its numbers for the same month one year earlier. This is considered more informative than a month-to-month comparison, which often reflects seasonal trends.
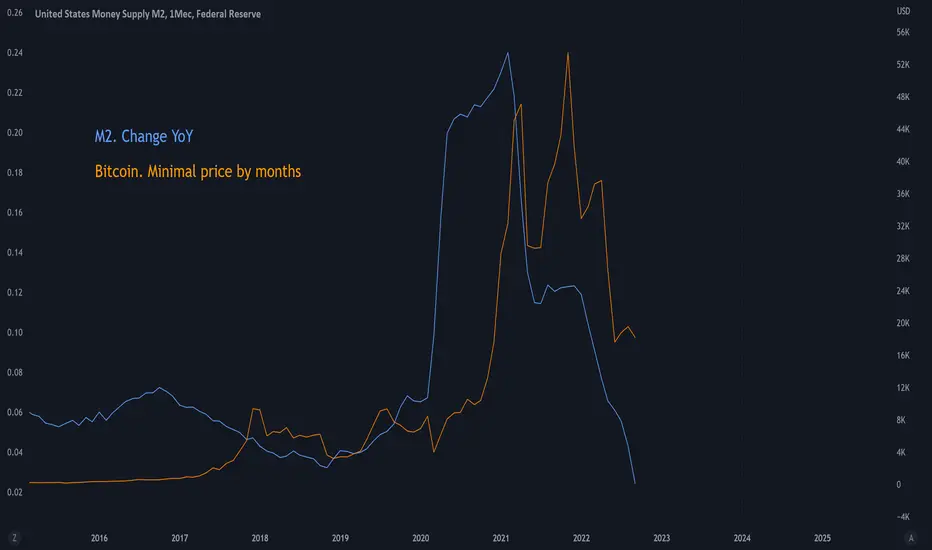
YOY[TV1]Year-to-year comparison is a popular and effective way to evaluate a company's financial performance and investment performance.
Any measurable event that repeats yearly can be compared based on YoY.
As a rule, the indicator YoY (year to year) is the number of percentages indicating an increase or regression in relation to the future or past period.
For example, you can compare WM2NS using the YOY (Year to Year) method.
The Offset argument sets the data comparison period. For daily, weekly and monthly timeframes, if Offset is set to 0, it will be determined automatically.
Сравнение Год к году - популярный и эффективный способ оценки финансовых показателей компании и эффективность инвестиций.
Любое измеримое событие, которое повторяется ежегодно можно сравнить на основе YoY.
Как правило, показателем YoY (year to year) является количество процентов указывающее на прирост или регресс по отношению к будущему или прошлому периоду.
Например, вы можете сравнить WM2NS (эмиссию доллара) с помощью метода YOY (Год к году).
Допустим, в 2021 году вы эмитировали А долларов, а в 2022 вы эмитировали Б долларов
Итак итоговой формулой будет: ((Б - А) / А) * 100
Аргумент Offset устанавливает период сравнения данных. Для дневного, недельного и месячного таймфрейма, если Offset установлен в 0, будет определен автоматически.

