ICT Market Regime Detector [TradeHook]🔮 Overview
The **ICT Market Regime Detector** is an advanced market condition classifier designed to identify the current market environment and provide context-aware trading guidance. Rather than generating buy/sell signals, this indicator focuses on answering the crucial question: *"What type of market am I trading in right now?"*
Understanding market regime is fundamental to successful trading. The same strategy that works brilliantly in a trending market can fail spectacularly during consolidation. This indicator automatically classifies market conditions into one of eight distinct regimes, each requiring different trading approaches.
---
🎯 Regime Classifications
The indicator identifies these market states:
| Regime | Description | Recommended Approach |
|------------------------|--------------------------------------------------|--------------------------------------|
| *STRONG TREND* |Directional momen. w/ healthy struc| Cont.entries with OTE pullbacks |
| **WEAK TREND** | Gradual drift with retracements | Conservative Order Block entries |
| **ACCUMULATION** | Institutional buying within range | Longs near range lows |
| **DISTRIBUTION** | Institutional selling within range | Shorts near range highs |
| **CONSOLIDATION** | Tight range, low volatility squeeze | Wait for breakout |
| **EXPANSION** | Volatile breakout phase | Momentum following |
| **REVERSAL** | Structural transition period | Wait for confirmation |
| **CHOPPY** | No clear edge | **Avoid trading** |
---
⚙️ How It Works
**Trend Analysis Engine**
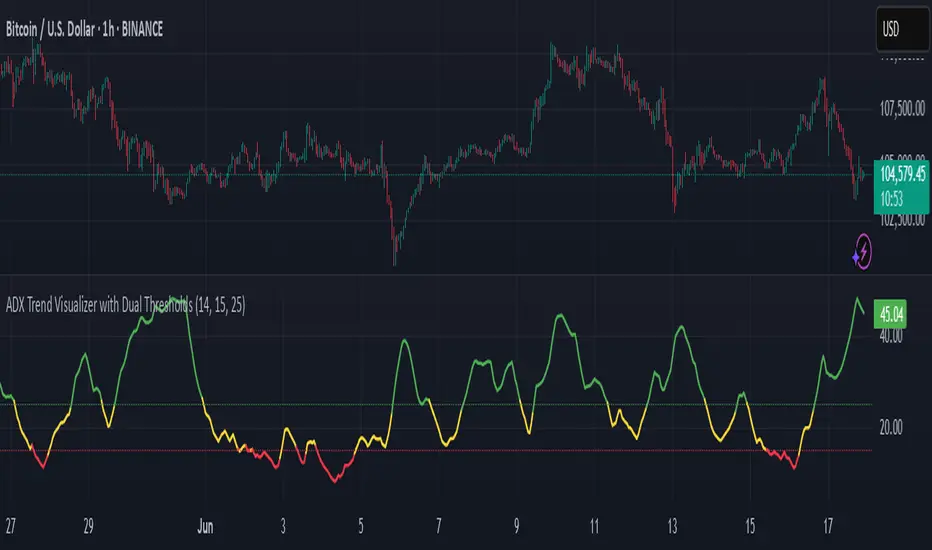
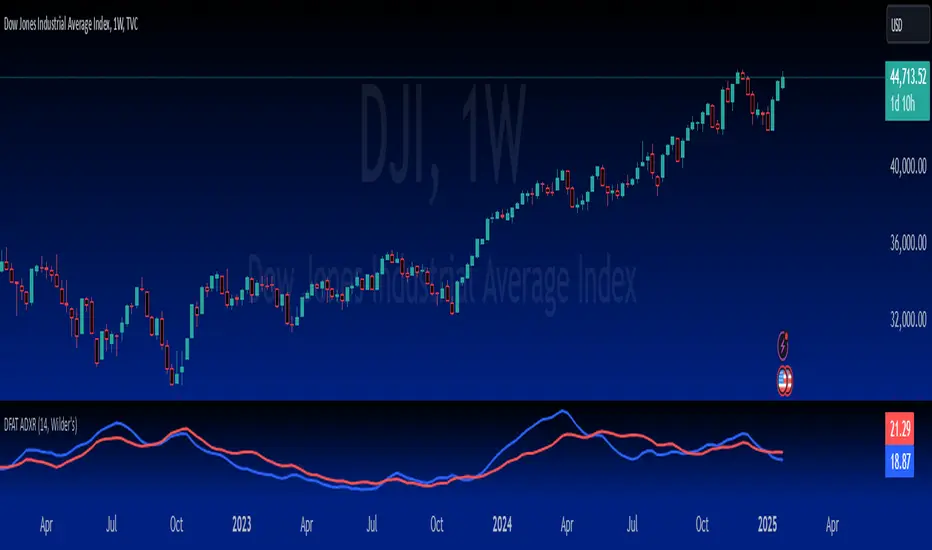
- Calculates ADX (Average Directional Index) using Wilder's smoothing method
- Monitors +DI/-DI for directional bias
- Detects trend health via EMA alignment
- Identifies exhaustion through RSI divergence
**Volatility Analysis Engine**
- Measures current vs historical volatility ratio
- Classifies as LOW, NORMAL, HIGH, or EXTREME
- Tracks volatility expansion/contraction phases
**Range Analysis Engine**
- Calculates dynamic support/resistance boundaries
- Tracks price position within range (0-100%)
- Detects range narrowing (squeeze) and expansion patterns
**Institutional Activity Detection**
- Volume spike identification
- Absorption candle patterns (large wicks, small body)
- Displacement candles (large body, small wicks)
- Accumulation/Distribution pattern recognition
---
🛡️ Risk Management Features
**Daily Loss Limit**
- Set maximum daily loss as percentage of account
- Visual warning when approaching limit
- Alert when limit is breached
**Maximum Daily Trades**
- Configurable trade counter per session
- Prevents overtrading
- Session reset options (NY Open, London Open, etc.)
**Trading Readiness Checklist**
- Clear regime ✓/✗
- Kill zone active ✓/✗
- HTF alignment ✓/✗
- Volatility normal ✓/✗
- Loss limit OK ✓/✗
- Trades remaining ✓/✗
---
📊 Multi-Timeframe Analysis
The indicator includes 4H timeframe regime alignment to ensure lower timeframe setups align with higher timeframe bias. Trades taken with HTF alignment historically have higher probability.
---
⏰ Kill Zone Integration
Built-in ICT Kill Zone detection:
- 🌙 Asian Session (Range Building)
- 🇬🇧 London Open (Prime Execution)
- 🇺🇸 NY AM (Prime Execution)
- 🔫 Silver Bullet (10-11 AM EST)
- 🇺🇸 NY PM (Afternoon Opportunities)
Configurable UTC offset for your timezone.
---
🎨 Visual Features
- **Regime-Colored Bars** - Instantly see current market state
- **Comprehensive Dashboard** - All metrics in one panel
- **Adjustable Table Size** - Tiny/Small/Normal/Large
- **Flexible Positioning** - Place dashboard in any corner
- **Optional Regime Labels** - Mark regime changes on chart
---
⚠️ Important Notes
1. This indicator is a **decision support tool**, not a signal generator
2. Always combine with proper price action analysis
3. Past regime identification doesn't guarantee future performance
4. Risk management settings are for tracking purposes only - actual position management should be done through your broker
5. The indicator works best on liquid markets with consistent volume data
---
📚 Educational Purpose
This indicator is designed for educational purposes to help traders understand market structure and regime classification. It implements concepts from ICT (Inner Circle Trader) methodology including:
- Market structure analysis
- Kill zone timing
- Institutional activity patterns
- Multi-timeframe confluence
---
🔧 Inputs Summary
**Master Toggles**
- Enable/Disable indicator, regime detection, recommendations, risk management, alerts
**Core Settings**
- Analysis lookback periods (short/medium/long)
- ADX thresholds for trend classification
- Volatility spike multiplier
**Risk Management**
- Max daily loss percentage
- Max daily trades
- Account size for P&L calculation
- Session reset timing
**Visualization**
- Dashboard on/off and position
- Regime zones and labels
- Bar coloring
- Table text size
---
💡 Tips for Use
1. **Don't trade CHOPPY regimes** - The indicator explicitly warns when no edge exists
2. **Respect the checklist** - Trade only when multiple conditions align
3. **Adjust ADX thresholds** - Different instruments may require fine-tuning
4. **Monitor regime duration** - Fresh regime changes often present the best opportunities
5. **Use with other TradeHook indicators** - Designed to complement the MTMGBS system
⚖️ DISCLAIMER
This indicator is for **educational and informational purposes only**. It does not constitute financial advice. Trading involves substantial risk of loss and is not suitable for all investors. Past performance is not indicative of future results. Always conduct your own analysis and consult with a qualified financial advisor before making trading decisions.
Pine Script® 인디케이터