웨이브 어낼리시스

Market Structure ICT Screener [TradingFinder] BoS ChoCh🔵 Introduction
Market Structure is the foundation of every Smart Money and ICT based trading model. It describes how price moves through a sequence of highs and lows, forming clear phases of expansion, retracement and reversal. Understanding this structure allows traders to read institutional order flow and align their positions with the true direction of liquidity.
Two of the most critical components in Market Structure are the Break of Structure (BOS) and Change of Character (CHOCH). A BOS represents trend continuation, confirming strength within the current direction. In contrast, CHOCH also known as a Market Structure Shift (MSS) signals the first sign of a trend reversal or liquidity shift where order flow begins to change from bullish to bearish or vice versa.
Because the market is fractal, structure can exist at multiple levels known as Major (External) and Minor (Internal). Major structure defines the overall trend on higher timeframes while minor or internal structure reveals short term swings and early reversals within that larger move.
🔵 How to Use
Understanding Market Structure starts with identifying how price interacts with previous swing highs and swing lows. Every trend in the market, whether bullish or bearish, is built from a sequence of impulsive and corrective moves. Impulsive legs show strong displacement in the direction of liquidity flow, while corrective legs represent temporary pullbacks as the market rebalances before the next expansion. Recognizing these sequences is essential for reading the story of price and anticipating what may happen next.
A Break of Structure (BOS) occurs when price decisively moves beyond a previous structural point by breaking above the last high in an uptrend or falling below the last low in a downtrend. This event confirms that the current trend remains intact and that liquidity has been successfully taken from one side of the market. A BOS acts as confirmation of continuation and reflects strength within the existing directional bias.
A Change of Character (CHOCH) appears when price violates structure in the opposite direction of the prevailing trend. This is the first signal that market sentiment and order flow may be shifting. For example, during a downtrend if price breaks above a previous high, it indicates that sellers are losing control and a potential bullish reversal may be developing. In an uptrend, when price drops below a recent low, it suggests a possible bearish transition.
Because the market is fractal, structure exists across multiple layers. Major structure reflects the dominant movement visible on higher timeframes and defines the broader directional bias. Minor or internal structure represents smaller swings within that move and helps identify early transitions before they appear on the higher timeframe. When internal and external structures align, they offer a high probability signal for trend continuation or reversal.
By observing BOS and CHOCH across both internal and external structures, traders can clearly visualize when the market is expanding, contracting or preparing to shift direction. This structured understanding of price movement forms the foundation for precise trend analysis and high quality decision making in any Smart Money or ICT based trading approach.
🔵 Settings
🟣 Display Settings
Table on Chart : Allows users to choose the position of the signal dashboard either directly on the chart or below it, depending on their layout preference.
Number of Symbols : Enables users to control how many symbols are displayed in the screener table, from 10 to 20, adjustable in increments of 2 symbols for flexible screening depth.
Table Mode : This setting offers two layout styles for the signal table :
Basic : Mode displays symbols in a single column, using more vertical space.
Extended : Mode arranges symbols in pairs side-by-side, optimizing screen space with a more compact view.
Table Size : Lets you adjust the table’s visual size with options such as: auto, tiny, small, normal, large, huge.
Table Position : Sets the screen location of the table. Choose from 9 possible positions, combining vertical (top, middle, bottom) and horizontal (left, center, right) alignments.
🟣 Symbol Settings
Each of the 20 symbol slots comes with a full set of customizable parameters :
Symbol : Define or select the asset (e.g., XAUUSD, BTCUSD, EURUSD, etc.).
Timeframe : Set your desired timeframe for each symbol (e.g., 15, 60, 240, 1D).
Pivot Period : Set the length used to detect swing highs and lows. Shorter values increase sensitivity, longer ones focus on major structures.
🔵 Conclusion
Mastering Market Structure and understanding the relationship between BOS and CHOCH allows traders to see the market with greater clarity and confidence. These two elements reveal how liquidity moves through different phases of expansion and retracement and how institutional order flow shifts between accumulation and distribution.
By analyzing both internal and external structures, traders can align short term and long term perspectives and anticipate where price is most likely to react. The ability to read these structural shifts helps identify continuation points, reversals and areas where liquidity is engineered or collected.
Incorporating Market Structure into a consistent trading process transforms the way a trader views the chart. Instead of reacting to random movements, each swing, break and shift becomes part of a logical framework that reflects the true behavior of the market. Understanding BOS and CHOCH is not just a concept but a complete language of price that guides every professional decision in Smart Money and ICT based trading.

Ichimoku PourSamadi Signal [TradingFinder] KijunSen Magic Number🔵 Introduction
The Ichimoku Kinko Hyo system is one of the most comprehensive market analysis tools ever created. Developed by Goichi Hosoda, a Japanese journalist in the 1930s, its purpose was to allow traders to recognize the balance between price, time, and momentum at a single glance. (In Japanese, Ichimoku literally means “one look.”)
At the core of the system lie five key components: Tenkan-sen (Conversion Line), Kijun-sen (Baseline), Chikou Span (Lagging Line), and the two leading spans, Senkou Span A and Senkou Span B, which together form the well-known Kumo or cloud representing both temporal structure and equilibrium zones in the market.
Although Ichimoku is commonly used to identify trends and support/resistance levels, a deeper layer of time philosophy exists within it. Ichimoku was not designed solely for price analysis but equally for time analysis.
In the classical model, the numerical cycles 9, 26, 52 reflect the natural rhythm of the market originally based on the Tokyo Stock Exchange’s trading schedule in the 1930s.
These values repeat across the system’s calculations, forming the foundation of Ichimoku’s time symmetry where price and time ultimately seek equilibrium.
In recent years, modern analysts have explored new approaches to extract time-based turning points from Ichimoku’s structure. One such approach is the analysis of flat segments on the Kijun-sen and Senkou B lines.
Whenever one of these lines remains flat for a period, it signals temporary balance between buyers and sellers; when the flat breaks, the market exits equilibrium and a new cycle begins.
This indicator is built precisely upon that philosophy. Following the timing methodology introduced by M.A. Poursamadi, the focus shifts away from price signals and line crossovers toward identifying flat periods on Kijun-sen (period 52) as time anchors.
From the first candle that changes the line’s slope, the tool begins a temporal count using a fixed sequence of key numbers: 5, 9, 13, 17, 26, 35, 43, 52, 63, 72, 81, 90.
Derived from both classical Ichimoku cycles and empirical testing, these numbers mark potential timing nodes where a market wave may end, a correction may begin, or a new leg may form.
Thus, this method serves not merely as another Ichimoku tool but as a temporal metronome for market structure a way to visualize moments when the market is ready to change rhythm, often before candles reveal it.
🔵 How to Use
The Kijun Timing BoX is built entirely on Ichimoku’s concept of time analysis.
Its core idea is that within every flat segment of the Kijun-sen, the market enters a temporary balance between opposing forces.
When that flat breaks, a new time cycle begins. From that first breakout candle, the indicator starts counting forward through the predefined time sequence(5, 9, 13, 17, 26, 35, 43, 52, 63, 72, 81, 90).
This counting framework creates a temporal map of market behavior, where each number represents an area where meaningful price fluctuations often occur.
A “meaningful fluctuation” does not necessarily imply reversal or continuation; rather, it marks a moment when the market’s internal energy balance shifts, typically visible as noticeable reactions on lower timeframes.
🟣 Identifying the Anchor Point
The first step is recognizing a valid flat zone on the Kijun-sen.
When this line remains flat for several candles and then changes slope, the indicator marks that bar as the Anchor, initiating the time count.
From that point onward, vertical gray lines appear at each interval in the key-number sequence, visualizing the time nodes ahead.
🟣 Reading the Timing Lines
Each numbered line represents a timing node a temporal point where a change in price rhythm is statistically more likely to occur.
At these nodes, the market may :
Enter a consolidation or minor correction phase.
Develop range-bound movement.
Or simply alter the speed and intensity of its move.
These behaviors do not imply a specific direction; they only highlight zones where time-based activity tends to cluster, giving traders a clearer view of cyclical rhythm.
🟣 Applying Time Analysis
The indicator’s primary use is to observe temporal order, not to predict price direction.
By tracking the distance between Anchors and the reactions that appear near major timing lines, traders can empirically identify each market’s characteristic rhythm—its own time DNA.
For example, one asset may consistently show significant fluctuations around the 13- and 26-bar marks,while another might react closer to 9 or 52. Recognizing such patterns helps traders understand how long typical cycles last before new phases of volatility emerge.
🟣 Combining with Other Tools
The indicator does not generate buy/sell signals on its own.
Its best use is in combination with price- or structure-based methods, to see whether meaningful price reactions occur around the same timing nodes.
In practice, it helps distinguish structured time-based fluctuations from random, noise-driven moves an insight often overlooked in conventional market analysis.
🔵 Settings
🟣 Logical Settings
KijunSen Period : Defines the baseline period used for timing analysis. Default = 52. It is the main line for detecting flats and generating time anchors.
Flat Event Filter : Controls how flat segments are validated before triggering a new timing event.
All : Every flat triggers a new Timing Box.
Automatic : Only flats longer than the historical average are used (recommended).
Custom : User manually defines the minimum flat length via Custom Count.
Update Timing Analysis BoX Per Event : If enabled, a new Timing Box is drawn each time a new flat event occurs. If disabled, the box completes its 90-bar window before refreshing.
🟣 Ichimoku Settings
TenkanSen Period : Defines the period for the Conversion Line (Tenkan-sen). Default = 9.
KijunSen Period : Sets the standard Ichimoku baseline (not the timing line). Default = 26.
Span B Period : Defines the period for Senkou Span B, the slower cloud boundary. Default = 52.
Shift Lines : Offsets cloud projection into the future. Default = 26.
🟣 Display Settings
Users can show or hide all Ichimoku lines Tenkan-sen, Kijun-sen, Chikou Span, Span A, and Span B as well as the Ichimoku Cloud.
They can also customize the color of each element to match personal chart preferences and improve visibility.
🔵 Conclusion
This analytical approach transforms Ichimoku’s time philosophy into a visual and measurable framework. A flat Kijun-sen represents a moment of market equilibrium; when its slope shifts, a new temporal cycle begins.
The purpose is not to forecast price direction but to highlight periods when meaningful fluctuations are more likely to develop.
Through this perspective, traders can observe the hidden rhythm of market time and expand their analysis beyond price into a broader time-cycle dimension.
Ultimately, the method revives Ichimoku’s original principle: the market can only be truly understood through the simultaneous harmony of price, time, and balance.

RSI Signals for Bot (15m close) — JSON FIX v3Bybit Bot RSi:
a lookback indicator that searches for potential short/long plays based on length parameters.

EMA Cloud Visual Pro Edition Trend LabelsThe EMA Cloud Visual Pro Edition is a clean and elegant trend–following indicator designed to visualize market momentum through the interaction of two exponential moving averages — EMA 50 and EMA 200.
Itcombines a dynamic cloud, background tint, and automatic trend labeling to make chart reading effortless and professional.
🌈 Main Features
✅ EMA Cloud Visualization – A smooth gradient cloud between EMA 50 & EMA 200 clearly highlights the prevailing trend.
🟢 Green cloud → Bullish (EMA 50 > EMA 200)
🔴 Red cloud → Bearish (EMA 50 < EMA 200)
✅ Background Tint – Adds subtle color shading (green/red) to improve visual clarity and trend confirmation.
✅ Trend Labels – Automatic floating labels show the current trend direction on the chart:
UpTREND” when EMA 50 crosses above EMA 200
📉 “DOWN TREND” when EMA 50 crosses below EMA 200
⚪ “NEUTRAL” when both are equal
✅ Bar Coloring – Optional feature that colors price candles based on the trend for quick visual reference.
✅ Fully Customizable – Transparency, color tone, and visibility of each visual element (cloud, bars, labels) can be adjusted from the settings panel.
⚙️ How It Works
The indicator tracks the relationship between EMA 50 (short–term trend) and EMA 200 (long–term trend):
When the fast EMA 50 > EMA 200, the market is considered bullish.
When the fast EMA 50 < EMA 200, the market is considered bearish.
This simple but powerful logic is one of the most widely used strategies in professional trading — also known as the EMA Crossover / Golden–Death Cross Strategy — but here visualized with a premium cloud aesthetic.
💡 Best Use Cases
identify trend direction at a glance
Confirm entries/exits from your primary strategy
Combine with RSI, Volume, or Price Action tools
Works perfectly on all assets: Forex, Crypto, Stocks, and Indices
🧩 Customization Tips
You can modify from settings:
EMA lengths (default 50 & 200)
Cloud transparency
Background opacity
Toggle on/off trend labels or bar coloring
⚠️ Note
This indicator is not financial advice.
Always combine it with risk management and confirmation signals before trading live markets.

Smooth Cloud + ZigZag VPOC CORE v6📌 Description
The Smooth Cloud + ZigZag VPOC indicator is designed to help traders visualize market structure and potential confluence zones.
Smooth Cloud: Built from smoothed moving averages (EMA, RMA, or HMA), this cloud highlights the underlying short-term trend by shading bullish and bearish phases.
Pivots (ZigZag style): Marks confirmed swing highs and lows, helping to identify support/resistance and breakout areas without repainting.
VPOC (Volume Point of Control): Plots the price level with the highest traded volume, either from a rolling lookback or anchored to a custom date. This often acts as a magnet or reaction level.
ATR Bands: Optional dynamic bands based on volatility to frame potential extension zones.
Signals & Alerts: Generates long/short labels when price breaks pivot levels in line with trend filters, with optional confluence from HTF trend, VPOC, and ATR.
This tool combines trend context, structure, and volume confluence in a single view to support decision-making.
✅ Notes
This script is intended for technical analysis and educational use only.
It does not provide financial advice or guaranteed outcomes.
Signals are purely analytical and should be combined with independent risk management.

TrendLock Pro 2 — Dual Trend Confirmation📊 TrendLock Pro 2 — Dual Trend Confirmation
🔒 Trade only when the trend is locked and confirmed
TrendLock Pro is a professional no-repaint indicator designed for traders who want to cut through market noise and only capture validated opportunities.
It combines two powerful filters:
TrendScope (current timeframe) → fast detection of momentum shifts through an intelligent RSI setup.
Flow Guard (higher timeframe) → directional filter that only confirms trades aligned with the macro trend.
👉 The result: you only enter when both trends agree , ensuring dual validation before every trade.
🚀 Key Features
✅ No Repaint : signals remain reliable once printed.
✅ Dual Validation : micro-trend (M1, M5…) confirmed by the macro-trend (M15, M30…).
✅ Smart Filters : reduces false signals against the main trend.
✅ Versatile : ideal for M1 scalping, intraday trading, or swing setups.
✅ Built-in Alerts : get notified only when confirmation is strong.
✅ Clear Visuals : green diamonds for confirmed LONGs, red diamonds for confirmed SHORTs.
🎯 Who is it for?
Scalpers seeking safer entries.
Day traders looking to avoid counter-trend traps.
Swing traders preferring cleaner, filtered setups.
💡 Usage Tips
📉 Using Heikin Ashi candles smooths signals and makes them easier to read.
🛡️ Always place your Stop Loss wisely: the indicator doesn’t predict the future but analyzes real-time multi-timeframe trends.
🎯 Avoid being too greedy with Take Profits — aim for balanced targets to maintain a strong win rate.
⚡ Two trends, one signal. Trade with confirmation.

Supply & Demand Limited [DOSALGO]The Supply & Demand Limited indicator is a powerful tool designed to automatically identify and plot significant supply and demand zones on your chart. Based on the core principles of price action, this indicator pinpoints areas where buying or selling pressure has historically been strong enough to cause a substantial shift in the market. By visualizing these key institutional levels, traders can gain a clearer perspective on potential turning points, support/resistance areas, and high-probability trade setups.
This "Limited" version is specifically optimized for higher timeframe analysis and will function exclusively on Daily and Weekly charts, helping traders focus on the most significant market structure.
Key Features
Automatic Zone Detection: The indicator's internal calculation method scans the price action to detect valid supply and demand zones, saving you the time and effort of manual charting.
Identifies Key Patterns: It recognizes classic supply and demand patterns, including Rally-Base-Drop (RBD), Drop-Base-Rally (DBR), and continuation patterns like Rally-Base-Rally (RBR) and Drop-Base-Drop (DBD).
Dynamic Zone Interaction: Zones are not static. The indicator tracks price interaction, changing a zone's color once it has been touched. It can also automatically remove zones that have been significantly penetrated, keeping your chart clean and relevant.
"Level on Level" (LoL) Detection: A unique feature that identifies when new zones form within or overlapping existing ones. These "stacked" zones can often indicate particularly strong areas of confluence.
Built-in Alerts: Never miss an opportunity. Set up custom alerts to notify you the moment a new supply or demand zone is formed or when the price touches an existing zone.
Fully Customizable: Tailor the indicator to your exact trading style with extensive customization options. Adjust everything from the zone definition and colors to the number of zones displayed on your chart.
How to Use This Indicator
The primary goal of this indicator is to highlight potential areas where the market may reverse or pause.
Identify Potential Reversal Points: A supply zone (red) above the current price may act as resistance, presenting a potential area for short entries. A demand zone (green) below the current price may act as support, offering a potential area for long entries.
Confirm with Other Tools: For best results, use these zones in conjunction with your existing trading strategy. Confirm signals with other indicators, trend analysis, or fundamental factors to increase confidence.
Set Stop-Loss and Take-Profit: The boundaries of the zones can serve as logical guides for placing stop-loss orders (e.g., just above a supply zone or just below a demand zone) and for setting profit targets.
Settings Explained
Zone Definition
Show "Level on Level" (LoL) Labels: Toggles the "(LoL)" text on zones that are stacked on top of each other.
Include Continuation Patterns?: Choose whether to display only reversal patterns (RBD, DBR) or also include continuation patterns (RBR, DBD).
Zone Type: Select how zones are drawn.
Wider: Uses the full high/low of the base candles for a larger zone.
Preferred: Uses a more precise calculation to define the zone, often resulting in a tighter, more refined area.
Max Base Candles in Zone: Sets the maximum number of consolidation (base) candles allowed for a valid zone to be formed.
Zone Display & Limits
Limit Supply/Demand Zones: Toggle on or off to limit the number of zones displayed.
Max Supply/Demand Zones: When the limit is on, this sets the maximum number of the most relevant supply or demand zones to show on the chart.
Zone Interaction
Delete Zone on Deep Wick Penetration?: If enabled, the indicator will automatically remove a zone from the chart if the price penetrates it by a significant amount.
Remove Tested Zone %: Defines how much the price must penetrate a zone (as a percentage of the zone's height) to be considered "deep" and trigger its removal.
Colors & Style
Full customization over the colors for fresh and touched supply and demand zones, as well as the appearance of the zone labels.
Alerts
Alert on New Zone Creation?: Enable to receive an alert when a new zone is confirmed.
Alert on Zone Touch?: Enable to receive an alert when the price first enters an existing zone.
Disclaimer: This indicator is a tool for technical analysis and should not be considered financial advice. All trading involves risk. Always conduct your own research and analysis before making any trading decisions. Past performance is not indicative of future results.

Exhaustion Detector by exp3rtsThis advanced indicator is designed to spot buyer and seller exhaustion zones by combining candle structure, volume anomalies, momentum oscillators, and support/resistance context. Optimized for the 5-minute chart, it highlights potential turning points where momentum is likely fading.
Multi-factor detection – Uses RSI, Stochastic, volume spikes, wick-to-body ratios, and ATR context to identify exhaustion.
Smart filtering – Optional trend filter (EMA) and support/resistance proximity filter refine signals.
Cooldown logic – Prevents repeated signals in rapid succession to reduce noise.
Confidence scoring – Each exhaustion signal is graded for strength, so you can gauge conviction.
Visual clarity – Clear arrows mark exhaustion signals, background zones highlight pressure areas, and debug labels show score breakdowns (toggleable).
Use this tool to:
Anticipate potential reversals before price turns
Spot exhaustion at key support/resistance zones
Add a contrarian signal filter to your trading system

THOR SignalTHOR Signal Indicator
Trend Regime Detection via Volatility-Normalized Acceleration Scoring
The THOR Signal Indicator classifies market direction into “long-favorable” or “short/risk-off” regimes using a three-layer signal process that adapts to volatility, momentum strength, and directional consistency. This script is specifically designed for swing traders looking to reduce false positives during choppy or trendless periods.
⸻
How It Works
THOR does not use standard technical indicators like RSI, MACD, or moving average crossovers. Instead, it creates a composite signal using three custom-calculated conditions:
1. Volatility-Normalized Price Deviation:
• Measures how far price has moved relative to recent volatility.
• Helps distinguish between meaningful trend movement and noise.
2. Directional Acceleration Score:
• Calculates the second derivative (rate of change of momentum) of a smoothed trend backbone.
• Signals regime shifts only when acceleration exceeds a dynamic threshold.
3. Persistence Filter:
• Applies a custom smoothing layer (similar to a Kalman filter) to confirm that directional strength is sustainable and not short-term whipsaw.
• Filters out one-bar momentum spikes.
A signal is plotted only when all three layers agree:
• Green dot = Long-side favorable regime
• Red dot = Short-side or risk-off regime
⸻
Why This Is Different
Unlike standard momentum tools that rely on fixed thresholds (like RSI overbought/oversold levels), THOR dynamically adapts its regime criteria based on the asset’s own behavior. It avoids laggy confirmation signals by using real-time volatility conditioning and trend persistence scoring.
It is not a mashup of public indicators. No MA crossovers, Bollinger Bands, or known oscillator logic is used. The architecture is original and built entirely from low-level functions and mathematical modeling.
⸻
How to Use It
• Best timeframes: Weekly, Daily, or Renko
• Use bar-close confirmation only (do not trade intrabar signals)
• Green dot: Consider long position or hold existing longs
• Red dot: Consider exiting longs or entering defensive stance
• Use with existing risk management and discretionary context
⸻
Use Case
• Swing trade filter
• Trend regime switch detector
• Allocation toggling (risk-on vs risk-off)
⸻
Disclosures
This is a closed-source script. Logic has been explained conceptually to comply with TradingView script publishing policies. No proprietary code is exposed. The tool is not intended as financial advice and does not guarantee accuracy or profitability.

Wave Surge [sma]Overview
Wave Surge is indicator that visualizes market waves through dynamic price oscillations around a moving average baseline. It combines wave analysis with RSI filtering to identify trend strength and potential reversals.
How It Works
Core Calculation
The indicator calculates a wave pattern by:
1. Computing a baseline using the average of highest/lowest prices over the specified period
2. Determining a keltner-style center point between this baseline and price SMA
3. Creating a linear regression of the price deviation from this center
4. Generating an adaptive signal line that responds to crossover events
Visual Components
- **Base MA Line**: A moving average (SMA or EMA) that changes color based on RSI zones
- Cyan overlay: RSI is overbought (default >70)
- Yellow overlay: RSI is oversold (default <30)
- Gray: Neutral RSI zone
- Wave Fill: The dynamic area between the MA and wave level
- Green shades: Bullish momentum (wave > 0)
- Red/Orange shades: Bearish momentum (wave < 0)
- Color intensity indicates wave strength (accelerating vs decelerating)
Key Features
- Wave Intensity Control: Adjustable parameter (0.1-2.0) to control wave amplitude
- MA Type Selection: Choose between SMA or EMA for the baseline
- RSI Integration: Hidden RSI filter adds context to the moving average color
- Adaptive Signal: The signal line dynamically adjusts to crossover events
- Fully Customizable Colors: All visual elements can be customized
Originality Statement
This indicator uses a unique combination of:
- Custom wave calculation based on price deviation from keltner-style center
- Linear regression applied to normalized price distance
- Adaptive signal line that recalculates on wave direction changes
- Multi-layered RSI integration for contextual MA coloring
The wave fill visualization creates a dynamic oscillating band that responds to both momentum strength and direction changes.
For educational purposes only. Not financial advice.

DX Fibonacci LevelsDX Fibonacci Levels Indicator
This Pine Script code implements a custom Fibonacci levels indicator that displays key Fibonacci retracement and extension levels on a price chart. The indicator helps traders identify potential support, resistance, and breakout areas by plotting significant Fibonacci levels based on the most recent high and low price range.
How to Use the Indicator:
Interpretation of Fibonacci Levels:
The indicator plots the following Fibonacci levels:
23.6% Retracement (Gray Line): This level represents a shallow retracement and is often considered a potential minor support or resistance area. It can signal a short-term price correction.
38.2% Retracement (Blue Line): One of the most widely used retracement levels. A price reversal at this level is seen as a potential indication of a strong move in the original direction.
50.0% Retracement (Gray Line): Although not a Fibonacci ratio itself, this level is a psychological midpoint. A 50% retracement often represents a neutral point where price could either reverse or continue in the original direction.
61.8% Retracement (Yellow Line): A key level for traders, as it is considered the "golden ratio" of Fibonacci. It is a critical area for determining the continuation of the trend or a potential reversal.
78.6% Retracement (Red Line): This level is closer to the 100% retracement and indicates a deeper pullback. It can represent an area of strong support or resistance.
100.0% (Purple Line): This level is equivalent to the recent low. It represents the full retracement or the lowest price point within the selected range.
127.2% Extension (Green Line): A Fibonacci extension level, indicating a potential area where price could extend beyond the previous high. This level often marks the beginning of a new trend or significant price movement.
161.8% Extension (Green Line): Another Fibonacci extension, marking an even further price projection. Traders use this level to forecast a continuation of the price movement in the direction of the prevailing trend.
Using the Indicator in Trading:
Identifying Support and Resistance: When the price approaches one of the key retracement levels (such as 38.2%, 50%, or 61.8%), traders often watch for signs of a reversal, like candlestick patterns or volume spikes, as these could indicate a potential entry or exit point.
Trend Continuation: If the price retraces to one of these levels and then continues in the direction of the trend, it can confirm that the trend is still intact. The extension levels (127.2% and 161.8%) help identify where the price may head next if the trend continues.
Breakout Zones: The extension levels can also act as breakout points. A price that surpasses the 100% level could indicate that the trend is gaining momentum, with potential for further movement beyond the 127.2% and 161.8% levels.
Chart Customization:
Color-Coded Fibonacci Levels: Each Fibonacci level is color-coded for easy identification:
Gray: 23.6% and 50.0% retracement levels
Blue: 38.2% retracement level
Yellow: 61.8% retracement level
Red: 78.6% retracement level
Purple: 100.0% level (the low of the range)
Green: 127.2% and 161.8% extension levels
The use of different colors allows for quick visual analysis, helping traders to distinguish between retracement and extension levels while identifying critical price zones on the chart.
Tips for Effective Use:
Monitor Price Action: Watch for price action signals like candlestick patterns, reversals, or trend-following indicators around these Fibonacci levels.
Combine with Other Indicators: To improve the reliability of the Fibonacci levels, combine them with other technical analysis tools such as moving averages, RSI, or MACD for confirmation of potential reversals or breakouts.
Adjust the Lookback Period: The lookback period can be adjusted to fit the time frame and asset being traded. A shorter lookback period may provide more sensitive levels, while a longer one may offer more reliable, long-term reference points.
This indicator is most useful when combined with your trading strategy to spot potential price points for reversals or continued movements.

ICT Venom Trading Model [TradingFinder] SMC NY Session 2025SetupIntroduction
The ICT Venom Model is one of the most advanced strategies in the ICT framework, designed for intraday trading on major US indices such as US100, US30, and US500. This model is rooted in liquidity theory, time and price dynamics, and institutional order flow.
The Venom Model focuses on detecting Liquidity Sweeps, identifying Fair Value Gaps (FVG), and analyzing Market Structure Shifts (MSS). By combining these ICT core concepts, traders can filter false breakouts, capture sharp reversals, and align their entries with the real institutional liquidity flow during the New York Session.
Key Highlights of ICT Venom Model :
Intraday focus : Optimized for US indices (US100, US30, US500).
Time element : Critical window is 08:00–09:30 AM (Venom Box).
Liquidity sweep logic : Price grabs liquidity at 09:30 AM open.
Confirmation tools : MSS, CISD, FVG, and Order Blocks.
Dual setups : Works in both Bullish Venom and Bearish Venom conditions.
At its core, the ICT Venom Strategy is a framework that explains how institutional players manipulate liquidity pools by engineering false breakouts around the initial range of the market. Between 08:00 and 09:30 AM New York time, a range called the “Venom Box” is formed.
This range acts as a trap for retail traders, and once the 09:30 AM market open occurs, price usually sweeps either the high or the low of this box to collect stop-loss liquidity. After this liquidity grab, the market often reverses sharply, giving birth to a classic Bullish Venom Setup or Bearish Venom Setup
The Venom Model (ICT Venom Trading Strategy) is not just a pattern recognition tool but a precise institutional trading model based on time, liquidity, and market structure. By understanding the Initial Balance Range, watching for Liquidity Sweeps, and entering trades from FVG zones or Order Blocks, traders can anticipate market reversals with high accuracy. This strategy is widely respected among ICT followers because it offers both risk management discipline and clear entry/exit conditions. In short, the Venom Model transforms liquidity manipulation into actionable trading opportunities.
Bullish Setup :
Bearish Setup :
🔵 How to Use
The ICT Venom Model is applied by observing price behavior during the early hours of the New York session. The first step is to define the Initial Range, also called the Venom Box, which is formed between 08:00 and 09:30 AM EST. This range marks the high and low points where institutional traders often create traps for retail participants. Once the official market opens at 09:30 AM, price usually sweeps either the top or bottom of this box to collect liquidity.
After this liquidity grab, the market tends to reverse in alignment with the true directional bias. To confirm the setup, traders look for signals such as a Market Structure Shift (MSS), Change in State of Delivery (CISD), or the appearance of a Fair Value Gap (FVG). These elements validate the reversal and provide precise levels for trade execution.
🟣 Bullish Setup
In a Bullish Venom Setup, the market first sweeps the low of the Venom Box after 09:30 AM, triggering sell-side liquidity collection. This downward move is often sharp and deceptive, designed to stop out retail long positions and attract new sellers. Once liquidity is taken, the market typically shifts direction, forming an MSS or CISD that signals a reversal to the upside.
Traders then wait for price to retrace into a Fair Value Gap or a demand-side Order Block created during the reversal leg. This retracement offers the ideal entry point for long positions. Stop-loss placement should be just below the liquidity sweep low, while profit targets are set at the Venom Box high and, if momentum continues, at higher session or daily highs.
🟣 Bearish Setup
In a Bearish Venom Setup, the process is similar but reversed. After the Initial Range is defined, if price breaks above the Venom Box high following the 09:30 AM open, it signals a false breakout designed to collect buy-side liquidity. This move usually traps eager buyers and clears out stop-losses above the high.
After the liquidity sweep, confirmation comes through an MSS or CISD pointing to a reversal downward. At this stage, traders anticipate a retracement into a Fair Value Gap or a supply-side Order Block formed during the reversal. Short entries are taken within this zone, with stop-loss positioned just above the liquidity sweep high. The logical profit targets include the Venom Box low and, in stronger bearish momentum, deeper session or daily lows.
🔵 Settings
Refine Order Block : Enables finer adjustments to Order Block levels for more accurate price responses.
Mitigation Level OB : Allows users to set specific reaction points within an Order Block, including: Proximal: Closest level to the current price. 50% OB: Midpoint of the Order Block. Distal: Farthest level from the current price.
FVG Filter : The Judas Swing indicator includes a filter for Fair Value Gap (FVG), allowing different filtering based on FVG width: FVG Filter Type: Can be set to "Very Aggressive," "Aggressive," "Defensive," or "Very Defensive." Higher defensiveness narrows the FVG width, focusing on narrower gaps.
Mitigation Level FVG : Like the Order Block, you can set price reaction levels for FVG with options such as Proximal, 50% OB, and Distal.
CISD : The Bar Back Check option enables traders to specify the number of past candles checked for identifying the CISD Level, enhancing CISD Level accuracy on the chart.
🔵 Conclusion
The ICT Venom Model is more than just a reversal setup; it is a complete intraday trading framework that blends liquidity theory, time precision, and market structure analysis. By focusing on the Initial Range between 08:00 and 09:30 AM New York time and observing how price reacts at the 09:30 AM open, traders can identify liquidity sweeps that reveal institutional intentions.
Whether in a Bullish Venom Setup or a Bearish Venom Setup, the model allows for precise entries through Fair Value Gaps (FVGs) and Order Blocks, while maintaining clear risk management with well-defined stop-loss and target levels.
Ultimately, the ICT Venom Model provides traders with a structured way to filter false moves and align their trades with institutional order flow. Its strength lies in transforming liquidity manipulation into actionable opportunities, giving intraday traders an edge in timing, accuracy, and consistency. For those who master its logic, the Venom Model becomes not only a strategy for entry and exit, but also a deeper framework for understanding how liquidity truly drives price in the New York session.

Cycle Indicator CS7This indicator visualizes cyclical structures (including inverse cycles) for financial instruments.
It is highly customizable and comes with a default configuration optimized for cryptocurrencies on a 45-minute timeframe, highlighting the following cycles:
• T-3: Daily cycles
• T-2: Approximately 2-day cycles
• T+1: Bi-weekly cycles
• T-1: Approximately 4-day cycles
• T: Weekly cycles
The same setup can also be applied effectively on a 24-hour timeframe, highlighting the following longer-term cycles:
• T+2: Monthly cycles
• T+3: Quarterly cycles
• T+4: Semi-annual cycles
• T+5: Annual cycles
• T+6: Bi-annual cycles
Users can customize the configurations to suit the specific characteristics of any financial instrument.
Additionally, the indicator includes a prediction system that approximates future cycles, marking them with a “?”.

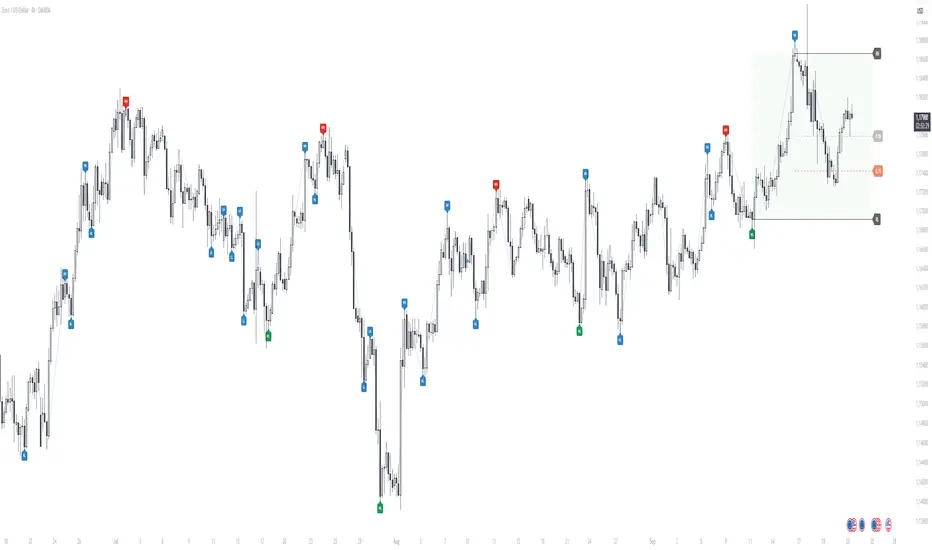
Advanced Market Structure [OmegaTools]📌 Market Structure
Advanced Market Structure is a next–generation indicator designed to decode price structure in real time by combining classical swing–based analysis with modern quantitative confirmation techniques. Built for traders who demand both precision and adaptability, it provides a robust multi–layered framework to identify structural shifts, trend continuations, and potential reversals across any asset class or timeframe.
Unlike traditional structure indicators that rely solely on visual swing identification, Market Structure introduces an integrated methodology: pivot detection, Donchian trend modeling, statistical confirmation via Z–Score, and volume–based validation. Each element contributes to a comprehensive, systematic representation of the underlying market dynamics.
🔑 Core Features
1. Five Distinct Market Structure Modes
Standard Mode:
Captures structural breaks through classical swing high/low pivots. Ideal for discretionary traders looking for clarity in directional bias.
Confirmed Breakout Mode:
Requires validation beyond the initial pivot break, filtering out noise and reducing false positives.
Donchian Trend HL (High/Low):
Establishes structure based on absolute highs and lows over rolling lookback windows. This approach highlights broader momentum shifts and trend–defining extremes.
Donchian Trend CC (Close/Close):
Similar to HL mode, but calculated using closing prices, enabling more precise bias identification where close–to–close structure carries stronger statistical weight.
Average Mode:
A composite methodology that synthesizes the four models into a weighted signal, producing a balanced structural bias designed to minimize model–specific weaknesses.
2. Dynamic Pivot Recognition with Auto–Updating Levels
Swing highs and lows are automatically detected and plotted with adaptive horizontal levels. These dynamic support/resistance markers continuously extend into the future, ensuring that historically significant levels remain visible and actionable.
3. Color–Adaptive Candlesticks
Price bars are dynamically recolored to reflect the prevailing structural regime: bullish (default blue), bearish (default red), or neutral (gray). This enables instant visual recognition of regime changes without requiring external confirmation.
4. Statistical Reversal Triggers
The script integrates a 21–period Z–Score calculation applied to closing prices, combined with multi–layered volume confirmation (SMA and EMA convergence).
Bullish trigger: Z–Score < –2 with structural confirmation and volume support.
Bearish trigger: Z–Score > +2 with structural confirmation and volume support.
Signals are plotted as diamond markers above or below the bars, identifying potential high–probability reversal setups in real time.
5. Integrated Alpha Backtesting Engine
Each market structure mode is evaluated through a built–in backtesting routine, tracking hit ratios and consistency across the most recent ~2000 structural events.
Performance metrics (“Alpha”) are displayed directly on–chart via a dedicated Performance Dashboard Table, allowing side–by–side comparison of Standard, Confirmed Breakout, Donchian HL, Donchian CC, and Average models.
Traders can instantly evaluate which structural methodology best adapts to the current market conditions.
🎯 Practical Advantages
Systematic Clarity: Eliminates subjectivity in defining structural bias, offering a rules–based framework.
Statistical Transparency: Built–in performance metrics validate each mode in real time, allowing informed decision–making.
Noise Reduction: Confirmed Breakouts and Donchian modes filter out common traps in structural trading.
Multi–Asset Adaptability: Optimized for scalping, intraday, swing, and multi–day strategies across FX, equities, futures, commodities, and crypto.
Complementary Usage: Works as a stand–alone structure identifier or as a quantitative filter in larger algorithmic/trading frameworks.
⚙️ Ideal Users
Discretionary traders seeking an objective reference for structural bias.
Quantitative/systematic traders requiring on–chart statistical validation of structural regimes.
Technical analysts leveraging pivots, Donchian channels, and price action as part of broader frameworks.
Portfolio traders integrating structure into multi–factor models.
💡 Why This Tool?
Market Structure is not a static indicator — it is an adaptive framework. By merging classical pivot theory with Donchian–style momentum analysis, and reinforcing both with statistical backtesting and volume confirmation, it provides traders with a unique ability:
To see the structure,
To measure its reliability,
And to act with confidence on quantifiably validated signals.

Morning Peak FadeMorning Peak Fade is an intraday analysis tool that identifies and measures the probability of early session rallies turning into sharp pullbacks.
📊 Core Idea
• Many stocks surge after the open, reaching an intraday peak before fading lower.
• This script anchors at the first significant morning high and tracks the drawdowns that follow within a customizable time window.
• It provides:
• Probability of a fade after the peak
• Average and maximum drawdown statistics
• Event-day hit rate (how often such setups occur)
🎯 Use Cases
• Spot potential “fade setups” where early enthusiasm exhausts quickly.
• Quantify how often chasing the morning high turns into a losing trade.
• Backtest opening range failure or fade strategies with hard data.
⚙️ Features
• Customizable thresholds for the initial surge (relative to prior close).
• Marks the peak (max) and subsequent low (min) used in calculations.
• Draws a reference line at the surge threshold to visualize when the fade triggers.
• Outputs summary stats directly on the chart.

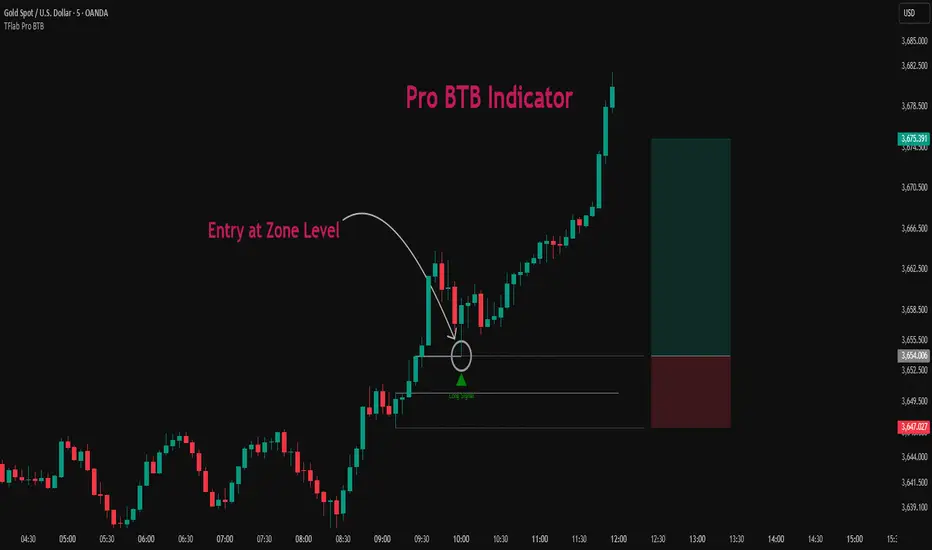
Pro BTB Pour Samadi Indicator [TradingFinder] Back To Breakeven🔵 Introduction
The Pro BTB (Professional Back To Breakeven) strategy is one of the most advanced price action setups, designed and taught by Mohammad Ali Poursamadi, an international Iranian trader and a well-known instructor of financial market analysis.
The main logic of this strategy is based on the natural behavior of the market :
Breakout of a key level: Price moves beyond an important support or resistance.
Retest / Back To Breakeven: Price returns to the broken level.
Continuation of the main trend: Entry at this point allows alignment with the dominant market direction.
To better understand Pro BTB, it is necessary to first know the concept of a Spike. A spike refers to a sudden and powerful movement of price in one direction, usually caused by heavy order flow. Such a move creates an Imbalance between buyers and sellers. Because the market does not have enough time to distribute orders fairly, it leaves an Inefficiency on the chart.
The direct result of this process is the formation of a Fair Value Gap (FVG) a gap between candles that shows trades were not distributed evenly. In simple terms: the spike is the cause, and Imbalance, Inefficiency, and FVG are its consequences.
In practice, Pro BTB works effectively in both bullish and bearish structures. In a Bullish Setup, a bullish spike first breaks a resistance level. Then, when price returns to that same level, a safe and low-risk buying opportunity is created. Conversely, in a Bearish Setup, a bearish spike breaks a support level, and when price comes back to the broken level, it provides the best conditions for a short entry. These two examples illustrate how Pro BTB logic provides precise, low-risk entries in both directions of the market.
🔵 How to Use
The Pro BTB (Back To Breakeven) strategy allows traders to enter precisely after price returns to the breakout level; this way the entry aligns with the natural market flow while risk is minimized. In practice, this method is simple yet powerful: first, identify a valid breakout on a key level, then wait for price to return to that level, and finally, take the entry in the direction of the main trend.
🟣 Bullish Setup
When a bullish spike occurs and a key resistance is broken, price usually returns to the same level. This level, now acting as support, provides the best opportunity for a long entry. In this scenario, the stop-loss is placed behind the breakout candle or slightly below the broken level, and the take-profit target should be defined with at least a 1:2 risk-to-reward ratio. With strong momentum, higher targets can also be considered.
🟣 Bearish Setup
In a bearish scenario, a bearish spike breaks a key support. After the breakout, price usually returns to the same level, which now acts as resistance. This creates the best conditions for a short entry. The stop-loss is placed behind the breakout candle or slightly above the broken level, while the take-profit target is set with a risk-to-reward ratio greater than 1:2.
🟣 General Rules of Pro BTB
To apply Pro BTB correctly, several key rules must be followed :
The breakout must be valid and occur on a key level.
Always wait for the retest; do not enter immediately after the breakout.
Entry should only happen when price touches the broken level and shows candlestick confirmation.
The stop-loss (SL) must be placed behind the breakout candle or the broken level.
The take-profit (TP) must always be at least twice the trade risk.
For higher reliability, the breakout should align with the trend on higher timeframes.
🟣 Six Entry Methods in Pro BTB
For greater flexibility, Pro BTB offers six standard entry methods :
Market Entry : Enter immediately at the breakout level.
Limit Order : Place a limit order on the breakout level.
Stop Order : Enter only after confirmation of continuation.
Confirmation Candle : Enter after a confirmation candle closes on the level.
Pattern Entry : Enter based on candlestick patterns such as Pin Bar or Engulfing.
Zone Entry : Enter from a zone instead of an exact point to account for market noise.
🔵 Setting
🟣 Spike Filter | Movement
Minimum Spike Bars : Defines the minimum number of consecutive candles required for a valid spike.
Movement Power : Enables or disables the momentum-based spike filter.
Movement Power Level : Sets the strength threshold; higher values filter out weaker moves and only detect strong spikes.
🟣 Spike Filter | Gap
Gap Filter : Enables or disables the gap filter.
Gap Type : Selects which type of gap should be detected (All Gaps, Significant, Structural, Major).
🟣 Spike Filter | Doji
Doji Tolerance : Defines whether doji candles are allowed within a spike.
Max Doji Body Ratio : Maximum ratio of body-to-total candle size for classifying a candle as a doji.
Max Doji in Spike Ratio : Maximum percentage of doji candles allowed within a spike.
🟣 Position Management
Stop-Loss Threshold : Enables or disables the stop-loss threshold feature.
Stop-Loss Threshold Value : Defines the value of the stop-loss threshold for risk management.
Risk-Reward Ratio : Sets the desired risk-to-reward ratio (e.g., 1:1 or 1:2).
Include SL Threshold in R:R : Determines whether the stop-loss threshold is included in risk-to-reward calculations.
🟣 Display Settings
Display Mode : Chooses between Setup (showing setups) or Signal (showing trade signals).
Show Entry Levels: Displays entry levels on the chart (buy/sell zones) when enabled
Only Display the Last Position : Displays only the most recent position on the chart when enabled.
Setup Width Drawing : Adjusts the visual width of the setup drawings on the chart for better visibility.
🟣 Alert
Alert : Enables alert notifications. When turned on, you can set TradingView alerts to receive notifications once the setup or signal conditions are met
🔵 Conclusion
The Pro BTB (Back To Breakeven) strategy is a smart and structured entry method based on natural market behavior after a breakout and retest of the broken level. It helps traders avoid emotional, high-risk entries by waiting for market confirmation and entering precisely at a point that aligns with the main trend and sits closest to the key level.
The simplicity of its rules, flexibility in entry methods, and a risk-to-reward ratio above 2 have made Pro BTB one of the most popular tools among price action traders. Nevertheless, as with any strategy, it is recommended to practice it in demo accounts or through personal backtesting before applying it to real trading, in order to find the entry conditions that best suit your trading style.
Trading Mastery Indicator# Trading Mastery Indicator - Complete User Guide
## Overview
The Trading Mastery Indicator is a professional-grade technical analysis tool that provides high-probability trading signals with complete trade management information including entry, stop loss, and take profit levels.
## Key Features
- High-Quality Signal Detection: Identifies strong, medium, and weak trading opportunities
- Complete Trade Setup: Provides entry, stop loss, and take profit for every signal
- Risk Management: Calculates risk-to-reward ratios automatically
- Elliott Wave Analysis: Integrated wave pattern and position analysis
- Active Signal Tracking: Shows when you're currently in a trade
- Professional Alerts: Detailed notifications with all trade parameters
## Signal Quality Classification
### STRONG Signals (Premium Quality)
- Reliability: Highest probability setups
- Market Conditions: Strong trending environments
- Color: Teal for buys, Red for sells
- When to Trade: These are your primary trading opportunities
- Risk Profile: Lowest risk, highest reward potential
### MEDIUM Signals (Standard Quality)
- Reliability: Good probability setups
- Market Conditions: Moderate trend or consolidation breakouts
- Color: Gold for buys, Purple for sells (Change to Blue Gray)
- When to Trade: Secondary opportunities when strong signals are scarce
- Risk Profile: Moderate risk, good reward potential
### WEAK Signals (Entry Quality)
- Reliability: Lower probability setups
- Market Conditions: Counter-trend or unclear market structure
- Color: Coral for buys, Pink for sells
- When to Trade: Only for experienced traders in specific market conditions
- Risk Profile: Higher risk, variable reward
## How to Use the Indicator
### 1. Signal Settings Configuration
Signal Filter Options:
- All Signals: Shows every trading opportunity (strong, medium, weak)
- High Quality Only: Shows only the highest probability setups
- High + Medium Quality**: Balanced approach filtering out weak signals
Recommended Settings by Experience:
- Beginner: Use "High Quality Only"
- Intermediate: Use "High + Medium Quality"
- Advanced: Use "All Signals" with proper risk management
Label Controls:
- Label Position: Adjust how close labels appear to candles
- Label Text Size: Choose based on screen size and preference
- Maximum Labels: Control chart clutter (recommended: 20)
### 2. Understanding the Professional Panel
The panel provides real-time market intelligence:
Primary Trend: Market direction analysis
- BULLISH TREND: Look for buy opportunities only
- BEARISH TREND: Look for sell opportunities only
- CONSOLIDATION: Market indecision, trade with caution
Wave Pattern: Elliott Wave structure analysis
- IMPULSE UP: Strong bullish momentum
- IMPULSE DOWN: Strong bearish momentum
- CORRECTION: Sideways/corrective movement
Wave Position: Current Elliott Wave position
- WAVE 3 (STRONG): Most powerful moves, best for trend following
- WAVE 1 OR 5: Beginning or ending waves
- WAVE 2 OR 4: Corrective phases, lower probability
- CORRECTIVE ABC: Wait for pattern completion
Signal Grade: Current signal status
- SIGNAL ACTIVE: You're currently in a trade
- PREMIUM/STANDARD/SPECULATIVE: New signal quality
- NO SIGNAL: No current opportunities
Trading Bias: Overall market direction
- LONG BIAS: Focus on buy opportunities
- SHORT BIAS: Focus on sell opportunities
- NEUTRAL: No clear directional bias
### 3. Reading Signal Labels
Each signal provides complete trade setup information:
```
STRONG BUY
━━━━━━━━━━━━━━━━━━━━
💰 Entry: 1875.50
🛡️ SL: 1860.25
🎯 TP: 1905.75
📈 R:R = 1:2.0
━━━━━━━━━━━━━━━━━━━━
```
Understanding the Information:
- Entry: Exact price level to enter the trade
- SL: Stop loss level (risk management)
- TP: Take profit level (profit target)
- R:R: Risk-to-reward ratio (1:2.0 means you risk 1 to make 2)
### 4. Entry/TP/SL Level Lines
Visual trade management aids:
- Blue Solid Line: Entry level
- Red Dashed Line: Stop loss level
- Green Dashed Line: Take profit level
- Small Labels: "ENTRY", "SL", "TP" markers
## Trading Strategy Guidelines
### Trend Following Strategy
1. Check Panel: Ensure trend aligns with your trade direction
2. Wait for Signals: Only trade in the direction of the primary trend
3. Quality First: Focus on STRONG signals during trending markets
4. Wave Timing: WAVE 3 positions offer the best trending opportunities
### Reversal Strategy
1. Look for Divergence: Panel shows trend change signals
2. Wait for Confirmation: Don't jump early on potential reversals
3. Use MEDIUM Signals: Often good for catching early trend changes
4. Watch Wave Position: CORRECTIVE ABC patterns may signal trend completion
### Risk Management Rules
Position Sizing:
- Risk no more than 1-2% of account per trade
- Use the provided R:R ratios to calculate position sizes
- Stronger signals can justify slightly larger positions
Stop Loss Management:
- Always use the provided stop loss levels
- Never move stops against your position
- Consider trailing stops once trade moves in your favor
Take Profit Strategy:
- Use provided TP levels as minimum targets
- Consider taking partial profits at TP level
- Let strong trends run beyond TP in trending markets
## Best Practices by Timeframe
### Scalping (M1-M5)
- Use "High Quality Only" filter
- Focus on STRONG signals only
- Quick entry and exit
- Expect more false signals due to market noise
### Intraday Trading (M15-H1)
- Use "High + Medium Quality" filter
- Good balance of opportunity and reliability
- Hold trades for several hours
- Most versatile timeframe for the indicator
### Swing Trading (H4-Daily)
- Use "All Signals" with proper analysis
- Hold trades for days to weeks
- Most reliable signals on higher timeframes
- Best for beginners due to less noise
## Panel Customization
Position Options:
- Top Right: Default, doesn't interfere with price action
- Top Left: Good for wide screens
- Bottom corners: Keeps important info visible while analyzing tops
- Middle positions: Central reference, good for multi-monitor setups
Size Options:
- Small: Minimal screen space, good for small screens
- Normal: Balanced visibility and space usage
- Large: Easy reading, good for detailed analysis
Transparency: Adjust 0-95% based on preference and chart background
## Common Mistakes to Avoid
### Signal Interpretation Errors
- Don't ignore the trend: Trading against primary trend reduces success
- Don't chase weak signals: Focus on quality over quantity
- Don't ignore wave position: WAVE 2/4 corrections are lower probability
### Risk Management Errors
- Don't skip stop losses: Every signal includes SL for a reason
- Don't risk too much: Even strong signals can fail
- Don't move stops against position: Stick to the plan
### Psychological Errors
- Don't overtrade: Wait for quality setups
- Don't second-guess strong signals: Trust the analysis
- Don't panic on normal drawdowns: Expect some losing trades
## Alert Configuration
Enable alerts for:
- Strong signals: Primary trading opportunities
- Medium signals: Secondary opportunities (optional)
- Signal active status: Know when you're in trades
Alert messages include complete trade information for easy execution.
## Performance Optimization
### For Best Results:
1. Combine with price action: Look for confluence with support/resistance
2. Consider market sessions: Different sessions have different characteristics
3. Monitor news events: Avoid trading during high-impact news
4. Keep a trading journal: Track which signals work best for your style
### Regular Review:
- Weekly analysis: Review which signal types performed best
- Timeframe assessment: Determine your most profitable timeframes
- Strategy refinement: Adjust filters based on performance data
## Troubleshooting
If you're not seeing signals:
- Check that "Show Buy/Sell Signals" is enabled
- Verify your signal filter isn't too restrictive
- Market may be in a consolidation phase
If labels are cluttered:
- Reduce "Maximum Labels to Show"
- Change label position to "Far from Candle"
- Use smaller label text size
If panel is in the way:
- Change panel position
- Increase transparency
- Reduce panel size
- Toggle panel off temporarily
Remember: This indicator provides analysis and signals, but successful trading also requires proper risk management, emotional discipline, and understanding of market conditions. Always practice with demo accounts before risking real capital, and never risk more than you can afford to lose.

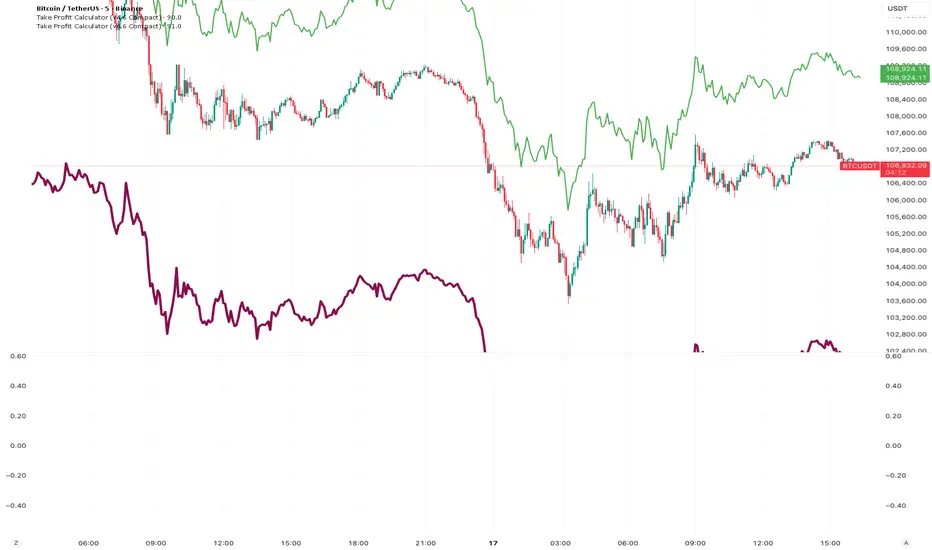
Take Profit CalculatorRelease Notes: Take Profit Calculator v1.0
Introduction
Introducing the Real-Time Take Profit Calculator, a dynamic tool for TradingView designed to instantly calculate and display your target exit price. This indicator eliminates the need for manual calculations, allowing scalpers and day traders to see their profit targets directly on the chart as the market moves.
Key Features
Dynamic Target Calculation: The take-profit line is not static. It recalculates on every tick, moving with the current price to show you the exact target based on a real-time entry point.
Full Trade Customization:
Margin: Set the amount of capital (in USDT) you are allocating to the trade.
Leverage: Input your desired leverage to accurately calculate the total position size.
Desired Profit: Specify your target profit in USDT, and the indicator will calculate the corresponding price level.
Long & Short Support: Easily switch between "Long" and "Short" trade directions. The indicator will adjust the calculation and the visual style accordingly.
Customizable Display:
Change the color and width of the take-profit line for both long and short scenarios.
Toggle a price label on or off for a cleaner chart view.
How to Use
Add to Chart: Apply the "Take Profit Calculator" indicator to your chart.
Open Settings: Double-click the indicator name or the line itself to open the settings panel.
Enter Your Parameters: Under "Trade Parameters," fill in your Margin, Leverage, and Desired Profit.
Select Direction: Choose either "Long" or "Short" from the Trade Direction dropdown.
Analyze: The horizontal line on your chart now represents the exact price you need to reach
Stochastic ExcessThe stochastic indicator is a technical analysis tool used in finance to assess the momentum of an asset’s price. It measures the current closing price relative to its price range over a specified period, usually a short one. This indicator helps identify overbought or oversold conditions, signaling when an asset might be about to reverse its trend.

Pulse FlowPulse Flow is a market structure indicator that extracts the hidden rhythm of price. It combines micro-structure detection with a rule-based trend engine, making waves and turning points visible in real time. Instead of drawing swings by hand or guessing breakouts, Pulse Flow enforces strict, objective rules for what counts as structure.
What it shows
Micro-Structure (Fractals): Internal swings are extracted from baseline crosses (EMA or ALMA). These fractals show how price oscillates inside the wave, providing context for micro pullbacks and internal breaks.
Trend (HH, HL, LH, LL): Pulse Flow uses a finite state machine (FSM) to track the current trend. Every trend represents a wave.
- Confirmed higher highs and higher lows define bullish waves.
- Confirmed lower highs and lower lows define bearish waves.
- When a wave breaks, a new wave begins. Turning points are explicitly marked as WH (wave high) and WL (wave low).
Active Range (RL & RH): The indicator continuously maintains the current range, based on closing prices rather than wicks. This ensures consistent behavior during liquidity events, where extremes are often tested intrabar.
Retracement Levels (0.50 & 0.71): Inside each active range, Pulse Flow plots the midrange and the 0.71 “optimal entry zone,” highlighting areas where pullbacks most often react.
Breakout Confirmation: A breakout is only valid if:
- The close extends beyond RL or RH by at least an ATR-based threshold.
- A second candle confirms the move.
This filters false signals and ensures structural integrity.
How it helps
Pulse Flow helps traders by taking the guesswork out of structure. Instead of debating whether a high or low should count, the indicator applies objective rules and marks every confirmed swing directly on the chart. Each wave is highlighted the moment the trend flips, so you always see where the market has turned and which direction the active wave is heading. The internal fractal structure reveals how price moves within the range, while the explicit HH, HL, LH, and LL points define the external trend. This distinction allows you to make tactical decisions on internal breaks and strategic decisions on external breaks, giving you clarity across timeframes. Because ranges are calculated using closing prices, the levels remain stable even when liquidity sweeps occur, making the indicator reliable in volatile markets. Combined with automatically plotted retracement levels, you gain a consistent framework for spotting likely reaction zones without redrawing lines or relying on subjective judgment.
How it works
Under the hood, Pulse Flow combines two engines. The pivot engine extracts micro swings by tracking how price crosses a baseline, which can be either EMA or ALMA, depending on your settings. Each cross defines a candidate high or low, and together these pivots form the fractal zigzag that represents the market’s micro-structure. On top of this, a finite state machine manages the active range. It tracks the range high and range low, validates breakouts only when price closes beyond these levels with ATR-based confirmation, and waits for a pullback before locking in the new structure. When the FSM confirms a new trend, Pulse Flow explicitly marks the turning point as a wave high or wave low. In this way, every confirmed HH, HL, LH, and LL is not a guess but the logical outcome of strict structural rules. The interaction between pivots and the FSM creates a complete and consistent map of the market’s waves, from micro oscillations to macro trend shifts.
Summary
Pulse Flow extracts micro-structure, defines waves, and highlights turning points. It shows the active range with key retracement levels and confirms breakouts with ATR + candle logic. By using closing prices to define RL/RH, it stays consistent even through liquidity sweeps.
For traders who trade based on structure, Pulse Flow is not just another tool. It is a framework: a rule-based map of how markets actually move in waves.
Дни недели и торговые сесииIndicator for visual analysis by trading sessions and days.
Индикатор для наглядного анализа по торговым сесиям и дням.
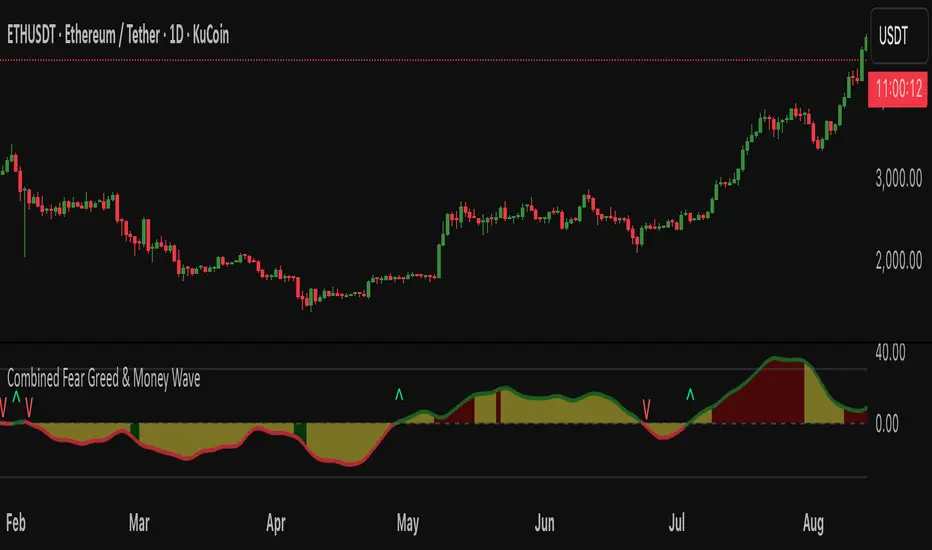
Fear Greed zones and Money Waves FusedThis indicator, named "Fear Greed zones and Money Waves" combines a smoothed Money Flow Index (MFI)-based wave and the Relative Strength Index (RSI) to visualize market sentiment through fear and greed zones and generate buy/sell signals.
Core Functions
- It calculates a zero-centered and smoothed version of the MFI (MoneyWave) using configurable smoothing methods (SMA, EMA, RMA) with parameters for length and smoothing intensity.
- It uses RSI to define fear and greed zones based on user-defined thresholds (e.g., RSI below 30 indicates fear, above 70 indicates greed).
- The MoneyWave area is color-coded based on these fear/greed RSI zones: dark green for fear, dark red for greed, and yellow neutral.
- The edge line of the MoneyWave shows bullish (lime) when above zero and bearish (red) when below zero.
Visual Elements
- Plots the MoneyWave as a colored area with an edge line.
- Displays horizontal lines representing the zero line and upper/lower bounds derived from MFI thresholds.
- Optionally shows direction change arrows when the MoneyWave sign changes and labels indicating BUY or SELL signals based on MoneyWave crossing zero combined with fear/greed conditions.
Trading Signals and Alerts
- Buy signal triggers when MoneyWave crosses upward through zero while in the fear zone (RSI low).
- Sell signal triggers when MoneyWave crosses downward through zero while in the greed zone (RSI high).
- Alerts can be generated for these buy/sell events.
In summary, this indicator provides a combined measure of money flow momentum (MoneyWave) with market sentiment zones (fear and greed from RSI), helping identify potential market entry and exit points with visual markers and alerts .