Macro Risk Trinity [OAS|VIX|MOVE]The Obsolescence of Single-Metric Risk Models
For decades, the CBOE VIX served as the undisputed "fear gauge" of Wall Street. However, the modern financial market structure has evolved to a point where relying on a single univariate indicator is not only insufficient but potentially dangerous. Two structural shifts have fundamentally altered the predictive power of the VIX:
The 0DTE Blind Spot: The VIX calculates implied volatility based on options expiring in 23 to 37 days. Today, massive institutional hedging flows occur intraday via 0DTE (Zero Days to Expiration) options. This creates a "Gamma Suppression" effect: Market makers hedging these short-term flows often dampen realized volatility intraday, effectively bypassing the VIX calculation window. This leads to a suppression of the index, masking risk even during fragile market phases (Bandi et al., 2023).
Goodhart’s Law: "When a measure becomes a target, it ceases to be a good measure." Because algorithmic volatility targeting strategies and risk-parity funds use the VIX as a mechanical trigger to deleverage, market participants have developed an incentive to suppress implied volatility via short-volatility strategies to prevent triggering cascading margin calls.
The Theoretical Framework: Why this Model Works
To accurately navigate this complex environment, the Macro Risk Trinity moves beyond simple price action. It employs a multivariate analysis of the financial system's three core pillars: Rates, Credit, and Equity. The logic is derived from three specific areas of financial research:
1. The Origin of Shock: Volatility Spillover Theory
Macroeconomic shocks typically do not start in the stock market; they originate in the US Treasury market. The MOVE Index acts as the "VIX for Bonds." Research by Choi et al. (2022) demonstrates that bond variance risk premiums are a leading indicator for equity distress. Since the "Risk-Free Rate" is the denominator in every Discounted Cash Flow (DCF) model, instability here forces a repricing of all risk assets downstream.
2. The Foundation: Structural Credit Models (Merton)
While stock prices are often driven by sentiment and liquidity, corporate bond spreads ( High Yield Option Adjusted Spread ) are driven by balance sheets and math. Based on the seminal Merton Model (1974), equity can be viewed as a call option on a firm's assets, while debt carries a short put option risk.
The Thesis: If the VIX (Equity) is low, but OAS (Credit) is widening, a divergence occurs. Mathematically, credit spreads cannot widen indefinitely without eventually pulling equity valuations down. This indicator identifies that specific divergence.
3. The Fragility: Knightian Uncertainty
By monitoring the VVIX (Volatility of Volatility), we detect demand for tail-risk protection. When the VIX is suppressed (low) but VVIX is rising, it signals that "Smart Money" is buying Out-of-the-Money crash protection despite calm waters. This is often a precursor to liquidity events where the VIX "uncoils" violently.
The Solution: Dual Z-Score Normalization
You cannot simply overlay the VIX (an index) with a Credit Spread (a percentage). To make them comparable, this script utilizes a Dual Z-Score Engine.
It calculates the statistical deviation from both a Fast (Quarterly/63-day) and a Slow (Yearly/252-day) mean. This standardizes all data into a single "Stress Unit," allowing us to see exactly when Credit Stress exceeds Equity Fear.
Decoding the Macro Regimes
The indicator aggregates these data streams to visualize the current market regime via the chart's background color:
Systemic Shock (Red Background): The critical convergence. Both Credit Spreads (Solvency) and Equity Volatility (Fear) spike simultaneously beyond extreme statistical thresholds (> 2.0 Sigma). Correlations approach 1, and liquidity evaporates.
Macro Risk / Rates Shock (Yellow Background): Equities are calm, but the MOVE Index is panicking. A warning signal from the plumbing of the financial system regarding inflation or Fed policy errors.
Credit Stress (Maroon Background): The "Silent Killer." The VIX is low (often suppressed), but Credit Spreads (OAS) are widening. This signals a deterioration of the real economy ("Slow Bleed") while the stock market is in denial.
Structural Fragility (Purple Background): VIX is low, but VVIX is rising. A sign of excessive leverage and "Volmageddon" risk (Gamma Squeeze).
Bull Cycle (Green Background): The "Buy the Dip" signal. Even if prices fall and VIX spikes, the background remains green as long as Corporate Credit (OAS) remains stable. This indicates the sell-off is technical, not fundamental.
Technical Specifications
Engineered for the Daily (1D) timeframe.
Institutional Lookbacks: 63 Days (Quarterly) / 252 Days (Yearly).
OAS Lag Buffer: Includes logic to handle the ~24h reporting delay of Federal Reserve (FRED) data to prevent signal flickering.
Scientific Bibliography
This tool is not based on heuristics but on peer-reviewed financial literature:
Bandi, F. M., et al. (2023). The spectral properties of 0DTE options and their impact on VIX. Journal of Econometrics.
Choi, J., Mueller, P., & Vedolin, A. (2022). Bond Variance Risk Premiums. Review of Finance.
Cremers, M., et al. (2008). Explaining the Level and Time-Variation of Credit Spreads. Review of Financial Studies.
Griffin, J. M., & Shams, A. (2018). Manipulation in the VIX? The Review of Financial Studies.
Merton, R. C. (1974). On the Pricing of Corporate Debt. The Journal of Finance.
Author's Note: The Reality of Markets & Overfitting
While this tool is built on robust academic principles, we must address the reality of quantitative modeling: There is no Holy Grail.
This indicator relies on Z-Scores, which assume that future volatility distributions will somewhat resemble the past (Mean Reversion). In data science, calibrating lookback periods (like 63/252 days) always carries a risk of Overfitting to past cycles.
Markets are adaptive systems. If the correlation between Credit Spreads and Equity Volatility breaks (e.g., due to massive fiscal intervention/QE or new derivative products), signals may temporarily diverge. This tool is designed to identify stress, not to predict the future price. It will rhyme with the market, but it will not always repeat it perfectly.
Use it as a compass to gauge the environment, not as an autopilot for your trading.
Use responsibly and always manage your risk.
Disclaimer: This indicator relies on external data feeds from FRED and CBOE. Data availability is subject to TradingView providers.
VVIX

VIX-Price Covariance MonitorThe VIX-Price Covariance Monitor is a statistical tool that measures the evolving relationship between a security's price and volatility indices such as the VIX (or VVIX).
It can give indication of potential market reversal, as typically, volatility and the VIX increase before markets turn red,
This indicator calculates the Pearson correlation coefficient using the formula:
ρ(X,Y) = cov(X,Y) / (σₓ × σᵧ)
Where:
ρ is the correlation coefficient
cov(X,Y) is the covariance between price and the volatility index
σₓ and σᵧ are the standard deviations of price and the volatility index
Enjoy!
Features
Dual Correlation Periods: Analyze both short-term and long-term correlation trends simultaneously
Adaptive Color Coding: Correlation strength is visually represented through color intensity
Market Condition Assessment: Automatic interpretation of correlation values into actionable market insights
Leading/Lagging Analysis: Optional time-shift analysis to detect predictive relationships
Detailed Information Panel: Real-time statistics including current correlation values, historical averages, and trading implications
Interpretation
Positive Correlation (Red): Typically bearish for price, as rising VIX correlates with falling markets. This is what traders should be looking for.
Negative Correlation (Green): Typically bullish for price, as falling VIX correlates with rising markets
How to use it
Apply the indicator to any chart to see its correlation with the default VIX index
Adjust the correlation length to match your trading timeframe (shorter for day trading, longer for swing trading)
Enable the secondary correlation period to compare different timeframes simultaneously
For advanced analysis, enable the Leading/Lagging feature to detect if VIX changes precede or follow price movements
Use the information panel to quickly assess the current market condition and potential trading implications

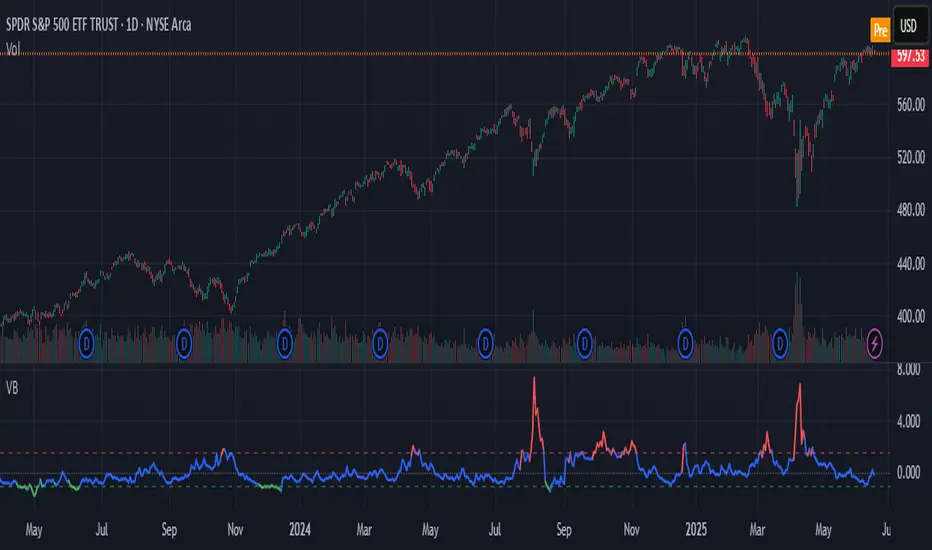
Volatility Barometer (VB)Volatility Barometer (VB)
The Volatility Barometer (VB) is a comprehensive market sentiment indicator designed to measure aggregate stress and fear in the equity market. It consolidates three critical volatility metrics into a single, easy-to-interpret score, providing a broader view of market conditions than any single metric alone.
Core Components
The barometer synthesizes information from:
VIX Index (VIX): The standard measure of implied 30-day stock market volatility.
VVIX Index (VVIX): The volatility of the VIX itself, often seen as the "volatility of volatility." High VVIX readings can signal uncertainty about the VIX's future path.
VIX Futures Term Structure (VX1!−VX2!): The spread between the front-month and second-month VIX futures. A positive spread (contango) is typical, while a negative spread (backwardation) often signals imminent market stress.
How It Works
To create a unified view, the indicator normalizes each of these three components using a Z-score. The Z-score measures how many standard deviations a value is from its historical mean over a user-defined period (defaulting to 252 days, or one trading year).
These three standardized Z-scores are then combined into a final VB Score using a weighted average. Users can customize these weights in the indicator's settings to emphasize the components they find most important.
How to Interpret
The VB Score is plotted as a single line that oscillates around a zero level, with its color changing to reflect the prevailing market regime:
High Stress (Red Line): When the score rises above the "High stress threshold" (default: 1.5), it indicates heightened market fear and risk-off sentiment. This is a period of significant stress, often associated with market downturns.
Low Stress (Green Line): When the score falls below the "Low stress threshold" (default: -1.0), it signals complacency and low perceived risk in the market. Extreme low readings can sometimes precede volatility spikes.
Neutral (Blue Line): Scores between the high and low thresholds represent normal market conditions.
By providing a weighted, multi-faceted view of volatility, the Volatility Barometer helps traders and investors identify market regimes, confirm trading biases, and anticipate potential shifts in market sentiment.
VIX Strategy : Risk-ON, Risk-OFF
VRatio is the ratio of VIX3M and VIX. This ratio rises above 1.1; in a bear market, it decreases and goes below 1. VRatio=VIX3M/VIX. More details in Part 2.
VRatio > 1: Risk-On signal
Contango is the ratio of VX2 (first back-month contract) and VX1 (front-month contract) minus one. In a bull market, this indicator rises above 5%’ in a downtrend market, this indicator goes below -5%. More details in Part 2.
Contango > -5%: Risk-On signal
Contango Roll is the ratio of VX2 first back-month contract) and the VIX minus one. In a bull market, this indicator rises above 10%’ in a downtrend market, this indicator goes below -10%. More details in Part 2.
Contango Roll > 10%: Risk-On signal
Volatility Risk Premium (VRP) compares the implied volatility to the recent realized volatility; it attempts to quantify how much “extra” premium (in volatility term) S&P500 option sellers are charging investors for the protection of their portfolio. It can be seen as an insurance premium. A simple way to compute the VRP is VRP= VIX -HV10 where HV10 is the 10-day historical volatility of S&P500. Some people also look at the 5-day moving average of the VRP to smooth this indicator.
VRP > 0: Risk-On signal
Fast Volatility Risk Premium (FVRP) is a variant of the VRP. FVRP=EMA(VIX,7)-HV5 where HV5 the 5-day historical volatility of S&P500.
FVRP > 0: Risk-On signal
Volatility Momentum compares today’s VIX to last 50 days. It has, therefore, quite a bit of lag but it is a useful measure when combined with other indicators. Volatility Momentum=SMA(VIX,50) -VIX.
Volatility Momentum > 0: Risk-On signal
VIX Mean Reversion looks at today’s VIX compared to certain thresholds. We avoid investing in the S&P500 when the VIX is too high (above 20) or too low (below 12).
VIX Mean Reversion > 12 and VIX Mean Reversion < 20: Risk-On signal
VIX3M Mean Reversion works the same way as VIX Mean Reversion.
VIX3M Mean Reversion > 12 and VIX3M Mean Reversion < 20: Risk-On signal

Vix Jump for Selling Puts or Buying CallsThis script aims to identify optimal times when to write Puts for premium, for example using the SPX Weeklies model or simply buying Calls. Not perfect but provides some additional confidence when playing Puts on SPX or the Wheel on SPY.
What it does:
We compare current VIX with a lookback VIX for X% delta. If there is a jump of say 20% over a defined period then that would indicate an opportunity to sell Puts, run a straddle or buy Calls. We use VVIX as a check to stop to many false positives ie VVIX falls of faster than VIX.
You can also use this loosely as a bottom finder.

The dispersion of volatility indicesThe script is my implementation of "Forecasting a Volatility Tsunami" by Andrew Thrasher (Thrasher Analytics). You can find the paper here: www.researchgate.net
I've changed a bit the approach - instead of two volatility indices (VIX & VVIX), I used two more: VXN and VXD. Additionally, I average the percentiles, but there is an option to swtich it to the original approach.

Correlation overlayThe script is intended to indicate when the correlation between VIX and VVIX gets below 0, on the selecteted security chart. It makes sense to plot it on indicies. This aims to present how the chart of a security looked like when the divergance between VIX and VVIX happened.

XIV Trading Strategy This simple strategy uses VVIX , the VIX of VIX , to find BUY/SELL signals for XIV. The actual return of for this strategy is actually lower than what is produced by Tradingview's backtesting engine ( 525 % vs 221 % in my testing ) . More detail available in my blog.
Cheers
Algo.
