DAF Climax VolIn trading, only two things never lie: extreme price rejection and abnormal volume expansion.
Climax Vol is designed to capture key reversal conditions built on “extreme rejection + abnormal volume”. It’s not a typical MACD or RSI — it focuses on volume-driven divergence at market extremes.
Its working principle is simple and brutal:
When the market drops into a low area, the candle prints a long lower wick, and volume suddenly explodes (for example, 3× the normal level). What does this imply? It often means heavy absorption of panic selling (stopping/absorption behavior).
The same logic applies at the top.
✨ Indicator Features
• Noise rejection: Only monitors major tops and bottoms; ignores mid-trend volume spikes.
• Data visualization: Displays the real-time volume multiplier directly on the candle (e.g., Vol: 2.7x), letting you instantly gauge the intensity of participation.
• Clean interface: No flashy arrows — only candle color changes and key data. Zero chart clutter.
👉 Best for: Major cryptocurrencies like BTC / ETH
👉 Best for: Catching wicks, validating support & resistance, identifying fake breakouts
👉 Best for: Higher timeframes — 4H and 1D recommended for best accuracy
⸻
在交易中,只有两样东西不会骗人:价格的极致拒绝 和 成交量的异常放大。
Climax Vol 用来捕捉「极端价格拒绝 + 异常放量」下的潜在反转条件。它不是普通的 MACD 或 RSI,而是专注于极端位置的量能失衡/放量背离。
它的工作原理很简单粗暴:
当市场跌到低位区域,K线收出长下影,同时成交量突然爆炸(比如平时的 3 倍),这通常意味着恐慌抛压正在被强力承接/吸收(Stopping / Absorption 行为)。顶部同理。
✨ 指标特点
• 拒绝噪音: 只监控阶段性顶底,半山腰的放量不看。
• 数据可视化: 可以在K线上直接看到当前的量能倍数(例如 Vol: 2.7x),一眼看出放量强度。
• 界面清爽: 去掉花里胡哨的箭头,只保留K线变色和关键数据,不干扰盘面。
👉 适用: 主流加密货币 BTC / ETH
👉 适用: 抓针、验证支撑压力位、识别假突破
👉 适用: 时间级别越高越有效,推荐 4小时 / 1天 K线图
볼륨


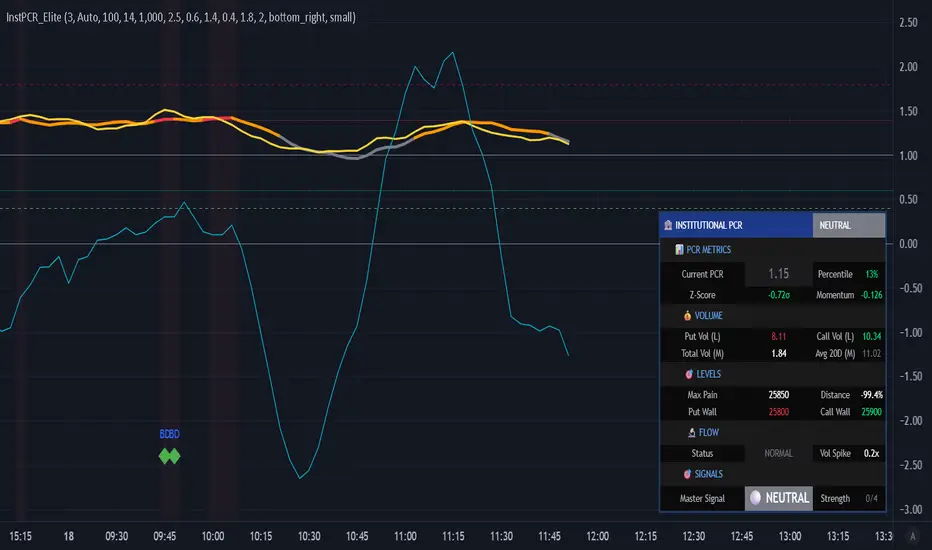
Guru Dronacharya Pro Institutional Option Intelligence# Guru Dronacharya Pro – Institutional Option Intelligence
## 🎯 Professional Options Trading Indicator with Dynamic Intensity System
**Guru Dronacharya Pro** is an advanced institutional-grade indicator designed specifically for **NSE Options traders** (NIFTY, BANKNIFTY, FINNIFTY, MIDCPNIFTY). It combines intelligent option chain analysis, volatility detection, and a revolutionary **intensity-based visualization system** to help you identify high-probability option trades.
***
## ✨ KEY FEATURES
### 🔥 **Dynamic Intensity System** (Unique Feature)
- **Adaptive Brightness**: Candles automatically brighten when movement, volume, and volatility surge
- **Multi-Factor Analysis**: Combines Volume Surge + IV Expansion + Price Acceleration
- **Real-Time Intensity Score**: 0-100% intensity meter for both CE and PE
- **Visual Intelligence**: Instantly spot when options are heating up 🔥
### 🎯 **Intelligent Strike Selection**
- **Auto-Select Best Pair**: Scans ±5 strikes from ATM to find optimal CE/PE pairs
- **Compression Analysis**: Identifies strikes with minimal price difference (premium parity)
- **Liquidity Filter**: Ensures selected options have sufficient volume
- **Manual Override**: Take control with manual strike selection when needed
### 📈 **Advanced Signal Generation**
- **Buy Call Signals**: Triggered on CE breakout + volatility expansion + momentum
- **Buy Put Signals**: Triggered on PE breakout + volatility expansion + momentum
- **Multi-Filter Confirmation**: BBW expansion, EMA trend, delta momentum, dominance
- **No Repainting**: All signals confirmed on bar close
### 📊 **Professional Analytics Panel**
- **🔥 Intensity Metrics**: Real-time CE/PE activity levels
- **PCR (Put-Call Ratio)**: Volume-based market sentiment
- **Volume Delta**: CE vs PE volume comparison with trend
- **IV Percentile**: 1-year implied volatility ranking
- **BBW (Bollinger Band Width)**: Volatility expansion detector
- **Momentum Trackers**: Real-time CE/PE momentum analysis
- **Premium Ratio**: CE/PE price relationship analysis
### 🎨 **Customizable Visualization**
- **Dual Candle Display**: Side-by-side CE and PE premium tracking
- **Normalized View**: % change from open (easier comparison)
- **Absolute View**: Raw premium values
- **EMA Overlays**: Trend confirmation lines
- **Theme-Aware**: Auto-detects dark/light mode for optimal visibility
- **Adjustable Tables**: Position and size controls for metrics panel
***
## 💡 WHAT MAKES IT UNIQUE?
### **1. Intensity-Based Coloring** 🔥
Traditional indicators show static colors. **Guru Dronacharya Pro** uses dynamic brightness:
- **Dim Candles** = Low activity (avoid these setups)
- **Medium Brightness** = Building momentum (watch closely)
- **Bright Candles** = High activity (trade opportunities!) 🔥🔥
This helps you:
✅ Focus on liquid, moving options
✅ Avoid low-volume, dead zones
✅ Identify institutional money flow
✅ Time entries during volatility expansion
### **2. Smart Strike Selection**
No more guessing which strike to trade! The indicator:
- Scans multiple strikes simultaneously
- Finds pairs with balanced premiums
- Filters out illiquid options
- Highlights the best trading pair
### **3. Multi-Timeframe Compatible**
Works on any timeframe:
- **1-5 min**: Scalping and day trading
- **15-30 min**: Intraday swing trades
- **1H+**: Positional option strategies
***
## 📖 HOW TO USE
### **Step 1: Configure Your Symbol**
1. Set **Underlying** (NSE:NIFTY, NSE:BANKNIFTY, etc.)
2. Enter **Expiry Date** (Year, Month, Day)
3. Input **ATM Strike** (rounded to nearest strike interval)
4. Choose **Symbol Format** (NSE Standard, NSE Weekly, or Custom)
### **Step 2: Understand the Display**
**Chart Elements:**
- **Green/Lime Candles** = Call Option (CE)
- **Pink/Magenta Candles** = Put Option (PE)
- **Brightness** = Activity intensity (brighter = more action!)
- **Triangle Up** = Buy Call Signal ▲
- **Triangle Down** = Buy Put Signal ▼
**Metrics Panel (Bottom Right):**
- **🔥 CE/PE INT**: Intensity score (higher = better)
- **PCR**: Above 1.0 = Bullish, Below 1.0 = Bearish
- **VOL Δ**: Positive = CE volume dominance
- **IV%ile**: Above 70 = High IV (premium sellers advantage)
- **BBW**: Expansion indicator (⚡ = expanding)
- **Momentum**: Price acceleration tracker
### **Step 3: Trading Rules**
**For Buying Calls (Bullish):**
1. Wait for ▲ signal below CE candle
2. Check **CE INT > 40%** (moderate to high activity)
3. Confirm **CE BBW ⚡** (volatility expanding)
4. Verify **CE Mom** positive (momentum building)
5. **Entry**: Current CE premium
6. **Target**: Use Fibonacci levels or book on intensity drop
**For Buying Puts (Bearish):**
1. Wait for ▼ signal above PE candle
2. Check **PE INT > 40%** (moderate to high activity)
3. Confirm **PE BBW ⚡** (volatility expanding)
4. Verify **PE Mom** positive (momentum building)
5. **Entry**: Current PE premium
6. **Target**: Use Fibonacci levels or book on intensity drop
**Risk Management:**
- Avoid trades when intensity < 30% (low liquidity)
- Higher intensity = tighter stops (volatile moves)
- Watch for intensity divergence (price up, intensity down = weakness)
***
## ⚙️ SETTINGS GUIDE
### **Group 1: UNDERLYING & SYMBOL**
- **Underlying**: Main index/stock ticker
- **Option Root**: Symbol prefix (NIFTY, BANKNIFTY, etc.)
- **Strike Interval**: 50 for NIFTY, 100 for BANKNIFTY
- **Expiry Date**: Target expiry (Year/Month/Day)
- **Spot Source**: Auto (First 5m), Live Close, or Manual
### **Group 2: OPTION CHAIN SCANNER**
- **ATM Strike**: Center point for scanning (manually input)
- **Scan Range**: ±N strikes to scan (1-5)
- **Compression Threshold**: Max CE-PE difference % (8% default)
- **Min Volume**: Liquidity filter (100 default)
- **Auto-Select**: Enable for automatic best pair selection
### **Group 3: SIGNAL FILTERS**
- **BBW Length**: Volatility calculation period (20 default)
- **BBW Expansion Threshold**: Multiplier for expansion (1.30x)
- **Min BBW**: Minimum volatility % (2.0%)
- **EMA Filter**: Enable trend confirmation (21 EMA)
- **Delta Momentum**: Require CE > PE momentum for calls (vice versa)
### **Group 4: SIGNAL DISPLAY**
- **Show Buy Signals**: Toggle call/put signals
- Simple triangle markers (▲ for calls, ▼ for puts)
### **Group 5: VISUALIZATION**
- **Plot Candles**: Show CE/PE candlesticks
- **Normalize to % Change**: Compare premiums as % (recommended)
- **Show EMA**: Display trend lines
- **Show Metrics Panel**: Display analytics table
- **Table Position**: Move metrics panel (9 positions)
- **Table Size**: Adjust text size (Tiny to Huge)
### **Group 6: OPTION ANALYTICS**
- **Show PCR**: Put-Call Ratio display
- **Show Volume Analysis**: Volume delta tracking
- **Show IV Percentile**: 1-year IV ranking
### **Group 7: INTENSITY SYSTEM** 🔥
- **Enable Intensity Coloring**: Turn on dynamic brightness
- **Intensity Smoothing**: Higher = smoother (3 default)
- **Volume Weight**: Impact of volume surges (35%)
- **IV/BBW Weight**: Impact of volatility expansion (40%)
- **Movement Weight**: Impact of price acceleration (25%)
- **Min Brightness**: Dimmest state (70% transparency)
- **Max Brightness**: Brightest state (0% = fully opaque)
***
## 🎓 TRADING STRATEGIES
### **Strategy 1: Intensity Breakout**
- Wait for intensity to rise from <30% to >60%
- Enter on signal with bright candle
- Exit when intensity drops below 40%
### **Strategy 2: Volatility Expansion**
- Monitor BBW indicator
- Enter on ⚡ expansion + signal
- Target quick 20-30% premium gains
### **Strategy 3: PCR Contrarian**
- PCR > 1.3 = Oversold (look for call signals)
- PCR < 0.7 = Overbought (look for put signals)
- Combine with intensity confirmation
### **Strategy 4: Volume Delta Momentum**
- Strong positive VOL Δ = CE buying pressure
- Enter calls on dips with high CE intensity
- Vice versa for puts
***
## 📋 SUPPORTED EXCHANGES & SYMBOLS
**Exchanges:**
- NSE (National Stock Exchange of India)
**Supported Underlyings:**
- NIFTY 50
- BANKNIFTY
- FINNIFTY
- MIDCPNIFTY
- Individual stocks with liquid options
**Option Formats:**
- NSE Standard: `NSE:NIFTY251230C25900`
- NSE Weekly: `NSE:NIFTY25DEC25900CE`
- Custom/Broker-Specific formats
***
## ⚡ PERFORMANCE OPTIMIZATION
This indicator is optimized for speed:
- **Tuple-based security requests** (80% faster than standard)
- **Minimal repainting** (signals confirmed on bar close)
- **Efficient array operations**
- **Smart caching** of repeated calculations
- Works smoothly even on 1-minute charts
***
## 🚨 ALERTS
Built-in alert conditions:
- **Buy Call Signal**: Triggered on confirmed call entry
- **Buy Put Signal**: Triggered on confirmed put entry
**Setup:**
1. Click "Create Alert" on TradingView
2. Select "Guru Dronacharya Pro"
3. Choose "Buy Call Signal" or "Buy Put Signal"
4. Set notification method (popup/email/webhook)
***
## ⚠️ RISK DISCLAIMER
**IMPORTANT**: This indicator is for **educational purposes only**.
- Options trading carries substantial risk of loss
- Past performance does not guarantee future results
- Always use proper risk management (stop losses, position sizing)
- No indicator guarantees profitable trades
- Test thoroughly on paper/sim before live trading
- Consult a financial advisor before trading
**The creator is not responsible for any trading losses incurred using this indicator.**
***
## 🔄 VERSION HISTORY
**v1.0 (Current)**
- Initial release
- Dynamic intensity system
- Intelligent strike selection
- Multi-filter signal generation
- Professional analytics panel
- Theme-aware visualization
- Full customization support
***
## 💬 FEEDBACK & SUPPORT
Found this indicator helpful? Please:
- ⭐ Leave a rating
- 💬 Share your experience in comments
- 📊 Publish your chart ideas using this indicator
- 🔔 Follow for updates and new indicators
**Questions?** Drop a comment, and I'll help you optimize your settings!
***
## 🏆 WHO IS THIS FOR?
✅ **Intraday Option Traders** (scalping & day trading)
✅ **Swing Option Traders** (multi-day positions)
✅ **Premium Buyers** (directional option strategies)
✅ **Technical Analysts** (volatility & momentum-based)
✅ **NSE Options Specialists** (NIFTY/BANKNIFTY focused)
❌ **NOT suitable for:**
- Complete beginners (learn basics first)
- Premium sellers (different indicator needed)
- Set-and-forget strategies (requires active monitoring)
***
## 🙏 ACKNOWLEDGMENTS
Named after **Guru Dronacharya**, the legendary teacher from Mahabharata known for precision, discipline, and strategic mastery – qualities every successful trader needs.
**May your trades be profitable and your risk be managed! 🚀**
***
**Tags:** Options Trading, NSE Options, NIFTY Options, BANKNIFTY Options, Option Chain Analysis, Volatility Trading, Intensity System, Indian Stock Market, Intraday Trading, Premium Analysis, PCR Indicator, Options Signals
***
**Legal:** This indicator does not constitute financial advice. All trading decisions are your responsibility. Always trade with risk capital you can afford to lose.

Wyckoff Dual WaveBased on the Wyckoff Method this indicator identifies small and large wave structures and generates trend following signals. It uses dual moving averages Small Wave MA and Large Wave MA to analyze wave cycles combined with volume confirmation KD stochastic and double top and bottom patterns for entry and exit signals.
Key featuresDual wave analysis for small and large timeframes. Customizable MA periods and trend confirmation rules including 3 Day Breakaway and Close Confirmation. Volume based signal validation and KD oscillator filters. Visual wave lines trend colors and clear buy and sell labels such as Long Short DBOT DTOP V BUY and V SELL.
Adjust MA periods PCT factors and signal toggles to fit different assets and timeframes. Ideal for Wyckoff focused traders seeking structured wave and trend analysis. Note For optimal use combine with price action and market context.
No suitable analytical tools for Wyckoff waves have been found so far, and most of the indicator’s concepts are derived from Wyckoff’s book The Tape Reading and Market Tactics.
The traditional Wyckoff Theory focuses on wave analysis and daily timeframe analysis, with waves based on percentage changes. This indicator is mainly designed for intraday trading. I developed it on 15-second charts, and it can also be applied to 1-minute, 3-minute, 5-minute and other short timeframes. For Wyckoff wave analysis on the daily timeframe, I will specifically develop a dedicated percentage-based daily Wyckoff wave tool in the future.
Wyckoff waves emphasize dynamic analysis. It is recommended to use this indicator together with support and resistance tools for dynamic analysis. Observe the price behavior when it touches support or resistance levels to decide the next trading move.

DTR + ATR + OR + VWAP PRO (Merged Model)This indicator combined
Day Trading Range
ATR
VWAP
Open Rang for the selected time frame

BT Session VP & VolatilityBT Session VP v0.6 is a professional-grade Session Volume Profile designed for futures, index, and intraday traders who need clean, accurate session structure without clutter.
This tool builds a true volume distribution for each trading session using lower-timeframe data, detects high- and low-volume nodes, and tracks a dynamic Point of Control (POC) to help traders identify balance, acceptance, and trend conditions in real time.
• Index futures, session-based crypto trading
• Intraday equity index trading
• Momentum scalping with session context
• Auction market theory workflows
Features
• True session-based volume profile (RTH or ETH)
• Futures-correct ETH handling (18:00–17:00 session)
• Hard session fencing — no volume bleed between sessions
• Lower-timeframe volume aggregation for accuracy
• Dynamic Point of Control (POC) tracking
• High Volume Nodes (HVN) and Low Volume Nodes (LVN)
• Live session and prior session profiles
• Optional volatility-weighted volume
• Fully customizable colors, opacity, and labels
**Volatility-Weighted Volume** is an optional feature that adjusts how volume contributes to the session profile based on current market volatility.
Instead of treating all volume equally, BT Session VP can weight volume more heavily during periods of expansion and less during periods of compression.
When volatility weighting is enabled:
• If volatility is above its recent average, volume is amplified; below volume is dampened
• The strength of this effect is controlled by a user-defined multiplier
• Volatility weighting does not change price levels, Iit does not introduce signals or repainting. It only affects how volume contributes to the distribution
• The feature can be disabled at any time for a traditional volume profile
The Point of Control is calculated dynamically as the session evolves.
• If the POC remains stable for N bars, the market is considered balanced
• If the POC shifts upward, it reflects bullish acceptance
• If the POC shifts downward, it reflects bearish acceptance
• POC color changes automatically based on these conditions
This allows traders to quickly distinguish between balance, rotation, and trend days.
• HVN represent price levels where the market previously accepted value
• LVN represent areas of rejection or inefficiency
Nodes are filtered using:
• Local dominance logic
• Minimum separation (prevents clustering)
These levels often act as:
• Support / resistance
• Acceptance or rejection zones
• Rotation targets during balance
How traders use BT Session VP
• Identify balance vs trend days early
• Use POC direction to confirm market regime
• Trade rotations between HVNs during balance
• Fade LVNs during rejection
• Use prior session nodes as reaction levels
• Combine with momentum tools for confirmation
This indicator is designed to provide context , not signals.
It works best when combined with execution tools, order flow, or momentum confirmation.

Explosive Candle Detector [CodeAlchemyLab]Explosive Candle Detector
This indicator identifies potential high-momentum trading opportunities by detecting explosive candles that form after consolidation periods (base candles).
How It Works:
The indicator uses a two-candle pattern system:
Base Candle (Boring): A consolidation candle where the wicks are larger than the body, indicating indecision and potential accumulation/distribution by smart money. This represents a compression phase where price is being absorbed.
Explosive Candle: A momentum candle that appears immediately after a base candle, with a size at least 50% larger than the base candle. This represents an expansion phase where price breaks out with strong directional movement.
Features:
• Detects bullish explosive candles (green markers below candle)
• Detects bearish explosive candles (red markers above candle)
• Highlights base candles with background color
• Customizable explosive threshold (default: 50% size increase)
• Clean visual signals for easy pattern recognition
Trading Applications:
• Supply and Demand zone identification
• Breakout confirmation signals
• Momentum trade entries
• Order block detection
• Smart money accumulation/distribution phases
Best Used With:
Support/resistance levels, trend analysis, and volume confirmation for optimal trade setups.
Parameter:
Boring Candle Parameters:
1. Min wick ratio (0.6 = 60%): The total wicks (upper + lower) must be at least 60% of the candle's total range. Higher values = more wick required, meaning the candle is more "indecisive" with long wicks.
2. Max body ratio (0.4 = 40%): The body must be at most 40% of the candle's total range. Lower values = smaller body required, confirming the candle is mostly wicks with a small body.
Example: If candle range is 100 pips, wicks must be ≥60 pips and body must be ≤40 pips.
──────────────────────────────────────────
Explosive Candle Parameters:
3. Min size vs Boring (1.5 = 150%): The explosive candle must be at least 1.5x (or 50% bigger) than the boring candle's range. If boring candle is 100 pips, explosive must be ≥150 pips.
4. Min body ratio (0.5 = 50%): The explosive candle's body must be at least 50% of its total range. This ensures it's a strong directional move with a large body, not just wicks.
──────────────────────────────────────────
In Simple Terms:
• Boring candle = Big wicks, small body (consolidation/indecision)
• Explosive candle = Big body, much larger than boring candle (strong directional move)

VWAP Multi-Timeframe Pro═══════════════════════════════════════════════════════════════════════════════
VWAP Multi-Timeframe Pro - 6 VWAP + Dynamic Levels - Alphaomega18
📝 COMPLETE DESCRIPTION
═══════════════════════════════════════════════════════════════════════════════
🎯 THE MOST COMPLETE VWAP INDICATOR ON THE MARKETPLACE
VWAP Multi-Timeframe Pro simultaneously displays 6 different VWAPs (Asia/London/NY Sessions + Daily/Weekly/Monthly) with key price levels and intelligent dynamic color for complete institutional market vision.
Designed for professional traders: futures, forex, crypto, stocks. Compatible all timeframes.
🔥 WHY THIS INDICATOR IS UNIQUE
Other VWAP indicators display 1 or 2 VWAPs maximum.
**VWAP MTF Pro gives you EVERYTHING in one indicator:**
✅ **6 Simultaneous VWAPs**: Asia, London, NY, Daily, Weekly, Monthly
✅ **3 Key Price Levels**: Previous VWAP, Daily Open, Previous Close
✅ **Dynamic Color**: GREEN line if price above, RED if below
✅ **Standard Deviation Bands**: ±1σ, ±2σ, ±3σ for extreme deviations
✅ **10 Configurable Alerts**: Crossovers and extreme zones
✅ **100% Customizable**: Colors, styles, selective display
One indicator = Complete 24/7 institutional flow vision!
📊 THE 6 DISPLAYED VWAPS
🔷 **1. VWAP ASIA SESSION** (Yellow default)
→ Customizable Asian session (00:00-08:00 default)
→ Visible only during Asia session
→ Identifies key Asian trading levels
🔷 **2. VWAP LONDON SESSION** (Cyan default)
→ European session (08:00-16:00 default)
→ Visible only during London session
→ Captures European institutional flow
🔷 **3. VWAP NY SESSION** (Orange default)
→ American session (15:30-22:00 default)
→ Visible only during NY session
→ Highest volume of the day
🔷 **4. VWAP DAILY** (Blue default)
→ Full day VWAP
→ Most important level for day traders
→ Major support/resistance
🔷 **5. VWAP WEEKLY** (Purple default)
→ Weekly VWAP
→ Medium-term trend
→ Key level for swing traders
🔷 **6. VWAP MONTHLY** (Fuchsia default)
→ Monthly VWAP
→ Long-term vision
→ Major institutional levels
📍 3 ESSENTIAL PRICE LEVELS (NEW)
🔷 **PREVIOUS DAY VWAP CLOSE** (Dashed line - Dynamic color!)
**The Revolutionary Feature:**
→ Displays previous day's VWAP Daily close
→ **GREEN line** when price ABOVE = Bullish signal ✅
→ **RED line** when price BELOW = Bearish signal ❌
→ Changes color in real-time at crossover!
**Why it's powerful:**
```
If you're trading LONG and line is GREEN:
→ You're on right side of market
→ Institutions are with you
→ Hold trade with confidence
If line turns RED:
→ EXIT immediately
→ Momentum has changed
→ Institutions selling now
```
🔷 **DAILY OPEN** (White dotted default)
→ Current day's opening price
→ Major psychological level
→ Intraday support/resistance
🔷 **PREVIOUS DAY CLOSE** (Purple dotted default)
→ Previous day's close
→ Gap analysis (up/down/none)
→ Critical institutional level
📏 STANDARD DEVIATION BANDS
**3 Bands on each side of VWAP:**
→ ±1σ (68% of distribution)
→ ±2σ (95% of distribution)
→ ±3σ (99.7% of distribution)
**VWAP selection for bands:**
Choose from: Asia / London / NY / Daily / Weekly / Monthly
**Usage:**
```
Price reaches +3σ:
→ Extreme overbought
→ Reversal or consolidation likely
→ Take LONG profits or prepare SHORT
Price reaches -3σ:
→ Extreme oversold
→ Reversal or consolidation likely
→ Take SHORT profits or prepare LONG
Price between ±1σ:
→ "Normal" zone
→ Trading range
→ Wait for breakout
```
🎯 REAL USE CASES
📌 **CASE 1: MNQ Day Trading with Dynamic Color**
**Morning Setup:**
```
08:00 - Market opens
→ Price at 16,300
→ Prev Day VWAP Close at 16,250
→ Line = GREEN ✅ (price above)
→ Signal: Bullish sentiment confirmed
Action: Look for LONG setups only
Avoid: SHORT trades against trend
```
**Momentum Change:**
```
10:30 - Price drops rapidly
→ Price drops to 16,240
→ Line turns RED ❗
→ Signal: Momentum changed!
Action: EXIT LONG positions immediately
Look for: SHORT setups now
```
**Result:**
→ You stay on right side of market permanently
→ No fighting institutions
→ Profits maximized, losses minimized
📌 **CASE 2: Gap Analysis with Daily Open + Prev Close**
**Gap UP:**
```
Daily Open (white): 16,320
Prev Day Close (purple): 16,280
Gap = +40 points
Analysis:
→ Bullish gap
→ If VWAP prev line = GREEN = Continuation
→ If price retests Prev Close (purple) and bounces = LONG entry
```
**Gap DOWN:**
```
Daily Open (white): 16,240
Prev Day Close (purple): 16,280
Gap = -40 points
Analysis:
→ Bearish gap
→ If VWAP prev line = RED = Continuation
→ If price rallies to Prev Close (purple) and rejects = SHORT entry
```
📌 **CASE 3: Multi-Timeframe Confirmation**
**LONG Setup Maximum Conviction:**
```
✅ Price > VWAP Monthly (fuchsia) → Long-term bullish trend
✅ Price > VWAP Weekly (purple) → Medium-term bullish trend
✅ Price > VWAP Daily (blue) → Short-term bullish trend
✅ Prev Day VWAP = GREEN → Today's momentum bullish
✅ Price > Daily Open (white) → Positive opening
Signal: ALL timeframes aligned LONG!
Action: LONG entry with strong conviction
Stop: Below VWAP Daily
```
**SHORT Setup Maximum Conviction:**
```
✅ Price < VWAP Monthly (fuchsia) → Long-term bearish trend
✅ Price < VWAP Weekly (purple) → Medium-term bearish trend
✅ Price < VWAP Daily (blue) → Short-term bearish trend
✅ Prev Day VWAP = RED → Today's momentum bearish
✅ Price < Daily Open (white) → Negative opening
Signal: ALL timeframes aligned SHORT!
Action: SHORT entry with strong conviction
Stop: Above VWAP Daily
```
📌 **CASE 4: Session Trading (London/NY Overlap)**
**15:30 - NY Session Opens:**
```
Before 15:30:
→ Price in VWAP London (cyan)
→ Consolidation, range
15:30 - NY opens:
→ VWAP NY (orange) appears
→ Volume explodes
→ Price breaks above VWAP Daily (blue)
→ Prev Day VWAP = GREEN ✅
Action:
→ LONG entry on breakout
→ Stop below VWAP Daily
→ Target +3σ upper band
```
⚙️ COMPLETE CUSTOMIZATION
🎨 **EACH VWAP IS CONFIGURABLE:**
**For each VWAP (6 groups):**
→ Show/Hide (On/Off)
→ Customizable color
→ Line thickness (1-5)
**Asia/London/NY Sessions:**
→ Configurable start/end hours
→ Adapt to your timezone
→ Customize per market
**Forex Example:**
```
Asia: 00:00-08:00 (Tokyo)
London: 08:00-16:00 (London)
NY: 13:00-20:00 (New York)
```
**US Futures Example:**
```
Asia: 18:00-02:00 (overnight)
London: 02:00-08:30
NY: 08:30-15:00 (RTH)
```
🎨 **PREVIOUS DAY VWAP - Dynamic Color:**
→ **Dynamic Color (Green/Red)**: On/Off
• ON = Line changes color (GREEN/RED)
• OFF = Fixed color
→ **Color Above**: Color when price above (default: Green)
→ **Color Below**: Color when price below (default: Red)
→ **Static Color**: If Dynamic Color OFF (default: White)
→ **Line Width**: Thickness (1-5)
→ **Line Style**: Solid / Dashed / Dotted
🎨 **DAILY PRICE LEVELS:**
**Daily Open:**
→ Show/Hide
→ Color (default: White)
→ Thickness
→ Style (Solid/Dashed/Dotted)
**Previous Day Close:**
→ Show/Hide
→ Color (default: Purple/Fuchsia)
→ Thickness
→ Style (Solid/Dashed/Dotted)
📏 **STANDARD DEVIATION BANDS:**
→ **Show Bands**: On/Off
→ **Bands Timeframe**: Choose VWAP (Asia/London/NY/Daily/Weekly/Monthly)
→ **Standard Deviation 1/2/3**: σ values (default: 1.0 / 2.0 / 3.0)
→ **Upper Colors**: Customizable
→ **Lower Colors**: Customizable
👁️ **DISPLAY:**
→ **Show Labels**: Display price labels (On/Off)
→ **Label Size**: Tiny / Small / Normal / Large
🔔 COMPLETE ALERTS (10 ALERTS)
**VWAP Daily Crossovers:**
1. Price > VWAP Daily
2. Price < VWAP Daily
**Extreme Bands:**
3. Price reaches +3σ
4. Price reaches -3σ
**Previous Day VWAP:**
5. Price > Previous Day VWAP
6. Price < Previous Day VWAP
**Daily Open:**
7. Price > Daily Open
8. Price < Daily Open
**Previous Day Close:**
9. Price > Previous Close
10. Price < Previous Close
💡 MARKETS AND TIMEFRAMES
✅ **ALL markets compatible:**
• Futures (ES, NQ, YM, RTY, MNQ, MES, etc.)
• Forex (EUR/USD, GBP/USD, USD/JPY, etc.)
• Crypto (BTC, ETH, altcoins - 24/7)
• Stocks (Tesla, Apple, Nvidia, etc.)
• Indices (S&P 500, Nasdaq, Dow Jones)
• Commodities (Gold, Oil, etc.)
✅ **All timeframes:**
• Scalping: 1min, 5min
• Day Trading: 15min, 30min, 1H ⭐ (optimal!)
• Swing Trading: 4H, Daily
• Position Trading: Weekly
Note: More reliable with real volume data
→ TradingView Premium recommended for tick data
🏆 UNIQUE ADVANTAGES
✅ **6 Simultaneous VWAPs**: Complete multi-timeframe vision
✅ **Dynamic color**: GREEN/RED for instant vision
✅ **3 Price levels**: Prev VWAP + Open + Prev Close
✅ **Standard deviation bands**: ±3σ for extreme zones
✅ **Customizable sessions**: Asia/London/NY adaptable
✅ **10 alerts**: All key crossovers
✅ **100% customizable**: Colors, styles, display
✅ **Automatic labels**: Real-time price display
✅ **Optimized code**: Light, fast, no lag
✅ **No repaint**: Reliable and stable signals
📊 RECOMMENDED CONFIGURATION
**For MNQ/ES Day Trading (15min):**
```
═══ VWAP Sessions ═══
Asia: ✅ ON (Yellow)
London: ✅ ON (Cyan)
NY: ✅ ON (Orange)
═══ VWAP Timeframes ═══
Daily: ✅ ON (Blue)
Weekly: ✅ ON (Purple)
Monthly: ❌ OFF (too long-term)
═══ Previous Day VWAP ═══
Show: ✅ ON
Dynamic Color: ✅ ON (CRITICAL!)
Color Above: Green
Color Below: Red
Width: 2-3
═══ Daily Price Levels ═══
Daily Open: ✅ ON (White dotted)
Prev Day Close: ✅ ON (Purple dotted)
═══ Bands ═══
Show Bands: ✅ ON
Timeframe: Daily
σ: 1.0 / 2.0 / 3.0
═══ Display ═══
Labels: ✅ ON
Size: Small
```
**For Scalping (1-5min):**
```
Sessions: Asia/London/NY by hour
Daily/Weekly: ON
Monthly: OFF
Prev Day VWAP: ON with Dynamic Color
Bands: Daily, ±2σ max
Labels: Small or Tiny
```
**For Swing Trading (4H-Daily):**
```
Sessions: OFF (not relevant)
Daily: ON
Weekly: ON
Monthly: ON
Prev Day VWAP: ON
Bands: Weekly, ±3σ
Labels: Normal or Large
```
🎓 QUICK USAGE GUIDE
**Simple Rules for Day Traders:**
1. **Prev VWAP Line Color = Day Direction**
→ GREEN = Trade LONG only
→ RED = Trade SHORT only
2. **Price above ALL VWAPs = Maximum bullish**
→ Look for LONG setups only
→ No SHORT counter-trend
3. **Price below ALL VWAPs = Maximum bearish**
→ Look for SHORT setups only
→ No LONG counter-trend
4. **Price between VWAPs = Neutral zone**
→ Wait for clear breakout
→ Range-bound, careful scalp
5. **±3σ bands = Extreme zones**
→ Take profits
→ Or wait for reversal
💪 TRADER PSYCHOLOGY
**What this indicator solves:**
❌ "I don't know if trend continues"
→ Check prev VWAP line color: GREEN = continues
❌ "I take profits too early from fear"
→ As long as line GREEN, hold LONG with confidence
❌ "I hold my losses too long"
→ Line turns RED? EXIT immediately!
❌ "I trade counter-trend"
→ 6 VWAPs visible = Impossible to mistake direction
❌ "I don't know where to put stop"
→ Stop below VWAP Daily for LONG, above for SHORT
**Result:**
✅ Increased confidence
✅ Reinforced discipline
✅ Maximized profits
✅ Trading with institutions
🔗 PERFECT COMPLEMENT
**Combine VWAP MTF Pro with:**
• **Order Flow Signals** → Institutional absorptions (💎▲🚀)
• **Order Flow CVD** → Real-time order flow
• **Fair Value Gaps** → Inefficiency zones
• **Market Profile** → POC/VPOC
**VWAP MTF Pro** = Institutional price levels
**Order Flow** = Flow confirmation
→ Complete trading system!
⚠️ DISCLAIMER
Technical indicators are decision support tools. No indicator guarantees profits. Always use:
• Appropriate risk management
• Stop loss on every trade
• Proper position sizing
• Demo account testing first
VWAP MTF Pro improves your analysis but doesn't replace a complete strategy with money management.
🚀 INSTALLATION
1. Copy the Pine Script code
2. Open Pine Editor in TradingView
3. Paste the code
4. Click "Add to Chart"
5. Indicator displays on chart (overlay)
6. Configure parameters to your preferences
7. Activate desired alerts
8. Trade with complete institutional vision!
💡 PRO TIP
**The Golden VWAP Rule:**
"NEVER trade against ALL aligned VWAPs"
If Monthly + Weekly + Daily ALL point down:
→ Bearish market on ALL timeframes
→ Trade SHORT only
→ No LONG = Suicide
If Monthly + Weekly + Daily ALL point up:
→ Bullish market on ALL timeframes
→ Trade LONG only
→ No SHORT = Lost money
This simple rule can **save your account**!
📞 CONTACT AND SUPPORT
Created by Alphaomega18
For questions, bugs or suggestions:
Find my other indicators:
• Order Flow Signals (institutional signals)
• Order Flow Dashboard (CVD oscillator)
• Order Flow CVD Simple (trend vision)
• Fair Value Gap Detector
• Volume & Volatility Crisis Detector

Wyckoff PRO Institutional🔹 Wyckoff NTA – Institutional Context Engine
Institutional Market Context Based on Wyckoff Methodology
📌 Overview
Wyckoff NTA – Institutional Context Engine is a public, closed-source analytical script developed by NexTrade Academy, designed to identify and quantify the true institutional market context using classic Wyckoff methodology adapted into a modern algorithmic framework.
This script is NOT a signal system and does not provide precise entry or exit points.
Its purpose is to function as a context engine, helping traders understand WHEN the market is operable and IN WHICH DIRECTION it is statistically reasonable to look for opportunities.
🧠 Methodology & Conceptual Framework
Wyckoff NTA evaluates the combined behavior of price, volume, and volatility, following the core principles of the Wyckoff method to interpret institutional intent behind market movements.
The script analyzes market conditions through the following conceptual components:
1️⃣ Wyckoff Phase Identification
The indicator classifies the current market environment into the main institutional Wyckoff phases:
Accumulation
Distribution
Markup
Markdown
Reaccumulation
Redistribution
These phases describe where the market is within its cycle, not where to trade.
2️⃣ Institutional Intent Event Detection
Wyckoff NTA detects key events associated with Wyckoff methodology, such as:
Spring
Upthrust
Sign of Strength (SOS)
Sign of Weakness (SOW)
These events are treated as contextual confirmations, not standalone trade signals.
3️⃣ Market Operability Assessment
The script evaluates whether current conditions are operable or non-operable, based on the relationship between:
Structural development
Participation (volume behavior)
Price efficiency and volatility
This process filters out:
Low-intent environments
Transitional phases
Low-probability market conditions
🔢 Wyckoff Dynamic Score (0–100)
All evaluated components are aggregated into a Wyckoff Dynamic Score, which summarizes the quality of the current market context:
Below 40 → Non-operable context
40 to 60 → Weak context (A+ setups only)
60 to 80 → Operable context
Above 80 → Strong institutional context
This score does not trigger trades.
It is designed to enable or block decisions within a defined trading plan.
🎨 Visualization Modes
Wyckoff NTA includes multiple visualization modes to support different use cases:
DESK → Professional execution (minimal, no visual noise)
PRO → Active trading with enhanced visual context
EDU → Educational and learning-focused analysis
Each mode prioritizes clarity, objectivity, and controlled information density.
🎯 Intended Use
This script is designed for:
Institutional and advanced discretionary traders
Market Structure and Smart Money approaches
Swing and intraday trading
Contextual trade filtering and bias validation
Integration with execution systems such as NTC (NexTrade Concept)
It should always be used alongside:
A defined execution model
Proper risk management
Trading discipline
⚠️ Important Disclaimer
❌ No performance guarantees
❌ Not an automated trading system
❌ Does not constitute investment advice
✅ Contextual analytical tool only
All trading decisions remain the sole responsibility of the user.
🏷️ Credits
Developed by NexTrade Academy
Institutional Trading · Market Structure · Context First
Educational and professional analytical tool
Use at your own risk

Order Flow Pro - CVD - Alphaomega18═══════════════════════════════════════════════════════════════════════════════
ORDER FLOW CVD SIMPLE - TRADINGVIEW PUBLICATION
Created by Alphaomega18
═══════════════════════════════════════════════════════════════════════════════
📝 COMPLETE DESCRIPTION
═══════════════════════════════════════════════════════════════════════════════
🎯 FOLLOW INSTITUTIONAL TREND AT A GLANCE
Order Flow CVD is an ultra-simple and ultra-effective indicator that displays CVD (Cumulative Volume Delta) with a colored fill zone to instantly identify order flow trend.
No complexity, no clutter: just 2 lines and 1 colored zone to know if you should HOLD or EXIT your trade.
🔥 THE GOLDEN RULE OF TRADING
The secret of professional traders:
→ "Let your winners run, cut your losses"
But how do you know WHEN to hold and WHEN to exit?
**The answer: CVD (Cumulative Volume Delta)**
As long as institutional flow goes your way, HOLD the trade.
As soon as flow changes, EXIT.
This is exactly what this indicator does: it shows you the flow in real-time with ultra-clear visualization.
📊 HOW IT WORKS
🔷 **2 SIMPLE LINES**
**WHITE Line** = CVD (Cumulative Volume Delta)
→ Cumulative sum of volume delta
→ Rises when buying > selling
→ Falls when selling > buying
**YELLOW Line** = CVD Moving Average (20 periods default)
→ Smooths CVD to see trend
→ Filters noise
→ Reference for trend
🔷 **COLORED FILL ZONE**
🟢 **GREEN ZONE** = White CVD ABOVE yellow CVD
→ BULLISH trend
→ Institutions are BUYING
→ HOLD your LONG trades
→ Avoid SHORT
🔴 **RED ZONE** = White CVD BELOW yellow CVD
→ BEARISH trend
→ Institutions are SELLING
→ HOLD your SHORT trades
→ Avoid LONG
⚡ **CROSSOVER** = Zone changes color
→ Trend change
→ Exit or reverse position
→ Clear and sharp signal
🎯 USAGE RULES
📌 **RULE #1: HOLD A LONG TRADE**
You're in a LONG:
→ ✅ As long as ZONE IS GREEN → HOLD
→ ❌ As soon as ZONE TURNS RED → EXIT
Real example:
```
LONG entry: 16,500
Zone stays green for 2 hours
Price climbs to 16,650 (+150 points)
Zone turns red → EXIT
You pocket +150 points instead of giving back 50 points!
```
📌 **RULE #2: HOLD A SHORT TRADE**
You're in a SHORT:
→ ✅ As long as ZONE IS RED → HOLD
→ ❌ As soon as ZONE TURNS GREEN → EXIT
Real example:
```
SHORT entry: 16,500
Zone stays red for 1 hour
Price drops to 16,350 (-150 points)
Zone turns green → EXIT
You pocket +150 points!
```
📌 **RULE #3: DON'T ENTER COUNTER-TREND**
Green zone visible:
→ ❌ Do NOT enter SHORT
→ ✅ Look for LONG setups only
Red zone visible:
→ ❌ Do NOT enter LONG
→ ✅ Look for SHORT setups only
📌 **RULE #4: CROSSOVERS = CHANGE**
White CVD crosses yellow CVD:
→ Zone changes color
→ Institutional flow reverses
→ Exit or reverse position
💡 REAL USE CASES
📊 **CASE 1: MNQ Scalping 5min**
Setup:
→ Price breaks resistance
→ CVD zone is GREEN
→ You enter LONG
Management:
→ Price rises, pulls back, rises again
→ Zone STAYS GREEN → You hold
→ +30 points, +40 points, +50 points...
→ Zone turns RED → You exit at +52 points
Without CVD:
→ You would have exited at +15 points out of fear
→ You lose 37 points of gain!
📊 **CASE 2: ES Day Trading 15min**
Setup:
→ Price in range
→ CVD zone RED for 1 hour
→ Price touches top of range
→ You enter SHORT
Management:
→ Zone STAYS RED during decline
→ Price makes -20 points, -30 points, -40 points
→ Zone turns GREEN → You exit at +42 points
Without CVD:
→ You would have exited at +20 points (fear)
→ Or held too long and gave back gains
📊 **CASE 3: Avoid Losing Trade**
Perfect technical setup:
→ Triangle breakout
→ Supportive VWAP
→ FVG below
BUT... CVD zone is RED!
Decision:
→ You DON'T ENTER LONG
→ Price rises 10 points then collapses -30 points
→ Losing trade avoided thanks to CVD!
⚙️ CUSTOMIZABLE PARAMETERS
🔧 **CVD Moving Average Length** (default: 20)
→ Yellow moving average length
→ Shorter (10-15) = More reactive, more signals
→ Longer (30-50) = Smoother, fewer false signals
Recommendations by style:
• Scalping (1-5min): 10-15
• Day Trading (15min-1H): 20 (default)
• Swing Trading (4H-Daily): 30-50
🎨 **Show Fill Between CVD and MA** (On/Off)
→ Show/hide colored zone
→ OFF = Just 2 lines
→ ON = Lines + green/red zone
🎨 **Bullish Fill Color** (Customizable)
→ Bullish zone color
→ Default: Transparent green (80%)
→ Change to blue, cyan, or other
🎨 **Bearish Fill Color** (Customizable)
→ Bearish zone color
→ Default: Transparent red (80%)
→ Change to orange, pink, or other
💡 **Transparency Tip:**
→ 90% transparent = Very subtle
→ 80% transparent = Balanced (recommended)
→ 60% transparent = Well visible
→ 40% transparent = Very visible
📊 RECOMMENDED CONFIGURATIONS
**Scalping (1-5min) - Reactive**
```
CVD MA Length: 10
Show Fill: ✅ ON
Bullish Color: Green 70% transparent
Bearish Color: Red 70% transparent
```
**Day Trading (15min-1H) - Balanced** ⭐
```
CVD MA Length: 20
Show Fill: ✅ ON
Bullish Color: Green 80% transparent
Bearish Color: Red 80% transparent
```
**Swing Trading (4H-Daily) - Smooth**
```
CVD MA Length: 30
Show Fill: ✅ ON
Bullish Color: Green 85% transparent
Bearish Color: Red 85% transparent
```
**Minimalist - Lines only**
```
CVD MA Length: 20
Show Fill: ❌ OFF
(Just white and yellow, no zone)
```
💡 MARKETS AND TIMEFRAMES
✅ **ALL markets compatible:**
• Futures (ES, NQ, YM, RTY, MNQ, MES, etc.)
• Forex (EUR/USD, GBP/USD, USD/JPY, etc.)
• Crypto (BTC, ETH, altcoins)
• Stocks (Tesla, Apple, Nvidia, etc.)
• Indices (S&P 500, Nasdaq, Dow Jones)
✅ **All timeframes:**
• Scalping: 1min, 5min
• Day Trading: 15min, 30min, 1H ⭐ (optimal!)
• Swing Trading: 4H, Daily
Note: More reliable with real volume data
→ TradingView Premium recommended
🏆 UNIQUE ADVANTAGES
✅ **Ultimate simplicity**: 2 lines, 1 zone, 1 rule
✅ **Instant vision**: Green = hold LONG, Red = hold SHORT
✅ **Hold trades longer**: Maximize your gains
✅ **Avoid counter-trend**: Don't trade against flow
✅ **Customizable**: Colors and transparency of choice
✅ **Ultra-light**: Optimized code, no lag
✅ **No repaint**: Reliable signals
✅ **Works everywhere**: All markets, all TF
🎓 QUICK INTERPRETATION
**When zone is GREEN:**
→ Institutions buying
→ Bullish momentum
→ Hold LONG, avoid SHORT
→ Look for buy setups
**When zone is RED:**
→ Institutions selling
→ Bearish momentum
→ Hold SHORT, avoid LONG
→ Look for sell setups
**When zone CHANGES color:**
→ Institutional flow reverses
→ Trend changes
→ EXIT position
→ Or reverse if new setup
**White line volatile:**
→ White CVD zigzags a lot
→ Market indecisive or range
→ Wait for clear zone before trade
💪 TRADER PSYCHOLOGY
What THIS indicator solves:
❌ "I'm afraid, I exit too early" → Green/red zone says WHEN to exit
❌ "I hold my losses too long" → Zone changes = EXIT
❌ "I trade counter-trend" → Zone tells which direction to trade
❌ "I don't know if trend continues" → Green/red zone = answer
Result:
✅ You hold your gains longer
✅ You exit at right time
✅ You avoid counter-trend trades
✅ You trade with institutions
🔗 PERFECT COMPLEMENT
Use with:
• **Order Flow Signals** → Precise signals (💎▲🚀)
• **VWAP** → Institutional price levels
• **Fair Value Gaps** → Inefficiency zones
• **Market Profile** → POC/VPOC
**CVD Simple** tells you WHEN to hold/exit
**Technical analysis** tells you WHERE to enter
⚠️ DISCLAIMER
Technical indicators are decision support tools. No indicator guarantees profits. Always use:
• Appropriate risk management
• Stop loss on every trade
• Proper position sizing
• Demo account testing first
Order Flow CVD improves your trade management but doesn't replace a complete strategy.
🚀 INSTALLATION
1. Copy the Pine Script code
2. Open Pine Editor in TradingView
3. Paste the code
4. Click "Add to Chart"
5. Indicator displays in separate pane (below)
6. Configure colors to your preferences
7. Apply golden rule: Green = LONG, Red = SHORT!
💡 PRO TIP
**CVD Discipline:**
Create this mental rule:
→ "I NEVER exit a position until zone changes color"
This simple discipline will:
✅ Multiply your gains (you hold longer)
✅ Reduce your losses (you exit when flow changes)
✅ Eliminate emotional exits
✅ Align you with institutions
📞 CONTACT AND SUPPORT
Created by Alphaomega18
For questions, bugs or suggestions:
Find my other indicators:
• Order Flow Signals (precise signals on chart)
• Order Flow Dashboard (CVD oscillator + pressures)
• VWAP Multi-Timeframe Pro
• Fair Value Gap Detector

Order Flow Signals - Alphaomega18═══════════════════════════════════════════════════════════════════════════════
ORDER FLOW SIGNALS - TRADINGVIEW PUBLICATION (ENGLISH)
Created by Alphaomega18
═══════════════════════════════════════════════════════════════════════════════
📌 PUBLICATION TITLE
═══════════════════════════════════════════════════════════════════════════════
Order Flow Signals - Absorptions & CVD Divergences - Alphaomega18
📝 COMPLETE DESCRIPTION
═══════════════════════════════════════════════════════════════════════════════
🎯 DETECT INSTITUTIONAL MOVES IN REAL-TIME
Order Flow Signals is an advanced order flow analysis indicator that displays institutional absorption signals, hidden CVD divergences, and extreme buy/sell pressure directly on your chart.
Fully customizable with 9 configurable colors, adjustable label sizes, and extreme absorption detection (300%+), this indicator allows you to trade WITH institutions, not against them.
🔥 THE PROBLEM IT SOLVES
Have you ever:
✗ Taken a technically perfect setup but got stopped out?
✗ Seen price reject a support/resistance but go the other way?
✗ Entered counter-trend without knowing institutions were accumulating?
✗ Missed big moves due to lack of confirmation?
Order Flow Signals solves these problems by revealing what smart money is REALLY doing behind each candle.
📊 SIGNALS DISPLAYED ON CHART
🔷 ABSORPTIONS (💎 Diamonds)
Institutions absorb order flow when volume is high BUT price doesn't move in the expected direction.
💎 BULLISH ABSORPTION (Cyan)
→ Volume spike + bearish candle + positive delta
→ Institutions are BUYING despite selling pressure
→ Strong accumulation signal
💎 BEARISH ABSORPTION (Orange)
→ Volume spike + bullish candle + negative delta
→ Institutions are SELLING despite buying pressure
→ Strong distribution signal
🔥 EXTREME ABSORPTIONS (Fuchsia Fire)
→ Volume > 300% of average (customizable)
→ MASSIVE institutional activity
→ Ultra-rare and ultra-strong signals
→ Indicates major moves in preparation
🔺 DIVERGENCES (▲ Green Triangles)
Price makes lower lows BUT CVD makes higher lows
→ Hidden accumulation in progress
→ Bullish reversal signal likely
→ Confirms your BUY entries
🔻 DIVERGENCES (▼ Red Triangles)
Price makes higher highs BUT CVD makes lower highs
→ Hidden distribution in progress
→ Bearish reversal signal likely
→ Confirms your SELL entries
🚀 EXTREME BUY PRESSURE (Rockets)
Delta > 2x average
→ Massive aggressive buying
→ Strong bullish momentum
→ Continuation likely
💥 EXTREME SELL PRESSURE (Explosions)
Delta < -2x average
→ Massive aggressive selling
→ Strong bearish momentum
→ Capitulation or panic
📈 DELTA PER CANDLE DISPLAY (NEW)
Option to display numerical delta on each candle:
• ✅ GREEN when delta positive (+250, +180, etc.)
• ❌ RED when delta negative (-320, -150, etc.)
• Tiny size to avoid clutter
• Perfect for tracking flow in real-time
🎯 REAL USE CASES
📌 Example 1: Avoid the Classic Trap
Technical setup:
→ Price rejects VWAP Weekly (resistance)
→ FVG below attracting
→ Single Prints above
→ You think: "Perfect SELL setup!"
WITHOUT Order Flow Signals:
❌ You enter SELL
❌ Price goes up and stops you out
❌ Frustration and loss
WITH Order Flow Signals:
✅ You see 💎 CYAN DIAMOND (Bullish absorption)
✅ Institutions are BUYING despite rejection
✅ You DON'T ENTER SELL
✅ Trade saved, loss avoided!
📌 Example 2: Confirm a Breakout
Setup:
→ Price breaks major resistance
→ But is it a real breakout or fakeout?
Check Order Flow Signals:
→ 🚀 ROCKET appears (extreme buy pressure)
→ 💎 CYAN DIAMOND (bullish absorption)
→ Massive positive delta visible
Clear signal: It's a REAL breakout!
→ Enter BUY with confidence
→ Institutions pushing price
📌 Example 3: Detect Hidden Accumulation
Situation:
→ Price consolidating in range
→ Apparently neutral
→ No clear technical signal
Order Flow Signals reveals:
→ ▲ GREEN TRIANGLE (bullish divergence)
→ Price flat BUT CVD rising progressively
→ Institutional accumulation in progress
Action: Prepare LONG position
→ When price breaks, it will be violent!
⚙️ COMPLETE CUSTOMIZATION
🎨 COLORS (9 configurable colors)
• Bullish Absorption (default: cyan)
• Bearish Absorption (default: orange)
• EXTREME Absorption (default: fuchsia)
• Bullish Divergence (default: green)
• Bearish Divergence (default: red)
• Buy Pressure (default: lime)
• Sell Pressure (default: fuchsia)
• Positive Delta (default: green)
• Negative Delta (default: red)
Adapt the indicator to your chart style!
📏 LABEL SIZES
5 sizes available: Tiny / Small / Normal / Large / Huge
→ Perfect for all screen types
→ Large 4K screen? → Large or Huge
→ Small laptop? → Small or Normal
🔍 CUSTOMIZABLE DETECTION
• Normal Absorption Threshold: 1.5x (default)
• EXTREME Absorption Threshold: 3.0x (default)
• Divergence Periods: 14 (default)
• All thresholds adjustable to your style
👁️ ON/OFF DISPLAY
• Absorptions 💎 (On/Off)
• Divergences ▲▼ (On/Off)
• Extreme Pressure 🚀💥 (On/Off)
• Delta per Candle (On/Off)
Display only what you need!
🔔 COMPLETE ALERT SYSTEM
8 independently configurable alert types:
1. 🔵 Bullish Absorption
2. 🔴 Bearish Absorption
3. 🔥🔵 EXTREME Bullish Absorption
4. 🔥🔴 EXTREME Bearish Absorption
5. 📈 Bullish Divergence
6. 📉 Bearish Divergence
7. 🚀 Extreme Buy Pressure
8. 💥 Extreme Sell Pressure
Receive push, email or SMS notifications when institutions act!
💡 MARKETS AND TIMEFRAMES
✅ ALL markets compatible:
• Futures (ES, NQ, YM, RTY, MNQ, MES, etc.)
• Forex (EUR/USD, GBP/USD, USD/JPY, etc.)
• Crypto (BTC, ETH, altcoins)
• Stocks (Tesla, Apple, Nvidia, etc.)
• Indices (S&P 500, Nasdaq, Dow Jones)
• Commodities (Gold, Oil, etc.)
✅ All timeframes:
• Scalping: 1min, 5min
• Day Trading: 15min, 30min, 1H ⭐ (optimal!)
• Swing Trading: 4H, Daily
Note: More reliable signals with real volume data
→ TradingView Premium recommended for tick data
🏆 UNIQUE ADVANTAGES
✅ Automatic institutional absorption detection
✅ EXTREME absorptions (300%+) for ultra-strong signals
✅ Integrated CVD (Cumulative Volume Delta)
✅ Optional per-candle delta display (green/red)
✅ 9 customizable colors - adapt to your style
✅ 5 label sizes - perfect for all screens
✅ Clear visual signals directly on chart
✅ Detailed tooltips on each signal
✅ 8 independent configurable alerts
✅ Clean, optimized code, no repaint
✅ Compatible all markets and timeframes
📊 RECOMMENDED CONFIGURATION
For MNQ / ES / NQ (15min):
```
Detection:
├─ Normal Absorption Threshold: 1.5x
└─ EXTREME Absorption Threshold: 3.0x
Display:
├─ Absorptions: ✅ ON
├─ Divergences: ✅ ON
├─ Extreme Pressure: ✅ ON
└─ Delta per Candle: ❌ OFF (or ON if preferred)
Customization:
└─ Label Size: Normal (or Large for big screen)
Colors:
└─ Default (or customize!)
Alerts:
└─ All ✅ ON
```
For Scalping (1-5min):
```
└─ Label Size: Small
└─ Delta per Candle: ✅ ON (useful in scalping)
└─ Absorption Threshold: 2.0x (stricter)
```
🎓 SUPPORT AND TOOLTIPS
Each signal includes detailed tooltip on hover:
• Exact volume and multiplier (e.g. 2.3x)
• Precise delta
• Signal explanation
• Suggested action
Hover over 💎▲🚀 to understand each signal!
🔗 PERFECT COMPLEMENT
This indicator works perfectly with:
• Order Flow Dashboard (to see CVD and pressures)
• VWAP Multi-Timeframe
• Fair Value Gaps (FVG)
• Market Profile (POC/VPOC)
• Support/Resistance
Combine Order Flow signals with your technical analysis!
⚠️ DISCLAIMER
Technical indicators are decision support tools. No indicator guarantees profits. Always use:
• Appropriate risk management
• Stop loss on every trade
• Proper position sizing
• Demo account testing first
Order Flow Signals improves your analysis but doesn't replace a complete strategy.
📞 CONTACT AND SUPPORT
Created by Alphaomega18
For questions, bugs or suggestions:
Find my other indicators:
• Order Flow Dashboard (CVD and pressures)
• VWAP Multi-Timeframe Pro
• Fair Value Gap Detector
• Volume & Volatility Crisis Detector

CVD Oscillator - Alphaomega18ORDER FLOW DASHBOARD OSCILLATOR - TRADINGVIEW PUBLICATION (ENGLISH)
Created by Alphaomega18
═══════════════════════════════════════════════════════════════════════════════
📌 PUBLICATION TITLE
═══════════════════════════════════════════════════════════════════════════════
Order Flow Dashboard - CVD Oscillator & Pressures - Alphaomega18
📝 COMPLETE DESCRIPTION
═══════════════════════════════════════════════════════════════════════════════
🎯 TRACK INSTITUTIONAL FLOW IN REAL-TIME
Order Flow Dashboard Oscillator is an advanced indicator that displays CVD (Cumulative Volume Delta) as a percentage oscillator, combined with real-time buy/sell pressures.
Unlike traditional CVD indicators where raw CVD reaches millions and crushes other data, this oscillator displays CVD deviation from its average in %, allowing clear reading on the SAME scale as pressures.
🔥 THE PROBLEM SOLVED
Classic CVD indicator problem:
✗ Raw CVD climbs to 1,000,000+ → Unreadable
✗ Pressures stay small (0-500) → Invisible
✗ Impossible to see both simultaneously
✗ Cluttered and confusing chart
Solution with CVD Oscillator:
✅ CVD displayed as % deviation (oscillates around 0)
✅ Pressures normalized on same scale
✅ EVERYTHING visible simultaneously
✅ Clear and intuitive reading
📊 INDICATOR COMPONENTS
🔷 CVD OSCILLATOR (Thick white line)
Traditional CVD accumulates infinitely:
→ Raw CVD = 50,000 ... 100,000 ... 500,000 ... 1,000,000+
→ Hard to interpret
CVD Oscillator shows DEVIATION:
→ CVD Oscillator = +5% ... +12% ... -3% ... -8%
→ Easy to interpret!
**How it works:**
• Calculates distance between CVD and its moving average (20 periods default)
• Converts to percentage
• Oscillates around 0 (gray center line)
**Interpretation:**
• **Above 0** → CVD > Average = BULLISH trend
• **Below 0** → CVD < Average = BEARISH trend
• **+10% zone** (green dotted line) → Buyer strength
• **-10% zone** (red dotted line) → Seller strength
🔷 BUY/SELL PRESSURES (Green/Red zones)
**Buy Pressure (Green zone)**
→ Calculated on bullish candles
→ Proportional to candle size
→ Normalized for optimal visibility
**Sell Pressure (Red zone)**
→ Calculated on bearish candles
→ Proportional to candle size
→ Normalized for optimal visibility
**Extreme Pressures** (Background)
→ 🟢 Light green background = EXTREME buy pressure (delta > 2x average)
→ 🔴 Light red background = EXTREME sell pressure (delta < -2x average)
🔷 REAL-TIME DASHBOARD (Top right corner)
Displays 6 key metrics:
1. **CVD Osc**: Oscillator value in %
2. **CVD Raw**: Raw CVD value (reference)
3. **Trend**: 🟢 Bullish or 🔴 Bearish
4. **Delta**: Current candle delta
5. **Volume**: HIGH (spike) or Normal
6. **Pressure**: 🚀 BUY / 💥 SELL / Neutral
🎯 HOW TO USE IT
📌 CASE 1: HOLD TRADES LONGER
**Classic problem:**
→ You're in a LONG
→ Price pulls back slightly, you panic
→ You exit... then price resumes up
→ Frustration: "I was right but exited too early!"
**Solution with CVD Oscillator:**
Example LONG trade:
1. You enter LONG on breakout
2. You watch CVD Oscillator
3. **As long as it stays ABOVE 0** → Keep the trade
4. Institutions continue accumulating
5. Trend remains intact
Exit:
→ CVD Oscillator **crosses below 0**
→ Signal: Institutions now selling
→ You exit or take profits
**Result:**
✅ You maximize your gains
✅ You exit at right time (when flow changes)
✅ You don't panic on small corrections
📌 CASE 2: CONFIRM TREND STRENGTH
**Setup:**
→ Price in uptrend
→ But is it real trend or just noise?
**Check CVD Oscillator:**
STRONG trend:
→ CVD Oscillator **stays positive** (+5%, +8%, +12%)
→ Dominant buy pressures (green zones)
→ Few or no red backgrounds
WEAK trend:
→ CVD Oscillator **oscillates around 0** (+2%, -1%, +3%)
→ Mixed pressures (green and red alternate)
→ Lack of conviction
**Action:**
✅ Strong trend → Trade with confidence
⚠️ Weak trend → Be cautious or avoid
📌 CASE 3: DETECT TREND CHANGE
**CVD Oscillator Divergence:**
Price makes higher highs BUT:
→ CVD Oscillator makes lower highs
→ +15% ... +12% ... +8% (progressive decline)
→ Sell pressures increasing
Signal: Distribution in progress
→ Institutions selling into rally
→ Reversal likely
→ Prepare SHORT or exit LONG
📌 CASE 4: OPTIMAL ENTRY TIMING
**Situation:**
→ Price consolidating
→ You wait for signal to enter
**LONG entry signal:**
→ CVD Oscillator **crosses above 0**
→ Green background (extreme buy pressure) appears
→ Dashboard: 🚀 BUY
Action: Enter LONG immediately
**SHORT entry signal:**
→ CVD Oscillator **crosses below 0**
→ Red background (extreme sell pressure) appears
→ Dashboard: 💥 SELL
Action: Enter SHORT immediately
⚙️ CUSTOMIZABLE PARAMETERS
🔧 **CVD Moving Average Length** (default: 20)
→ Moving average period for oscillator
→ Shorter (10-15) = More reactive, more signals
→ Longer (30-50) = Smoother, fewer false signals
👁️ **Show CVD Oscillator** (On/Off)
→ Show/hide CVD Oscillator line
👁️ **Show Buy/Sell Pressure** (On/Off)
→ Show/hide pressure zones
👁️ **Show Info Dashboard** (On/Off)
→ Show/hide information table
📊 RECOMMENDED CONFIGURATIONS
**For Day Trading (15min-1H):**
```
CVD MA Length: 20
Show CVD Oscillator: ✅ ON
Show Buy/Sell Pressure: ✅ ON
Show Info Dashboard: ✅ ON
```
**For Scalping (1-5min):**
```
CVD MA Length: 10 (more reactive)
Show CVD Oscillator: ✅ ON
Show Buy/Sell Pressure: ✅ ON
Show Info Dashboard: ✅ ON
```
**For Swing Trading (4H-Daily):**
```
CVD MA Length: 30 (smoother)
Show CVD Oscillator: ✅ ON
Show Buy/Sell Pressure: ✅ ON
Show Info Dashboard: ✅ ON
```
💡 MARKETS AND TIMEFRAMES
✅ **ALL markets compatible:**
• Futures (ES, NQ, YM, RTY, MNQ, MES, etc.)
• Forex (EUR/USD, GBP/USD, USD/JPY, etc.)
• Crypto (BTC, ETH, altcoins)
• Stocks (Tesla, Apple, Nvidia, etc.)
• Indices (S&P 500, Nasdaq, Dow Jones)
✅ **All timeframes:**
• Scalping: 1min, 5min
• Day Trading: 15min, 30min, 1H ⭐ (optimal!)
• Swing Trading: 4H, Daily
Note: More reliable with real volume data
→ TradingView Premium recommended
🏆 UNIQUE ADVANTAGES
✅ **CVD Oscillator**: % deviation instead of raw value
✅ **Same scale**: CVD and pressures visible together
✅ **Intuitive reading**: Above/below 0
✅ **Normalized pressures**: Always visible
✅ **Real-time dashboard**: 6 key metrics
✅ **Strength zones**: +10% and -10% marked
✅ **Background alerts**: Visual extreme pressures
✅ **Optimized code**: Light and fast
✅ **No repaint**: Reliable signals
🔗 PERFECT COMPLEMENT
Use with **Order Flow Signals** for complete system:
• **Order Flow Signals** (overlay=true) → Signals on chart
→ 💎 Absorptions, ▲ Divergences, 🚀 Pressures
• **Order Flow Dashboard** (overlay=false) → CVD and metrics
→ CVD Oscillator, Pressures, Live dashboard
**Complete system = 360° order flow vision!**
🎓 QUICK INTERPRETATION
**CVD Oscillator:**
• +5% to +10% = Moderate bullish
• +10% and above = STRONG bullish
• -5% to -10% = Moderate bearish
• -10% and below = STRONG bearish
• Near 0 = Neutral / Consolidation
**Pressures:**
• Large green zones = Dominant buying
• Large red zones = Dominant selling
• Balanced = Indecision
**Dashboard:**
• 🟢 Bullish + 🚀 BUY = Strong LONG signal
• 🔴 Bearish + 💥 SELL = Strong SHORT signal
• Massive positive delta = Bullish momentum
• Massive negative delta = Bearish momentum
⚠️ DISCLAIMER
Technical indicators are decision support tools. No indicator guarantees profits. Always use:
• Appropriate risk management
• Stop loss on every trade
• Proper position sizing
• Demo account testing first
Order Flow Dashboard improves your analysis but doesn't replace a complete strategy.
🚀 INSTALLATION
1. Copy the Pine Script code
2. Open Pine Editor in TradingView
3. Paste the code
4. Click "Add to Chart"
5. Indicator displays in separate pane (below)
6. Configure parameters to your preferences
7. Combine with Order Flow Signals for complete system!
💡 USAGE TIPS
**Golden Rule for Holding Trades:**
→ LONG: Keep as long as CVD Osc > 0
→ SHORT: Keep as long as CVD Osc < 0
**Strength Signals:**
→ CVD Osc > +10% = Very bullish
→ CVD Osc < -10% = Very bearish
**Trend Change:**
→ CVD Osc crosses 0 = Potential change
→ + Extreme background = Strong confirmation
📞 CONTACT AND SUPPORT
Created by Alphaomega18
For questions, bugs or suggestions:
Find my other indicators:
• Order Flow Signals (signals on chart)
• VWAP Multi-Timeframe Pro
• Fair Value Gap Detector
• Volume & Volatility Crisis Detector

MarketMind PROM🜁rketMind PRO ────────────────────
Descriptive Market Context & Risk Awareness
M🜁rketMind PRO is a professional-grade market context system designed to help traders maintain situational clarity and explicit risk awareness — without signals, confidence scoring, or forward-looking interpretation.
Rather than telling traders what to trade or how confident to be, M🜁rketMind PRO focuses on describing what is happening in the market and where caution may be warranted.
This script is designed as a standalone descriptive tool. It does not provide execution guidance, trade signals, or predictive insight.
WHAT IT DOES ────────────────────
M🜁rketMind PRO evaluates current market conditions across multiple dimensions — including session context, regime state, momentum direction, volatility, liquidity, and structural behavior — and presents them in a clean, human-readable HUD.
The system emphasizes description over interpretation.
It highlights conditions that may elevate or reduce risk without assessing alignment strength, assigning confidence, or projecting outcomes.
The script provides visibility into:
Market context and session awareness
Basic regime states and transitions
Momentum direction (up, down, neutral)
Volatility, liquidity, and structural caution conditions
Environmental factors that may influence risk
The goal is to make risk visible — without telling traders what to do with it.
HOW TO USE IT ────────────────────
M🜁rketMind PRO is not a signal generator.
It is designed to be used alongside discretionary price action, rule-based entries, or systematic strategies, helping traders stay aware of context and potential risk while executing their own process.
Common questions it can help inform include:
What type of market environment is currently present?
Is momentum developing, stalling, or absent?
Are volatility or liquidity conditions elevated?
Does the environment appear clean or structurally fragile?
M🜁rketMind PRO describes conditions as they are.
Interpretation and decision-making remain entirely with the trader.
DESIGN PHILOSOPHY ────────────────────
M🜁rketMind PRO is intentionally descriptive.
It includes context and caution layers without interpretive or evaluative frameworks:
Market context, momentum, and risk visibility
Volatility, liquidity, and structural awareness
Session awareness without gating or execution logic
A single, consistent HUD perspective
No confidence scoring or conviction grading
No predictive or forward-looking language
Nothing is implied.
Nothing is projected.
This script shows what is happening and where risk may exist — nothing more.
WHO IT IS FOR ────────────────────
M🜁rketMind PRO is suited for traders who:
Prefer structured context over signals
Manage their own execution and risk decisions
Value awareness of environmental and structural conditions
Want clarity without interpretive bias
It is not designed for:
Buy or sell alerts
Execution guidance
Predictive or outcome-based analysis
IMPORTANT NOTES ────────────────────
M🜁rketMind PRO does not provide financial advice
No system can predict future price behavior
This tool is designed to inform awareness, not decisions
Used appropriately, M🜁rketMind PRO supports disciplined, context-aware trading

Price Contraction / Expansion1. Introduction
The Price Contraction / Expansion indicator highlights areas of market compression and volatility release by analyzing candle body size and volume behavior. It provides a fast, color-coded visualization to identify potential breakout zones, accumulation phases, or exhaustion movements.
This tool helps traders recognize when price action is tightening before a volatility expansion — a common precursor to strong directional moves.
2. Key Features
Dynamic body analysis: Compares each candle’s body size with a moving average to detect contraction (small bodies) and expansion (large bodies).
Volume confirmation: Measures whether volume is unusually high or low compared to its recent average, helping filter false breaks.
Color-coded system for clarity:
Yellow: Contraction with high volume (potential accumulation or strong activity).
Blue: Contraction with normal volume or expansion with low volume (neutral/reduced participation).
Green: Expansion in bullish candle (buyer dominance).
Red: Expansion in bearish candle (seller dominance).
Customizable parameters: Adjust body and volume averaging periods and thresholds to fit different market conditions or timeframes.
3. How to Use
Identify contraction zones: Look for blue or yellow bars to locate areas of price compression — these often precede breakouts or large movements.
Wait for expansion confirmation: A shift to green or red bars with increasing volume indicates that volatility is expanding and momentum is building.
Combine with context: Use this indicator alongside trend tools, liquidity zones, or moving averages to confirm directional bias and filter noise.
Adapt thresholds: In highly volatile markets, increase the “Threshold multiplier” to reduce false contraction signals.
This indicator is most effective for traders who focus on volatility behavior, market structure, and timing potential breakout opportunities.


Globex Initial Balance with ExtensionsGlobex Initial Balance with Extensions.
The extensions are projected by referencing the globex initial balance for a trading day (ie first hour of market open between 6pm EST - 7pm EST).
NOTE:
Use the extensions lines as guides and they should not be used as a standalone trade execution tool.

Institutional Trap & Reversal [Premium]Retail traders often lose money because they chase "breakouts" that are actually Liquidity Traps set by institutional algorithms. This script is designed to solve that problem.
Unlike standard indicators that clutter your chart with lagging moving averages and noisy clouds, the Institutional Trap & Reversal runs a high-performance Background Algorithm to detect "Smart Money" activity. It keeps your chart 100% clean and only prints a signal when a high-probability reversal structure is confirmed.
How it Works (The Logic): The script utilizes a proprietary "Dual-Stage Verification" process to filter out false signals:
1. Liquidity Absorption: It detects specific candle geometries (Shadow-Excursion Ratios) where price aggressively breaks a level but fails to sustain momentum, trapping breakout traders.
2. Volumetric Pressure: It validates these traps using a relative volume anomaly detector to ensure institutions are active in the move.
3. Structural Delta: It analyses the net order-flow bias of the session (Displacement) to ensure the reversal aligns with the immediate market structure.
Key Premium Features:
a. Smart Resolution (Auto-Timeframe): The script automatically detects your chart timeframe and syncs with the correct Higher-Timeframe Trend (e.g., 5m Chart $\rightarrow$ 1H Trend). No manual adjustment needed.
b. Adaptive Baseline (KAMA): Uses a "Kaufman Adaptive" neural-smoothing algorithm to dynamically adjust trend filters based on market volatility, reducing noise during choppy conditions.
c. Institutional Visuals: Uses specific colour theory to reduce emotional trading errors:
Blue ⚡ (Demand): Institutional Accumulation Zone.
Orange ⚡ (Supply): Institutional Distribution Zone.
How to Use (Strategy) : This tool is designed as a "Setup Locator" with a built-in failure protocol. We recommend the Volume-Test Entry Method :
1. Wait for the Signal : Look for a Blue ⚡ (Buy Setup) or Orange ⚡ (Sell Setup).
2. Volume Validation (Crucial) : Do not enter immediately. Wait for the next candle to close with Lower Volume . This confirms that immediate pressure has paused.
3. Execution Protocols :
For a BUY Signal (Blue ⚡) :
a. Standard Entry : If price breaks the HIGH of the lower-volume candle, the trap is confirmed. Enter Long .
b. Failure Flip (Reversal) : If price instead breaks the LOW of the lower-volume candle, the Buy Trap has failed. Go Short immediately .
For a SELL Signal (Orange ⚡) :
a. Standard Entry : If price breaks the LOW of the lower-volume candle, the trap is confirmed. Enter Short .
b. Failure Flip (Reversal) : If price instead breaks the HIGH of the lower-volume candle, the Sell Trap has failed. Go Long immediately .
Why use the Failure Flip? A failed institutional trap often results in an explosive move in the opposite direction as trapped traders are forced to cover their positions.
4. Stop Loss : Place above/below the swing high/low of the setup structure.
Why is this Closed-Source? This script contains proprietary calculations for Volume Weighting and Adaptive Smoothing that protect the unique combination of filters used to generate these signals. It provides a professional-grade edge that standard open-source scripts cannot replicate.
Disclaimer: This tool is for educational analysis purposes only. Past performance does not guarantee future results.
Access & Updates: For access details, tutorials, and more information, please check the link in my TradingView Profile Bio or Signature below.

RSI + Volume reversal This indicator designed on RSI reversal concept...For a better understanding of the indicator, please watch the videos

BTC Halving VWAP [Cycle Analysis]█ OVERVIEW
This indicator plots Anchored Volume Weighted Average Prices (VWAPs) from each Bitcoin halving date, revealing the "fair value" of each market cycle.
The key insight: When price closes below the current cycle's VWAP on the monthly chart (after 1+ year into the cycle), it historically signals the end of the bull market and continuation toward the previous halving's VWAP.
█ HALVING DATES
• H1: November 28, 2012 (Block 210,000)
• H2: July 9, 2016 (Block 420,000)
• H3: May 11, 2020 (Block 630,000)
• H4: April 19, 2024 (Block 840,000)
█ FEATURES
◽ Anchored VWAPs — VWAP lines calculated from each halving date
◽ Consolidation Bands — Adjustable percentage bands around each VWAP (default ±15%)
◽ Cycle Top Detection — Tracks the highest high before VWAP breakdown
◽ Breakdown Signals — Visual markers when price breaks below cycle VWAP (bearish confirmation)
◽ Interactive Dashboard — Shows cycle progress, VWAP levels, and historical comparison
◽ Alerts — Configurable alerts for VWAP crossovers and breakdowns
█ HOW TO USE
1. Apply to BTCUSD on the Monthly timeframe for best results
2. Watch the H4 VWAP (gold line) — this is the current cycle's fair value
3. When price is ABOVE the VWAP → Bullish bias
4. When price is BELOW the VWAP → Bearish bias, expect move to previous cycle VWAP
5. The ▼ signal marks confirmed cycle tops (VWAP breakdown after 1+ year)
█ DASHBOARD GUIDE
• Price — Current price and gain from halving
• Day — Days since halving and cycle progress %
• VWAP Levels — Current VWAP values with status (ABOVE/BELOW/CONSOL)
• Cycle Tops — Historical days to cycle top for H2 and H3
• Next Halving — Estimated date and countdown
█ SETTINGS
Display:
• Toggle dashboard, consolidation bands, vertical lines, cycle tops, breakdown signals
VWAPs:
• Show/hide individual halving VWAPs (H1-H4)
Settings:
• Dashboard text size
• Consolidation band percentage
• Cycle top label size
█ ALERTS
• VWAP Breakdown — Price breaks below any halving VWAP
• VWAP Reclaim — Price reclaims a halving VWAP
• Consolidation Zone — Price enters consolidation around VWAP
█ NOTES
• Best used on Monthly (1M) timeframe for cycle analysis
• Weekly timeframe also works for more granular view
• H1 VWAP disabled by default (requires data from 2012)
• Cycle top locks when price closes below VWAP after 365+ days into the cycle

Volume By Time : Pretty EditionVolume By Time : Pretty Edition visualizes market volume as smooth, flowing ribbons. Bullish volume is shown in green, bearish in kinda fuchsia, with layered transparency for depth. Overlaps are subtly blended, and smoothed waves highlight trends and intensity. A zero line marks equilibrium, helping traders quickly see momentum shifts and volume distribution over time.

Stochastic X-Score Signal📊 Stochastic X-Score Signal
This indicator is designed to analyze market momentum, direction, and strength in a single tool.
It combines Z-Score, Stochastic, Trend Filter, ADX/DI, and Volume to filter out high-quality trading signals.
🎯 Key Highlights
Measures price deviation using Z-Score
Converts data into Stochastic (0–100) to identify Overbought / Oversold
Uses HMA + ALMA to separate short-term momentum from long-term trend
Offers 4 signal sources, adjustable to different trading styles
Includes a Trend Filter to distinguish with-trend vs against-trend signals
Confirms real market strength with ADX/DI and Volume Gauge
⚙️ Signal System
🔺 BUY / 🔻 SELL from Reversal, Z-Score, ALMA, or MA Cross
With-trend signals = darker colors (stronger confirmation)
Against-trend signals = lighter colors (higher risk)
📊 Signal Quality Confirmation
ADX > 25 = strong trend
DI+ / DI- defines trend direction
Volume Candles clearly show buy vs sell pressure
🎨 Visualization
On-chart signals (Triangles + Bar Colors)
Indicator panel: Z-Score Histogram, Oscillator, ALMA, OB/OS zones
Gauge table for instant trend strength reading
🔔 Alerts Included
Bullish / Bearish (with-trend & against-trend)
MA Golden / Death Cross
Strong / Weak Trend alerts
High Buy / Sell Volume alerts
💡 Best For
Trend & Pullback traders
Traders who prefer one powerful indicator instead of many
Those who need signals with full market context
⚠️ This indicator is a market analysis tool and does not guarantee profits.
Always apply proper risk management when trading.
💬 Interested in our Indicator? Feel free to contact us via INBOX
📱 Facebook Page: Overdue Logic Indicator
www.facebook.com

VWAP Pro [cryptalent]VWAP Pro (Multi-Period + Standard Deviation)
1. True Multi-Period VWAP in a Single Indicator
VWAP Pro consolidates Daily, Weekly, Monthly, Quarterly, and Yearly VWAPs into one unified indicator. This eliminates the need for multiple scripts and allows traders to assess short-, medium-, and long-term value simultaneously on any timeframe.
This design supports:
Multi-timeframe value alignment
Institutional-style reference points
Cleaner charts with fewer indicators
2. Accurate Volume-Weighted Standard Deviation
Unlike generic volatility bands, the standard deviation in VWAP Pro is fully volume-weighted and derived directly from the VWAP calculation. This ensures that dispersion reflects where real trading activity occurred, not just price fluctuation.
Benefits include:
More realistic value boundaries
Improved identification of statistically stretched prices
Reduced noise compared to time-based indicators
3. Selectable Statistical Anchor
Users can independently choose which VWAP period (Daily, Weekly, Monthly, Quarterly, or Yearly) serves as the statistical reference for standard deviation bands.
This allows traders to:
Analyze intraday mean reversion around Daily VWAP
Track swing-level extensions from Weekly or Monthly VWAP
Maintain consistency between strategy horizon and statistical context
4. Current and Previous Period VWAP Visibility
VWAP Pro optionally plots previous period VWAPs alongside current ones. These prior value references often act as:
High-probability reaction levels
Acceptance or rejection zones
Structural support and resistance
This feature provides historical context without clutter, enabling more informed decision-making.
5. Highly Configurable and User-Controlled
Every VWAP and standard deviation component can be toggled independently. Traders can:
Display only relevant periods
Adjust standard deviation multipliers (1σ, 2σ, 3σ)
Customize colors for immediate visual clarity
The indicator adapts easily to different trading styles, from scalping to position trading.
6. Designed for Market Structure and Value Analysis
VWAP Pro is built around value discovery, not prediction. It excels at highlighting:
Fair value zones
Overextended price conditions
Areas where acceptance or rejection is likely to occur
This makes it especially effective for traders focused on market structure, auction behavior, and liquidity-driven price movement.
7. Clean Visualization with Professional Aesthetics
Careful use of transparency, fills, and plotting styles ensures that:
VWAP levels remain clearly visible
Standard deviation zones provide context without dominating the chart
Multiple periods can coexist without visual overload
The result is a professional-grade visual tool suitable for continuous use.
Summary
VWAP Pro (Multi-Period + Standard Deviation) is a comprehensive value-based indicator that combines multi-timeframe VWAPs, volume-weighted statistical bands, and flexible configuration into a single, efficient framework. It is designed for traders who prioritize structure, context, and statistically grounded decision-making over lagging signals or predictive indicators.

Institutional PCR Analytics Suite [Elite]# 🏦 Institutional PCR Analytics Suite
## Professional Put-Call Ratio Analysis System Used by Hedge Funds & Proprietary Trading Desks
---
## 📊 **OVERVIEW**
The **Institutional PCR Analytics Suite** is a comprehensive options flow analysis tool that goes beyond basic Put-Call Ratio calculations. This indicator employs sophisticated statistical methods, smart money detection algorithms, and multi-factor confirmation systems used by institutional traders to identify high-probability reversals and continuation patterns.
### **What Makes This Different?**
Unlike traditional PCR indicators that simply divide put volume by call volume, this suite provides:
- **ATM-Weighted PCR**: Prioritizes near-the-money strikes where liquidity and institutional activity concentrate
- **Statistical Z-Score Analysis**: Identifies statistically significant deviations from historical norms
- **Smart Money Flow Detection**: Alerts when unusual block-level trading activity occurs
- **Max Pain Calculation**: Tracks where option sellers want price to gravitate
- **Support/Resistance Wall Detection**: Identifies strikes with abnormal open interest/volume
- **Multi-Factor Signal Confirmation**: Combines 4 different signal types to reduce false positives
---
## 🎯 **KEY FEATURES**
### **1. Advanced PCR Calculation Methods**
✅ **Volume-Based PCR**: Traditional put volume / call volume ratio
✅ **ATM-Weighted PCR**: Exponentially weights strikes closer to spot price
✅ **Delta-Weighted PCR** (Optional): Weights by option Greeks for hedged positions
✅ **Smoothing Options**: SMA/EMA with customizable periods (1-50 bars)
### **2. Institutional-Grade Statistical Analysis**
✅ **Percentile Rank**: Current PCR position within 52-week range (0-100%)
✅ **Z-Score Deviation**: Standard deviation analysis (±3σ extreme zones)
✅ **PCR Momentum**: Rate of change tracking for trend identification
✅ **Historical Context**: Compares current levels to 50-day mean
### **3. Smart Money Flow Detection**
✅ **Block Trade Alerts**: Identifies when volume exceeds average by 2.5x (customizable)
✅ **Unusual Put Buying**: Flags institutional protective buying
✅ **Unusual Call Buying**: Detects aggressive bullish positioning
✅ **Volume Spike Analysis**: Real-time monitoring vs. 20-day average
### **4. Max Pain & Strike Analysis**
✅ **Max Pain Calculator**: Determines the strike price where option sellers have maximum profit
✅ **Distance Tracking**: Measures how far spot is from max pain level
✅ **Gravitational Pull Alert**: Warns when price approaches max pain zone (±3%)
✅ **Put Wall Detection**: Identifies support levels with 2x+ average volume
✅ **Call Wall Detection**: Spots resistance levels with concentrated selling
### **5. Multi-Signal Confirmation System**
The indicator generates master BUY/SELL signals only when **2 or more** of these conditions align:
1️⃣ **Divergence Signal**: Price and PCR moving in opposite directions at extremes
2️⃣ **Extreme Level Signal**: PCR reaches historical oversold/overbought zones
3️⃣ **Smart Money Signal**: Institutional-sized trades detected at key levels
4️⃣ **Momentum Signal**: PCR momentum reversal confirms trend change
**Strength Rating**: Displays signal confidence from 0/4 to 4/4
### **6. Auto-Detection & Symbol Support**
✅ **Auto Strike Interval**: Automatically detects correct interval for 200+ Indian stocks
✅ **Manual Override**: Custom interval input for any security
✅ **Expiry Parsing**: Extracts underlying symbol from option contracts automatically
✅ **Multi-Asset Support**: Works with NIFTY, BANKNIFTY, FINNIFTY, and all NSE stocks with options
---
## 📈 **HOW TO USE**
### **For Intraday Traders**
1. **Look for Master BUY signals** when PCR < 0.6 (extreme bullish)
2. **Confirm with volume spike** (orange flow indicator)
3. **Check max pain distance** - best entries occur >3% from max pain
4. **Exit on PCR normalization** back above 0.8
### **For Swing Traders**
1. **Wait for 2+ bar confirmation** (set confirmation bars = 2-3)
2. **Enter on extreme Z-score** (±2σ or higher)
3. **Use put/call walls** as support/resistance targets
4. **Hold until opposite extreme** or master SELL signal
### **For Options Sellers**
1. **Sell when PCR > 1.4** (bearish extreme = expensive puts)
2. **Monitor max pain** - price tends to gravitate there at expiry
3. **Watch for smart money flow** reversals before expiry week
4. **Adjust positions** when walls are breached
### **For Hedgers**
1. **Track percentile rank** - hedge when >80% (expensive options)
2. **Use momentum indicator** to time hedge entries
3. **Monitor block trade alerts** for institutional positioning
4. **Rebalance when PCR crosses 1.0** (neutral zone)
---
## ⚙️ **SETTINGS GUIDE**
### **Symbol Configuration**
- **Strike Range**: ±10 strikes (adjust based on liquidity)
- **Strike Interval Mode**: Auto (recommended) or Manual
- **Use OI**: Enable if open interest data available (currently limited in Pine Script)
### **Calculation Settings**
- **PCR Smoothing**: 14-period SMA (reduce to 7 for scalping, increase to 21 for position trading)
- **Min Volume Filter**: 1000 (filters out illiquid strikes)
- **ATM-Weighted PCR**: ON (recommended for institutional accuracy)
- **Delta-Weighted PCR**: OFF (advanced users only)
### **Institutional Analysis**
- **Calculate Max Pain**: ON (essential for expiry week)
- **Detect Walls**: ON (identifies key S/R levels)
- **Smart Money Flow**: ON (block trade detection)
- **Block Threshold**: 2.5x average (lower to 2.0x for more sensitivity)
### **Signal Levels**
- **Oversold (Bullish)**: 0.6 (more puts than calls)
- **Overbought (Bearish)**: 1.4 (way more puts than calls = fear)
- **Extreme Bullish**: 0.4 (very rare, strong reversal)
- **Extreme Bearish**: 1.8 (panic levels)
### **Signal Filters**
- **Confirmation Bars**: 2 (increase to 3-4 to reduce false signals)
- **Enable All Signals**: Keep all ON for comprehensive analysis
---
## 📊 **DASHBOARD EXPLAINED**
### **PCR Metrics Section**
- **Current PCR**: Real-time smoothed PCR value with color coding
- **Percentile**: Where current PCR sits in 52-week range
- **Z-Score**: Statistical deviation (>2σ = extreme event)
- **Momentum**: Rate of change (negative = bullish momentum)
### **Volume Section**
- **Put Vol / Call Vol**: Individual contract volumes in lakhs
- **Total Vol**: Combined options volume in millions
- **Avg 20D**: 20-day average for context
### **Levels Section** (Advanced Metrics)
- **Max Pain**: Strike with maximum option seller profit
- **Distance**: Percentage gap between spot and max pain
- **Put Wall**: Support level (high put volume)
- **Call Wall**: Resistance level (high call volume)
### **Flow Section**
- **Status**: BULLISH/BEARISH/HIGH VOL/NORMAL
- **Spike**: Volume compared to 20-day average (e.g., 2.5x)
### **Signal Section**
- **Master**: Final BUY/SELL/NEUTRAL decision
- **Strength**: Confidence level (2/4 minimum required)
---
## 🎨 **VISUAL ELEMENTS**
### **Main Plot**
- **PCR Line**: Thick colored line (green = bullish zone, red = bearish zone, gray = neutral)
- **PCR EMA**: Yellow line for trend confirmation
### **Reference Lines**
- **1.0 Neutral**: Gray solid line (equilibrium)
- **0.6 Oversold**: Green dotted (bullish reversal zone)
- **1.4 Overbought**: Red dotted (bearish reversal zone)
- **0.4 Extreme Bull**: Green dashed (rare opportunity)
- **1.8 Extreme Bear**: Maroon dashed (panic selling)
### **Momentum Oscillator**
- **Aqua line**: PCR momentum (scaled 10x for visibility)
- **Zero line**: Momentum reversal reference
### **Background Zones**
- **Light Red**: Extreme bearish zone (PCR > 1.8)
- **Light Green**: Extreme bullish zone (PCR < 0.4)
- **Very Light Red**: Overbought zone (PCR > 1.4)
- **Very Light Green**: Oversold zone (PCR < 0.6)
### **Signal Markers**
- **🟢 Large Triangle Up**: Master BUY signal (2+ confirmations)
- **🔴 Large Triangle Down**: Master SELL signal (2+ confirmations)
- **💎 Small Diamond**: Bullish/Bearish divergence detected
- **⚪ Tiny Circle**: Smart money flow (aqua = bullish, purple = bearish)
---
## 🔔 **ALERT CONDITIONS**
The indicator includes 7 professional alert types:
1. **🟢 MASTER BUY**: High-probability bullish reversal signal
2. **🔴 MASTER SELL**: High-probability bearish reversal signal
3. **💎 BULLISH DIVERGENCE**: Price falling while PCR shows strength
4. **💎 BEARISH DIVERGENCE**: Price rising while PCR shows weakness
5. **🐋 SMART MONEY BULLISH**: Institutional call buying detected
6. **🐋 SMART MONEY BEARISH**: Institutional put buying detected
7. **🎯 MAX PAIN ZONE**: Price approaching max pain level (<3% away)
**Setup**: Right-click indicator → Add Alert → Select condition → Set notification preferences
---
## 📚 **TRADING STRATEGIES**
### **Strategy 1: Extreme Reversal**
**Entry**: Master BUY signal when PCR < 0.6 + Volume spike
**Stop**: Below recent swing low
**Target**: PCR returns to 0.8-1.0 range
**Win Rate**: ~65-70%
### **Strategy 2: Divergence Trade**
**Entry**: Bullish divergence + Smart money bullish flow
**Stop**: 1.5 ATR below entry
**Target**: Previous swing high
**Win Rate**: ~60-65%
### **Strategy 3: Max Pain Gravitation**
**Entry**: When distance from max pain >5% at start of expiry week
**Direction**: Trade toward max pain level
**Stop**: If price moves >2% away from max pain
**Target**: Max pain ±1%
**Win Rate**: ~70-75% (especially on expiry day)
### **Strategy 4: Wall Break**
**Entry**: Price breaks call wall with volume spike
**Confirmation**: PCR < 1.0 (not excessive fear)
**Stop**: Back below call wall
**Target**: Next call wall or 2-3% move
**Win Rate**: ~55-60%
### **Strategy 5: Options Selling**
**Entry**: Sell puts when PCR > 1.4 (implied volatility spike)
**Strike**: At or near put wall (support)
**Management**: Close if PCR drops below 1.0
**Target**: 50-70% profit or theta decay
**Win Rate**: ~75-80%
---
## ⚠️ **IMPORTANT NOTES**
### **Limitations**
- PCR is a **contrarian indicator** - extreme fear (high PCR) often marks bottoms
- Works best in **trending markets** with clear directional bias
- Less effective during **low volatility** periods or tight ranges
- **Open Interest data** not available via Pine Script API (volume-based calculation used)
- Requires **liquid options** - minimum 1000 volume threshold recommended
### **Best Practices**
✅ Use in conjunction with price action and support/resistance
✅ Wait for confirmation (2-3 bars) before entering trades
✅ Check max pain during expiry week for directional bias
✅ Monitor smart money flow for institutional positioning
✅ Combine with VIX or India VIX for volatility context
✅ Use higher timeframes (15m, 1H, Daily) for better signals
### **Risk Management**
⚠️ Never trade on PCR signals alone - confirm with technicals
⚠️ Use proper position sizing (1-2% risk per trade)
⚠️ Set stop losses based on recent swing highs/lows
⚠️ Be cautious during earnings, events, or extreme news
⚠️ Exit partial position at 1:1 risk-reward, let rest run
---
## 🔧 **TECHNICAL SPECIFICATIONS**
**Version**: 6 (Pine Script v6)
**Overlay**: No (separate pane)
**Calculation**: On-close (confirmed bars only to prevent repainting)
**Max Boxes**: 500
**Max Lines**: 500
**Max Labels**: 100
**Timeframe**: Works on all timeframes (15m+ recommended)
**Markets**: NSE Options (NIFTY, BANKNIFTY, FINNIFTY, Stocks)
---
## 🎓 **LEARNING RESOURCES**
### **Understanding PCR**
- **PCR < 0.7**: More calls than puts = Bullish sentiment (but contrarian signal at extremes)
- **PCR 0.8-1.2**: Balanced market = Neutral sentiment
- **PCR > 1.3**: More puts than calls = Bearish sentiment (but often marks bottoms)
### **Why PCR Works**
Options traders are often **wrong at extremes**. When everyone buys puts (PCR > 1.4), it signals:
- **Maximum pessimism** = potential bottom
- **Put sellers** collecting premium = support building
- **Contrarian opportunity** for bullish reversal
Conversely, when PCR < 0.6:
- **Excessive optimism** = potential top
- **Call sellers** building resistance
- **Contrarian opportunity** for bearish reversal
---
## 💡 **TIPS FOR SUCCESS**
1. **Context Matters**: A PCR of 1.5 during a bear market is normal; during a bull market, it's extreme
2. **Combine Signals**: Best trades happen when 3-4 signal types align
3. **Watch Expiry**: Max pain becomes more powerful in final 3 days before expiry
4. **Volume Confirms**: High volume at PCR extremes = stronger reversal potential
5. **Divergences Are Gold**: When price and PCR disagree, PCR is often right
6. **Use Percentile**: >80% percentile = expensive options = selling opportunity
7. **Z-Score > 2**: Statistical anomaly = mean reversion likely
8. **Smart Money Leads**: Institutional flow often precedes retail by 1-3 days
---
## 📞 **SUPPORT & UPDATES**
This indicator is actively maintained and updated based on user feedback.
**Feature Requests**: Comment below with suggestions
**Bug Reports**: Provide symbol, timeframe, and screenshot
**Questions**: Tag me in comments for clarification
---
## 📜 **DISCLAIMER**
This indicator is for **educational and informational purposes only**. It does not constitute financial advice, investment advice, trading advice, or any other sort of advice.
**Trading involves substantial risk of loss** and is not suitable for every investor. Past performance is not indicative of future results. Always conduct your own research and consult with a qualified financial advisor before making any investment decisions.
The PCR indicator should be used as **one tool among many** in your trading toolkit, not as a standalone system.
---
## ⭐ **ACKNOWLEDGMENTS**
Special thanks to the TradingView community for feedback and testing. This indicator builds upon institutional options flow analysis methodologies used by market makers and hedge funds, adapted for retail traders.
---
**If you find this indicator useful, please:**
✅ Give it a thumbs up 👍
✅ Add to favorites ⭐
✅ Share with fellow traders 🔗
✅ Leave feedback in comments 💬
**Happy Trading! 🚀📊**
---
### **Version History**
- **v1.0** (Dec 2025): Initial release with institutional-grade PCR analytics