Volume Delta Candles 5TF + MTF Candles [SYNC & TRADE]Volume Delta Candles 5TF + MTF Candles Script Description (English)
Purpose
The Volume Delta Candles 5TF + MTF Candles script is an analytical tool for traders leveraging volume delta and multi-timeframe (MTF) analysis. It visualizes volume delta (the difference between buying and selling volumes) across five timeframes, aiding in the identification of manipulations, strong market impulses, and trend signals.
Additionally, it overlays higher timeframe candles on the current chart, providing context for decision-making.
The indicator is ideal for traders focusing on volume, manipulation analysis, or trend-following strategies. Its uniqueness lies in its detailed five-timeframe delta analysis, automated timeframe selection, and customizable settings.
Volume Delta Analysis
Volume delta is the core metric of the script, representing the difference between buying and selling volumes over a given period. It is divided into five levels, each corresponding to one of the five timeframes, enabling traders to observe how market activity varies across temporal scales. The primary delta is automatically adjusted based on the selected chart timeframe, ensuring relevance.
Timeframe Selection
Primary Timeframes: Automatically determined based on the chart, including monthly, weekly, daily, 4-hour, and hourly periods. These cover long- and medium-term trends, providing a robust context.
Lower Timeframes: Optimized to capture significant short-term movements. These are shorter than primary timeframes and focus on market micro-activity, such as manipulations or impulses.
Five Timeframe Interconnection
The five timeframes provide a comprehensive analysis by balancing granularity and context. Each timeframe evaluates volume delta, creating a layered perspective:
Short Timeframes: Capture immediate changes in activity (e.g., buying or selling spikes).
Long Timeframes: Assess the sustainability of movements, filtering out short-term noise. Delta for each timeframe is displayed as a separate candle, with color and size reflecting its magnitude and direction. This allows traders to compare short-term actions against broader trends.
Delta’s Impact on Candles
Volume delta directly influences candle visualization, reflecting market dynamics. Splitting delta into five parts (one per timeframe) makes the analysis intuitive. Key scenarios include:
Small Delta on Lower Timeframe, Large on Higher:
Description: A low timeframe shows minimal delta (e.g., slight buying/selling difference), while a higher timeframe shows significant delta (e.g., strong buying dominance).
Interpretation: Suggests large players accumulating positions on the higher timeframe, masked by low activity on the lower. Traders may enter in the direction of the higher trend.
Visualization: The lower timeframe candle is narrow and faint, while the higher timeframe candle is wide and vibrant (blue for positive delta, red for negative).
Large Delta on Lower Timeframe, Small on Higher:
Description: A low timeframe exhibits strong delta (e.g., a selling surge), but the higher timeframe shows weak activity.
Interpretation: Indicates a short-term impulse or manipulation unsupported by the broader trend. Traders should be cautious, as the move may be false.
Visualization: The lower timeframe candle is bright and wide, while the higher timeframe candle is faint and narrow.
Reverse Delta:
Description: A lower timeframe shows positive delta (buying dominance), while a higher timeframe shows negative delta (selling dominance), or vice versa.
Interpretation: Suggests potential manipulation or reversal. For example, short-term buying may be absorbed by selling on a higher timeframe, signaling bearish weakness.
Visualization: Candles on different timeframes have opposing colors (e.g., blue on lower, red on higher).
Deltas in Both Directions:
Description: Delta alternates between positive and negative across timeframes without clear dominance.
Interpretation: Reflects market indecision or consolidation. Traders should wait for clearer signals or use additional indicators.
Visualization: Candles across timeframes show mixed colors and sizes, creating a “scattered” pattern.
Empty Candles (Void):
Description: Delta on one or more timeframes is near zero despite price movement.
Interpretation: Indicates false movement or lack of market interest, often tied to manipulations like false breakouts.
Visualization: Marked with a diamond (void manipulation), with the candle appearing minimal and faint.
Utility
Detailed Delta Analysis: Five delta levels reveal market activity from micro- to macro-levels.
Manipulation Detection: Highlights candles with price-delta divergence, aiding in spotting false moves.
Strong Candles: Marks impulsive moves with high delta and volume.
MTF Analysis: Displays higher timeframe candles, simplifying trend and key level analysis.
Versatility: Sensitivity settings make it suitable for stocks, forex, crypto, and all timeframes.
How to Use
Adding to Chart:
Open TradingView and select an asset.
Find “Volume Delta Candles 5TF + MTF Candles ” in the “Indicators” menu.
Confirm access (invite-only script).
Interpreting Signals:
Delta Candles: Colored by delta direction (blue for positive, red for negative). Color intensity and candle size reflect delta strength across five timeframes.
Manipulations:
Triangles: Strong price-delta divergence.
Crosses: Weak divergence.
Diamonds: Void candles with minimal delta.
Strong Candles: Circles below/above candles indicate high-delta impulses.
MTF Candle: A transparent higher timeframe candle shows trend and range.
Trading Application:
Use manipulations to spot reversals or false breakouts.
Confirm impulses with strong candles and higher timeframe delta.
Analyze MTF candles for trend context.
Compare delta across all five timeframes to filter signals.
Combine with support/resistance or other indicators.
Settings
Parameters are grouped for ease of customization.
1. Labels
Show Manipulations: Display strong manipulation labels (triangles).
Show Void Manipulations: Show void manipulations (diamonds).
Show Delta Sandwich: Reserved for future updates.
Show Strong Candles: Display strong candles (circles).
2. Filters (Strong Candle Filter)
Filter Sensitivity: Filter sensitivity:
Normal: For stable markets.
Medium: For moderate volatility.
Sensitive: For high-frequency trading.
3. Delta Colors
Delta 1↑ (Main): Color for positive delta on the main timeframe.
Delta 1↓ (Main): Color for negative delta on the main timeframe.
Other timeframes use derived colors with varying opacity.
4. Timeframes
Timeframe Sensitivity: Sensitivity for lower timeframes:
Normal: Standard division.
Medium: More detailed analysis.
Sensitive: Maximum detail.
5. MTF Candle
Show MTF Candle: Display higher timeframe candle.
Bullish/Bearish Color: Colors for bullish/bearish candles.
Show High/Low: Show highs/lows.
High/Low Color: Color for high/low lines.
MTF Timeframe: Select higher timeframe (default: daily).
Описание скрипта Volume Delta Candles 5TF + MTF Candles (Русский)
Назначение
Скрипт Volume Delta Candles 5TF + MTF Candles — это аналитический инструмент для трейдеров, использующих дельту объема и анализ нескольких таймфреймов (MTF). Он визуализирует дельту объема (разницу между объемами покупок и продаж) на пяти таймфреймах, помогая выявлять манипуляции, сильные рыночные импульсы и трендовые сигналы. Дополнительно скрипт отображает свечи старшего таймфрейма на текущем графике, предоставляя контекст для принятия решений.
Индикатор подходит для трейдеров, работающих с объемами, анализом манипуляций или трендовыми стратегиями. Его уникальность заключается в детализированном анализе дельты объема на пяти таймфреймах, адаптивной автоматизации таймфреймов и гибких настройках.
Анализ дельты объема
Дельта объема — это ключевая метрика скрипта, отражающая разницу между объемами покупок и продаж за определенный период. Она разделена на пять уровней, соответствующих пяти таймфреймам, что позволяет трейдерам видеть, как рыночная активность варьируется на разных временных масштабах. Основная дельта подбирается автоматически в зависимости от выбранного таймфрейма графика, обеспечивая релевантность анализа.
Выбор таймфреймов
Основные таймфреймы: Автоматически определяются на основе текущего графика и включают месяц, неделю, день, 4 часа и час. Эти таймфреймы выбраны для охвата долгосрочных и среднесрочных трендов, обеспечивая контекст для анализа.
Нижние таймфреймы: Подбираются методом оптимизации для выявления наиболее значимых краткосрочных движений. Они короче основных таймфреймов и фокусируются на микроактивности рынка, такой как манипуляции или импульсы.
Взаимосвязь пяти таймфреймов
Пять таймфреймов обеспечивают комплексный анализ, сочетая детализацию и контекст. Каждый таймфрейм анализирует дельту объема, создавая многослойную картину:
Короткие таймфреймы: Улавливают моментальные изменения активности (например, всплеск покупок или продаж).
Длинные таймфреймы: Оценивают устойчивость движений, фильтруя шум краткосрочных колебаний. Дельта на каждом таймфрейме отображается отдельной свечой, с цветом и размером, зависящими от ее величины и направления. Это позволяет трейдерам сравнивать, как краткосрочные действия соотносятся с более широкими трендами.
Влияние дельты на свечи
Дельта объема напрямую влияет на визуализацию свечей, отражая рыночную динамику. Разделение дельты на пять частей (по одному для каждого таймфрейма) делает анализ интуитивно понятным. Рассмотрим ключевые сценарии:
Маленькая дельта на низком таймфрейме, большая на высоком:
Описание: На младшем таймфрейме дельта мала (например, незначительная разница между покупками и продажами), но на старшем таймфрейме дельта велика (например, сильный перевес покупок).
Интерпретация: Это может указывать на накопление позиций крупными игроками на старшем таймфрейме, маскируемое низкой активностью на младшем. Трейдеры могут использовать это как сигнал для входа в направлении старшего тренда.
Визуализация: Свеча младшего таймфрейма будет узкой и бледной, а свеча старшего — широкой и яркой (синяя для положительной дельты, красная для отрицательной).
Большая дельта на низком таймфрейме, маленькая на высоком:
Описание: На младшем таймфрейме наблюдается сильная дельта (например, всплеск продаж), но на старшем — слабая активность.
Интерпретация: Это может быть краткосрочным импульсом или манипуляцией, не поддерживаемой общим трендом. Трейдеры должны быть осторожны, так как движение может быть ложным.
Визуализация: Свеча младшего таймфрейма яркая и широкая, а старшего — бледная и узкая.
Обратная дельта:
Описание: Дельта на младшем таймфрейме положительная (покупки преобладают), а на старшем — отрицательная (продажи доминируют), или наоборот.
Интерпретация: Указывает на потенциальную манипуляцию или разворот. Например, краткосрочные покупки могут быть поглощены продажами на старшем таймфрейме, сигнализируя о слабости быков.
Визуализация: Свечи разных таймфреймов окрашены в противоположные цвета (например, синяя на младшем, красная на старшем).
Дельты в оба направления:
Описание: На разных таймфреймах дельта чередуется между положительной и отрицательной без явного доминирования.
Интерпретация: Отражает неопределенность или консолидацию на рынке. Трейдерам стоит дождаться более четких сигналов или использовать другие индикаторы.
Визуализация: Свечи разных таймфреймов имеют смешанные цвета и размеры, создавая «разбросанную» картину.
Пустые свечи (Void):
Описание: Дельта на одном или нескольких таймфреймах близка к нулю, несмотря на движение цены.
Интерпретация: Указывает на ложное движение или отсутствие интереса участников рынка. Это часто связано с манипуляциями, такими как ложные пробои.
Визуализация: Отмечается ромбовидной меткой (void-манипуляция), а свеча имеет минимальный размер и бледный цвет.
Полезность
Детализированный анализ дельты: Пять уровней дельты показывают, как рыночная активность варьируется от микро- до макроуровня.
Обнаружение манипуляций: Маркирует свечи с расхождением цены и дельты, помогая выявить ложные движения.
Сильные свечи: Выделяет импульсные движения с высокой дельтой и объемом.
MTF-анализ: Отображает свечи старшего таймфрейма, упрощая анализ трендов и ключевых уровней.
Универсальность: Настройки чувствительности делают скрипт подходящим для акций, форекса, криптовалют и любых таймфреймов.
Как использовать
Добавление на график:
Откройте TradingView и выберите актив.
Найдите индикатор «Volume Delta Candles 5TF + MTF Candles » в меню «Индикаторы».
Подтвердите доступ (скрипт invite-only).
Интерпретация сигналов:
Дельта-свечи: Окрашены по направлению дельты (синий — положительная, красный — отрицательная). Интенсивность цвета и размер свечи зависят от силы дельты на каждом из пяти таймфреймов.
Манипуляции:
Треугольники: Сильное расхождение цены и дельты.
Кресты: Слабое расхождение.
Ромбы: Пустые свечи (void), указывающие на минимальную дельту.
Сильные свечи: Круги под/над свечами обозначают импульсы с высокой дельтой.
MTF-свеча: Прозрачная свеча старшего таймфрейма показывает тренд и диапазон.
Применение в торговле:
Используйте манипуляции для поиска разворотов или ложных пробоев.
Подтверждайте импульсы сильными свечами и дельтой на старших таймфреймах.
Анализируйте MTF-свечи для определения трендового контекста.
Сравнивайте дельту на всех пяти таймфреймах для фильтрации сигналов.
Комбинируйте с уровнями поддержки/сопротивления или другими индикаторами.
Настройки
Параметры сгруппированы для удобства настройки.
1. Метки (Labels)
Show Manipulations: Показывать сильные манипуляции (треугольники).
Show Void Manipulations: Показывать void-манипуляции (ромбы).
Show Delta Sandwich: Зарезервировано для будущих обновлений.
Show Strong Candles: Показывать сильные свечи (круги).
2. Фильтры (Strong Candle Filter)
Filter Sensitivity: Чувствительность фильтра:
Normal: Для стабильных рынков.
Medium: Для умеренной волатильности.
Sensitive: Для высокочастотной торговли.
3. Цвета дельты (Delta Colors)
Delta 1↑ (Main): Цвет положительной дельты основного таймфрейма.
Delta 1↓ (Main): Цвет отрицательной дельты основного таймфрейма.
Остальные таймфреймы используют производные цвета с разной прозрачностью.
4. Таймфреймы (Timeframes)
Timeframe Sensitivity: Чувствительность нижних таймфреймов:
Normal: Стандартное деление.
Medium: Более детализированный анализ.
Sensitive: Максимальная детализация.
5. MTF-свеча (MTF Candle)
Show MTF Candle: Показывать свечу старшего таймфрейма.
Bullish/Bearish Color: Цвета бычьей/медвежьей свечи.
Show High/Low: Показывать максимумы/минимумы.
High/Low Color: Цвет линий максимума/минимума.
MTF Timeframe: Выбор старшего таймфрейма (по умолчанию — дневной).
Volumedelta

Real Cumulative Delta VolumeReal Cumulative Delta Volume (CDV) - Enhanced Volume Flow Analysis
What This Indicator Does
This indicator calculates cumulative delta volume using an enhanced approximation methodology that analyzes buying and selling pressure within each candlestick. It provides traders with insights into volume flow dynamics by tracking the cumulative difference between estimated buy and sell volumes over time.
Technical Methodology & Calculation Details
Volume Distribution Algorithm: The indicator uses a price-weighted distribution method to estimate buy and sell volumes within each bar:
Delta multiplier = (close - low) / (high - low)
Buy volume = total volume × delta multiplier
Sell volume = total volume × (1 - delta multiplier)
Net delta = buy volume - sell volume
Cumulative Delta Tracking: Unlike basic volume indicators, this approach maintains a running cumulative total of net delta values:
CDV Open = Previous CDV Close
CDV Close = Previous CDV Close + Net Delta
CDV High/Low = Previous CDV Close + estimated intrabar extremes
Enhanced Features Beyond Standard CDV:
Divergence Detection: Automatically identifies when price direction conflicts with volume flow direction
Body Size Analysis: Compares current vs previous CDV candle body sizes to detect momentum changes
Conditional Color Coding: Special visual alerts when specific price/volume relationships occur
Signal Generation: Buy/sell signals based on divergence resolution patterns
How This Differs from Basic Cumulative Delta
Standard Limitations Addressed:
Most cumulative delta indicators on TradingView use simple uptick/downtick classification. This indicator enhances the approach by:
Price-Weighted Distribution: Instead of assuming 50/50 volume splits, uses the bar's price action (close relative to high/low) to estimate volume distribution
OHLC Representation: Displays CDV as candlesticks rather than just a line, showing intrabar volume dynamics
Integrated Divergence Detection: Built-in algorithms identify price/volume conflicts automatically
Advanced Signal Logic: Multi-condition signal generation beyond simple crossovers
Visual Enhancement Features:
Dual display modes (candlestick or line)
Special color coding for divergence conditions
Moving average overlays for trend confirmation
Optional buy/sell signal markers
Signal Generation Logic
Buy Signals Generated When:
Previous bar showed bearish divergence (price down, CDV up)
Current CDV candle shows specific color condition
Current CDV body is contained within previous divergence body
Price closes above previous high
Sell Signals Generated When:
Previous bar showed bullish divergence (price up, CDV down)
Current CDV candle shows specific color condition
Current CDV body is contained within previous divergence body
Price closes below previous low
Trading Applications
Volume Flow Analysis:
Identify periods of hidden accumulation or distribution
Spot when large players are buying/selling against the price trend
Confirm trend strength through volume alignment
Divergence Trading:
Early warning system for potential reversals
Identify when price movements lack volume support
Time entries based on divergence resolution
Trend Confirmation:
Use CDV direction to confirm price trend validity
Moving averages on CDV provide additional trend context
Volume momentum changes often precede price momentum shifts
Display Options & Settings
Visual Modes:
Candlestick: Full OHLC representation of cumulative delta
Line: Simplified cumulative line display
Moving Averages:
Optional SMA overlays (default: 50, 200 periods)
Optional EMA overlays (default: 50, 200 periods)
Customizable periods and colors
Signal Controls:
Toggle buy/sell signals on/off independently
Customizable colors for all visual elements
Adjustable transparency and styling options
Usage Guidelines & Limitations
Best Practices:
Most effective on timeframes 15m and higher due to volume data quality
Works best in liquid markets with consistent volume
Should be used alongside price action analysis and support/resistance levels
Signals are more reliable during trending market conditions
Technical Limitations:
Uses approximation methods due to lack of tick-by-tick data in Pine Script
Volume distribution estimates may be less accurate during gaps or low-volume periods
Effectiveness depends on quality of volume data from your broker/exchange
Market Context Considerations:
Less reliable during market holidays or extremely low volume sessions
News events and earnings can cause volume anomalies that affect calculations
Consider market microstructure when interpreting signals on very short timeframes
Important Disclaimers
Educational Purpose: This indicator is designed for educational and analysis purposes. It does not constitute financial or investment advice.
Risk Warning: All trading involves risk of loss. Past performance of any indicator signals does not guarantee future results.
Testing Required: Users should thoroughly backtest and forward test this indicator before using it in live trading. Paper trading is recommended to understand signal behavior.
No Guarantees: The developer makes no claims about profitability or accuracy. Market conditions change and historical effectiveness may not continue.
Proper Usage: This is a technical analysis tool, not a complete trading system. Always use appropriate risk management, position sizing, and combine with other forms of analysis.
Developer: Delta Merge Professional Trading Applications
Access Instructions: Send a private message through TradingView explaining your trading experience and how you plan to use this indicator. Access is provided to traders who demonstrate understanding of volume analysis concepts and proper risk management practices.

TradingIQ - OrderFlow IQIntroducing “OrderFlow IQ”
OrderFlow IQ is an all-in-one order-flow and volume-profiling suite crafted to bring true market microstructure to your TradingView charts. It bundles footprints, per-bar and intra-bar delta analytics, class-based delta tracking, adaptive volume profiles, bubble-style trade tapes, live time-and-sales feeds, cumulative-volume fight meters, iceberg detection, and more—all driven by a single, user-friendly interface.
Features
The list below details an ever=expanding list of the indicators capabilities; more to come in the future!
Tick-based Footprints
Imbalance and stacked imbalance detection
Tick-based chronicled volume profile
Delta classification (small order, medium order, and block order delta)
Tick-based order flow bubble tape
Live order feed with total buying volume against total selling volume
Tick-based CVD
Iceberg order detection
Delta class lines
Tick-based bar statistics
Key Components and Their Functions
Data Granularity
• 1-Tick / 1-Second / 1-Minute modes let you choose the resolution of every calculation. On true tick charts you get genuine tick-by-tick precision; on second charts you see every intra-second print; on anything else it falls back to minute bars.
Footprint Engine
Bid vs Ask Volume Columns – Each candle is sliced into tick-level price rows showing buy-volume, sell-volume, total volume, delta and delta%.
CVD-Level Columns – Optionally color each row by net cumulative delta instead of raw volume to spotlight buying or selling pressure trends.
Imbalance Detection – Highlight rows where one side exceeds your % threshold, with “stacked” imbalances calling out multi-row alignment ahead of potential breaks.
Value Area & POC – Automatically compute and draw the 70% value area (VAH/VAL) and mark the Point of Control per session or any chosen timeframe.
Footprint
The image above shows the volume profiling data calculated for each row across the footprint engine.
Delta: Shows the net difference between buying and selling
Delta Percentage: Calculates delta as a percentage of total volume
Total Volume: The total volume at the price block
Buy Volume: The total buying volume at the price block
Sell Volume: The total selling volume at the price block
Additionally, you can select to only show buying volume and selling volume at each price block, as shown in the image above.
POC
The image above shows the visuals used to mark the POC of the footprint. The POC is marked yellow by default; the color can be changed in the settings.
Value Area
The image above shows the visuals used to mark the value area of the footprint.
Imbalance Detection
The image above shows the Footprint Engine detecting and marking buying/selling imbalances.
Stacked Imbalances
The image above shows the Footprint Engine detecting and marking stacked imbalances. Stacked imbalances are shown as consecutive, small blocks to the right of the footprint.
CVD Levels
The image above shows the footprint engine calculating CVD across the footprint, rather than net delta that resets bar by bar. Traders can enable the "Use CVD Levels" setting to have net delta persist across price bars, allowing traders to see the net CVD across various price blocks as the footprint develops.
Delta Class Statistics
With the inclusion of tick volume, The Delta Class Statistics component of the indicator classifies volume delta by order size to give traders detailed insights into whether small players are buying/selling and whether big players are buying/selling.
The image above shows a full view of the Delta Class Statistics feature.
The image above further explains the Delta Class Statistics view.
Orders are distributed (classified) across various order size amounts. From here, a rolling CVD is calculated across each order size. This feature gives traders detailed insights into whether big money is buying/selling (big player sentiment) and whether small money is buying/selling (small player sentiment).
Analysis
The image above shows a net-negative CVD for the session for both small orders (small money) and big orders (big money), while "medium" sized orders are currently at a net-positive CVD.
Consequently, sentiment for big players is bearish.
Additionally, small triangles are printed alongside each Delta Class box for each bar. You can hover over these labels with your cursor to see the net delta for the bar for each order size.
Bar Delta Statistics
With the inclusion of tick data, OrderFlow IQ is designed to generate detailed tick-based bar statistics for each candlestick.
The image above shows the feature in action.
Metrics
Volume: Total volume for the bar
Bar VWAP: The individual bar's VWAP
Delta: Net delta for the bar
Delta %: Delta % of the bar
Max Delta: The maximum positive delta achieved during the bar
Min Delta: The lowest negative delta achieved during the bar
CVD: Cumulative volume delta measurement by the bar
Buy Volume: Total buying volume for the bar
Sell Volume: Total selling volume for the bar
Iceberg Detection (Tick-Data Only)
An Iceberg Order is a type of large trading order that is broken up into much smaller visible portions. Only a small part of the order is displayed in the public order book at any given time, while the rest is hidden (like an iceberg where only the tip is above water).
Why are Iceberg Orders Important?
Minimizing Market Impact
If a trader were to post a 10,000-share sell order openly, the market would immediately react:
Buyers might panic, thinking there's a rush to sell.
Sellers could undercut the price aggressively.
This would likely drive the price down before the large order even finishes executing.
By revealing only a small portion at a time, Iceberg orders help avoid spooking the market and allow the trader to sell closer to the original price.
Hiding Trading Intentions
Markets are highly sensitive to order flow — the balance of buying and selling pressure.
If competitors, market makers, or algorithmic traders see a massive order, they might:
Front-run it (selling before it completes to profit from the expected price drop).
Reassess their own models about supply/demand imbalances.
Iceberg orders protect against this by masking true supply or demand.
Our Iceberg Detection Model
Using a proprietary iceberg order detection algorithm, OrderFlow IQ is capable of detecting/alerting iceberg orders when they occur.
The image above shows the Iceberg Detector in action.
When an iceberg order is identified, the size of the order in the quote currency, price of execution, and number of executions will be displayed.
It's important to set alerts for this feature, as iceberg orders aren't frequent and are easy to miss when away from the chart.
IQ Volume Profile (Chronicled Volume Profile)
OrderFlow IQ generates a Chronicled Volume Profile to give traders detailed insights into net delta by price level, but also historical net delta by price level.
The image above shows the feature in action. While the chronicled volume profile is seemingly a normal volume profile, the narrow-lines across the chronicle profile show historical min/max delta at each price level.
The image above exemplifies the feature.
The wide price blocks show the current net delta at each price area, while the small lines (with a circle at the end) show historical min/max delta at the price level.
This tool allows traders to see if buying/selling always dominated a price level, or if control of the price level changed hands between buyers/sellers throughout development of the profile.
Additionally, traders can hover over the small circles on the profile with their cursor to see the detailed delta statistics at each price area. The statistics will show the minimum delta at the price area, maximum delta, and the live change in delta.
Order Feed
OrderFlow IQ is capable of generating a live order feed with various metrics to assist real time orderflow traders in their analysis.
The image above exemplifies the feature.
Bid/Ask: The bid price and ask price of the current bar
Buys | Price: The size of a buy order and price of execution
Sells | Price: The size of a sell order and price of execution
▴ Vol: Cumulative buying volume (in quote currency) for the feed
▾ Vol: Cumulative selling volume (in quote currency) for the feed
Speed of tape: The average speed between each order fill
OrderFlow Bubble Tape
OrderFlow IQ also displays a traditional orderflow indicator, also known as OrderFlow Bubble Tape.
The image above shows the feature in action.
Orderflow Bubble Tape is a visual tool that shows recent market trades ("tape") as bubbles, where each bubble represents a trade.
The size of each bubble indicates the trade size (volume), and the color shows whether the trade was a buy (aggressive at the ask) or sell (aggressive at the bid).
Instead of showing trades as plain text (like a traditional tape), the bubble format makes it easier to spot bursts of aggressive buying or selling visually.
Clusters of large, fast bubbles in one color suggest momentum or imbalances in order flow, often signaling short-term price pressure.
Traders use Bubble Tape to quickly read supply/demand dynamics, identify hidden buyers/sellers (like iceberg orders), and anticipate short-term price moves.
Blue Bubble = Buy
Red Bubble = Sell
The larger the bubble, the larger the order. Traders can hover over each bubble with their cursor to see the exact size of the order.
Delta Class Lines
OrderFlow IQ shows Live Delta Class Lines grouped by order size buckets:
The blue line shows delta coming only from very large orders (100K–10B in size).
The red line shows delta coming from medium-large orders (50K–100K size).
The green line shows delta from small to medium orders (0–50K size).
Each line is the cumulative net delta for its class — meaning it is adding the buy and sell imbalances only from trades of that size class, live as trades occur.
For example, when a 30K-sized aggressive buy hits, it adds to the green line; if a 70K-sized sell hits, it subtracts from the red line.
The number next to each label is the current net delta value for that class, telling you whether buyers or sellers are dominating at that order size.
• Three Custom Dollar Brackets – Define “small,” “mid,” and “block” trade-size ranges (e.g., 0–50 K, 50 K–100 K, > 100 K).
• Live Streaming Lines – While a bar is forming, watch real-time totals for each bracket plotted as vertical columns or stair-step lines on the chart edge.
CVD
OrderFlow IQ also displays CVD as either candles or a line.
The image above shows the candles visualization for CVD. CVD can be calculated using tick data, 1-second bars, or 1-minute bars. The higher the granularity the more accurate the measurement.
More Features To Come
New features and calculations will be added to OrderFlow IQ based on community feedback, so feel free to share any requests you might have!
Summary
OrderFlow IQ brings a full suite of order-flow analytics into one Pine Script: footprints, delta analytics, dollar-bracket classes, adaptive profiles, bubble tapes, live feeds, CVD meters, and iceberg scans. Its unified Data Granularity switch and Preset System let you toggle entire dashboards with a click—scalpers, intraday traders, and long-term analysts alike can dial in the exact microstructure view they need without switching scripts. Publish once, share your preset layouts, and your TradingView community gains plug-and-play access to professional-grade order-flow tools—no extra installations or feeds required.
유료 스크립트

DeltaStrike — Aggressive Candle Detector by Chaitu50cDeltaStrike — Aggressive Candle Detector
by Chaitu50c
DeltaStrike is a simple and effective tool designed to help traders identify the most aggressive candles on the chart in real time. It works purely on price action and internal candle dynamics, with no reliance on lagging indicators.
The indicator combines delta (directional strength), candle range, and volume to compute an overall aggressiveness score for each candle. When this score exceeds a dynamic threshold based on recent market behavior, the candle is marked as an aggressive move.
Aggressive bullish candles are plotted as green diamonds below the candle, while aggressive bearish candles are plotted as red diamonds above the candle. The goal is to help traders visually spot moments of strong directional pressure, where potential trends or reversals may emerge.
The detection logic adapts automatically to changing market volatility and volume, making it suitable for all instruments and timeframes, including index futures, equities, and forex.
An integrated dashboard on the chart displays live readings of the key components contributing to each candle’s aggressiveness score: delta ratio, range ratio, and volume ratio. This helps traders understand the internal structure of each aggressive move.
Features:
Dynamic aggressiveness detection based on delta, range, and volume
Adaptive threshold for consistent behavior across timeframes and instruments
Clean chart output with clear diamond markers only on selected candles
Live dashboard with internal metrics for advanced analysis
Simple, lightweight, and optimized for intraday and swing trading
Works with any instrument: index, equity, forex, commodity
DeltaStrike is intended as an objective visual aid to help traders focus on genuine moments of strong market intent, filtering out ordinary or passive price movement. It can be used standalone or in combination with your existing trading strategy.

CVD Trend IndikatorCVD Trend Indicator (Cumulative Volume Delta)
This Pine Script indicator is designed to help traders visualize the underlying buying and selling pressure in the market by analyzing the Cumulative Volume Delta (CVD). It provides insights into whether buyers or sellers are more aggressive over time, aiding in trend confirmation and potential reversal identification.
How it Works:
The indicator calculates the Cumulative Volume Delta for each candlestick.
If the candle closes higher than it opened (close > open), its entire volume is considered buying volume (positive delta).
If the candle closes lower than it opened (close < open), its entire volume is considered selling volume (negative delta).
If the candle closes at the same price it opened (close == open), its delta is considered zero.
These individual candle deltas are then cumulatively summed up over time, creating the CVD line. A rising CVD indicates increasing buying pressure, while a falling CVD suggests growing selling pressure.
The indicator also features an optional Simple Moving Average (SMA) of the CVD, which helps smooth out the CVD line and identify the prevailing trend in buying/selling pressure more clearly.
Key Features:
Cumulative Volume Delta (CVD) Line:
Rising CVD (Blue Line): Indicates aggressive buying pressure is dominant, supporting bullish price action.
Falling CVD (Blue Line): Suggests aggressive selling pressure is dominant, supporting bearish price action.
CVD Moving Average (Red Line, optional):
A user-defined SMA of the CVD, which acts as a trend filter for the volume delta.
When the CVD crosses above its MA, it can signal increasing buying momentum.
When the CVD crosses below its MA, it can signal increasing selling momentum.
Session Reset:
The CVD automatically resets at the beginning of each new trading session (daily by default). This provides a fresh perspective on the day's accumulated buying or selling pressure, which is particularly useful for day traders.
Background Color Visuals:
The indicator panel's background changes color to visually represent periods of dominant buying pressure (green background when CVD > CVD MA) or selling pressure (red background when CVD < CVD MA), offering a quick glance at the market's underlying bias.
Trading Insights:
Trend Confirmation: Use a rising CVD (and its MA) to confirm an uptrend, or a falling CVD (and its MA) to confirm a downtrend.
Divergences: Look for CVD Divergences as potential reversal signals:
Bullish Divergence: Price makes a lower low, but CVD makes a higher low (suggests selling pressure is weakening).
Bearish Divergence: Price makes a higher high, but CVD makes a lower high (suggests buying pressure is weakening).
Momentum Shifts: Sudden, sharp changes in the CVD's direction or its cross over/under its MA can signal shifts in market momentum.
Support/Resistance Confirmation: Observe CVD behavior around key price levels. Weakening buying pressure at resistance or weakening selling pressure at support can confirm the strength of these levels.
Customization:
showMA: Toggle the visibility of the CVD's Moving Average.
maLength: Adjust the period for the CVD's Moving Average to control its sensitivity to recent price action. A shorter length makes it more reactive, while a longer length makes it smoother.
Disclaimer: No indicator is foolproof. Always use the CVD Trend Indicator in conjunction with other technical analysis tools, price action, and robust risk management strategies. Backtesting and forward testing are crucial for understanding its effectiveness in different market conditions and timeframes.

CVD Divergence & Volume ProfileThis Pine Script indicator, named "CVD Divergence & Volume Profile," is designed to identify potential trading opportunities by combining Cumulative Volume Delta (CVD) divergence with Volume Profile levels and an optional Simple Moving Average (SMA) trend filter. It plots signals directly on the price chart.
Here's a breakdown of what each component does and how to potentially trade with it:
1. Cumulative Volume Delta (CVD) Divergence
What it does: CVD measures the cumulative difference between buying and selling volume. A rising CVD indicates more buying pressure, while a falling CVD indicates more selling pressure. Divergence occurs when the price action contradicts the CVD's direction, suggesting a potential shift in momentum or trend reversal.
Bearish Divergence: The price makes a higher high, but the CVD makes a lower high (or fails to make a new high). This suggests that despite the price increasing, the underlying buying pressure is weakening.
Bullish Divergence: The price makes a lower low, but the CVD makes a higher low (or fails to make a new low). This suggests that despite the price decreasing, the underlying selling pressure is weakening.
Visualization:
Red triangle pointing down on the chart indicates a Bearish Divergence signal.
Green triangle pointing up on the chart indicates a Bullish Divergence signal.
2. Volume Profile Levels (VAH, VAL, POC)
What it does: The indicator calculates simplified Volume Profile levels over a user-defined vp_range (number of candles). These levels represent areas where significant trading activity has occurred:
VAH (Value Area High): The upper boundary of the "Value Area," where 70% of the volume traded.
VAL (Value Area Low): The lower boundary of the "Value Area," where 70% of the volume traded.
POC (Point of Control): The price level within the vp_range where the most volume was traded.
Significance: These levels often act as significant support and resistance zones.
Visualization:
Orange lines for VAH and VAL.
Yellow line for POC.
Zone Proximity (zone_thresh): The indicator only generates divergence signals if the current close price is within a specified percentage zone_thresh of either VAH, VAL, or POC. This filters signals to areas of high liquidity and potential turning points.
3. Trend Filter (SMA)
What it does: This is an optional filter (use_trend_filter) that uses a Simple Moving Average (sma_period, default 200).
Significance: It helps ensure that divergence signals are traded in alignment with the broader market trend, potentially increasing their reliability.
For long signals (bullish divergence), the price (close) must be above the SMA (indicating an uptrend).
For short signals (bearish divergence), the price (close) must be below the SMA (indicating a downtrend).
Visualization: A blue line on the chart representing the SMA.
How to Trade with It (Potential Strategies)
The indicator aims to provide high-probability entry points by combining multiple confirming factors. Here's how you might interpret and trade the signals:
Identify Divergence: Look for the triangle signals on your chart (red for bearish, green for bullish).
Confirm Proximity to Volume Profile Levels: The signal itself confirms that the price is near a significant Volume Profile level (VAH, VAL, or POC). These are areas where price often reacts.
Bullish Signal (Green Triangle): This suggests buying momentum is returning after a price decline, especially when the price is near VAL or POC, which might act as support.
Bearish Signal (Red Triangle): This suggests selling momentum is increasing after a price rally, especially when the price is near VAH or POC, which might act as resistance.
Check Trend Alignment (SMA Filter):
For a long trade: You would ideally want to see a green triangle (bullish divergence) while the price is above the blue SMA line. This indicates a bullish divergence confirming a potential bounce within an existing uptrend.
For a short trade: You would ideally want to see a red triangle (bearish divergence) while the price is below the blue SMA line. This indicates a bearish divergence confirming a potential rejection within an existing downtrend.
Entry and Exit Considerations:
Entry: Consider entering a trade on the candle where the signal appears, or on the subsequent candle for confirmation.
Stop Loss: For a long trade, a logical stop-loss could be placed below the lowest point of the divergence, or below the VAL/POC if the signal occurred near it. For a short trade, above the highest point of the divergence or VAH/POC.
Take Profit: Targets could be set at the opposite Volume Profile level, previous swing highs/lows, or using a fixed risk-reward ratio.
Example Trading Scenario:
Long Trade: You see a green triangle (bullish divergence) printed on the chart. You notice the price is currently at the VAL (orange line). You check the blue SMA line and confirm that the price is above it (uptrend). This confluence of factors (bullish divergence, support at VAL, and uptrend) provides a strong potential long entry signal. You might enter, place your stop loss just below VAL, and target VAH or the next resistance level.
Short Trade: You see a red triangle (bearish divergence). The price is at the VAH (orange line). The price is also below the blue SMA line (downtrend). This suggests a potential short entry. You might enter, place your stop loss just above VAH, and target VAL or the next support level.

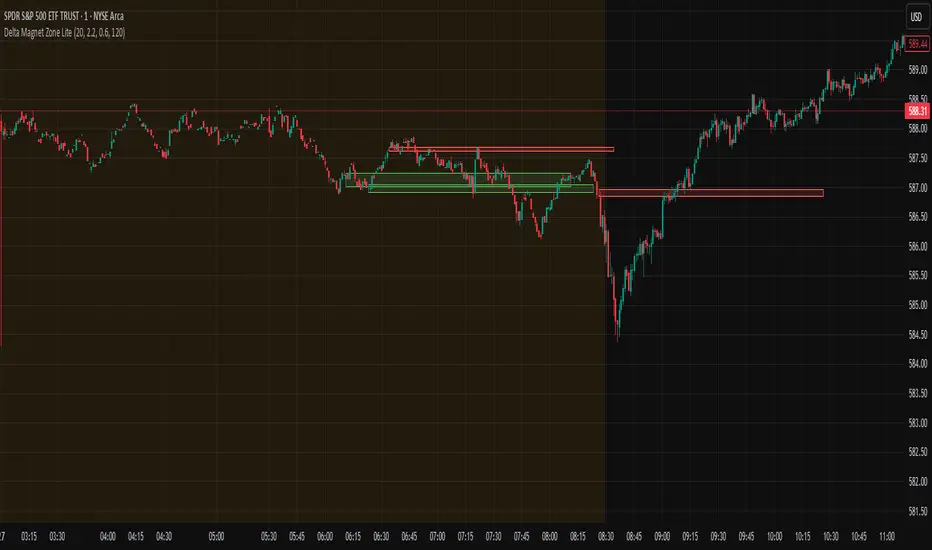
Delta Magnet Zone LiteDelta Magnet Zone Lite is exactly what it sounds like. It is areas where price cold potentially act as a magnet zone for price. Delta Magnet Zone Lite is a lightweight yet powerful visual tool that highlights potential liquidity traps and high-probability reversal zones based on volume spikes and wick imbalances. Designed for precision traders, this indicator visually marks key “magnet” zones where price may react, reverse, or consolidate due to prior aggressive buying or selling activity.
🔹 Core Logic:
Volume Spike Detection
Identifies candles with significantly higher volume than the moving average (customizable). These are likely areas of institutional interest or stop-hunt events.
Wick Ratio Analysis
Measures the size of the upper or lower wick relative to the total candle range. When combined with volume spikes, this helps detect:
Bullish Traps: Large lower wicks with strong buying volume
Bearish Traps: Large upper wicks with strong selling volume
Smart Zone Marking
When trap conditions are met, the script draws a semi-transparent colored box (green for bullish, red for bearish) that extends forward in time, highlighting a magnet zone—a price area likely to be retested or respected by future price action.
🛠 Customization Options:
Volume Spike Threshold
Adjust the multiplier for defining what qualifies as "high volume" relative to the average.
Wick Ratio Sensitivity
Fine-tune how extreme the wick size must be to qualify as a trap.
Zone Lifetime (Lookback)
Control how many bars each zone remains active on the chart.
Toggle Visibility
Turn bullish or bearish zones on/off independently for clean charting.
Ideal Use Cases:
Spotting hidden liquidity zones
Identifying exhaustion points in fast markets
Tracking institutional order imbalances
Enhancing confirmation for entry/exit signals
Whether you're trading intraday breakouts or swing-level reversals, Delta Magnet Zone Lite brings clarity to key reaction levels derived from raw price and volume behavior.
Project SynthIntroducing Project Synth !
Inspired by Pace of Tape and Cumulative Delta I created Project Synth in order to aggregate volume flow data across multiple marketsfor two primary reasions:
Traditional orderflow tools are not available on Tradingview. My script attempts to bring an original; calculus-based approach to creating not only an alternative for traditional orderflow tools, but also a more accurate one.
In order to detect genuine buying and selling pressure that cannot be easily manipulated. I did this because while I've always enjoyed concept behind both of those tools, I did not think they captured enough data to be useful. By analyzing assets that move together (positive correlation) and assets that move inversely (negative correlation), my system aims to fix the fundamental problems with those indicators and create an objective view of market sentiment based on aggregate orderflow.
Some more detailed explanations (using QQQ and SQQQ as an example):
Inverse Market Dynamics (QQQ vs SQQQ):
In an inverse market like SQQQ, aggressive buyers hit the ask when they expect the underlying (QQQ) to fall, while passive buyers wait on the bid hoping for cheaper inverse exposure. When QQQ rallies, SQQQ sees aggressive selling (people dumping their bearish bets) hitting bids, while passive sellers sit on the ask hoping to exit at better prices. The aggression flows opposite to the underlying market direction.
Why Utilizing Both Markets Provides A More Accurate Delta:
Watching both QQQ and SQQQ gives cross-validation - real buying pressure in QQQ should coincide with selling pressure in SQQQ. If you see buying in QQQ but also buying in SQQQ, that's a conflicting signal suggesting the move might be artificial or driven by other factors. The inverse relationship acts as a confirmation filter, making false signals much harder to generate.
Multiple Markets = Authentic Pressure:
The more unique, important markets you track, the harder it becomes to create fake delta moves. Real institutional buying/selling pressure affects multiple correlated assets simultaneously in predictable patterns - you can't easily manipulate tech stocks, treasury bonds, VIX, and currency pairs all at once to create a false signal. Each additional market acts as a fraud detection layer, ensuring the delta measurement reflects genuine ecosystem-wide buying and selling pressure rather than isolated manipulation or noise.
My Suggestions For Usage:
In order to keep the explanation simple and short for now, I suggest using it just like a cumulative delta indicator. For example: let's say you were watching CME_MINI:ES1! , and you had a resistance level at 6000. When the price reaches your resistance level, you would be looking for a significant divergence between price and Delta. Price : rising, Delta : falling. This means that even though the price was going up, strong and aggressive sellers are jumping in more and more, this can be used as a confirmation tool for a resistance level.
Notes For Moderators, Authors and Users:
Firstly, to the best of my knowledge, I have not been able to find many tools built around the concept of cumulative delta or pace of tape. While I know there are a couple projects, none to the magnitude of synthetically recreating these tools via an algorithm designed around basic calculus principles. While tools like Volume Delta are built in, they do not attempt to capture an accurate picture of aggregated orderflow from what I understand.
Secondly, it needs to be noted that tool aims to create an approximation of buying and selling pressure. To my knowledge it is not possible to create an accurate full picture, at least not within the limitations of Tradingview.

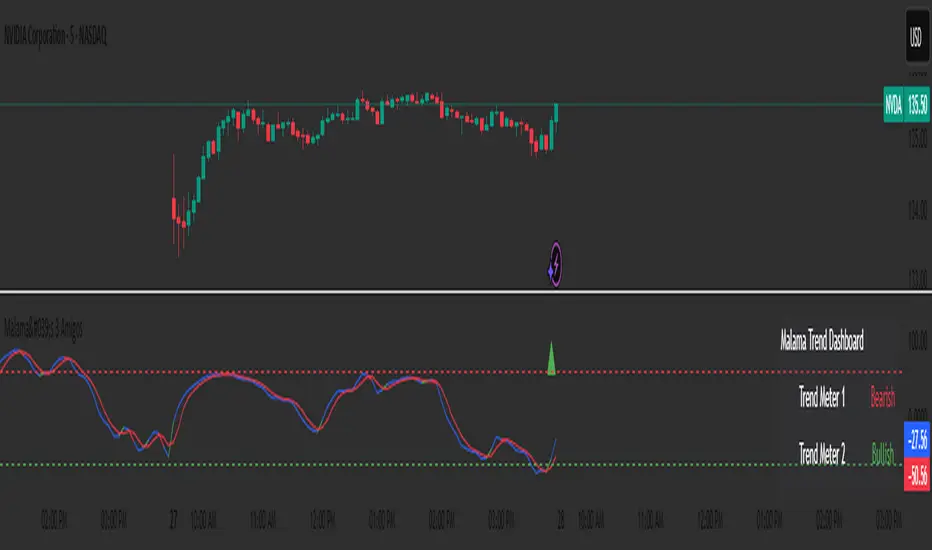
Malama's 3 AmigosThe "Malama's 3 Amigos" is an original script that combines several well-known technical indicators, including MACD, RSI, and wave trend analysis, to create a robust trading signal generator. The integration of these components allows for a more nuanced understanding of market dynamics:
MACD and RSI: These indicators provide insights into momentum and trend direction, helping to identify potential reversals or continuations.
Wave Trend Analysis: This component adds a layer of volatility assessment, allowing traders to gauge overbought and oversold conditions.
Volume Filtering: By incorporating volume analysis, the script ensures that signals are validated by market participation, reducing the likelihood of false signals.
This script stands out from public open-source alternatives by offering a unique combination of trend meters and wave trend analysis, tailored for traders seeking a comprehensive dashboard for market analysis.
Detailed Methodology ("How It Works")
Core Logic
Wave Trend Calculation: The script employs a wave trend calculation that utilizes exponential moving averages (EMAs) to assess price momentum. The wave trend indicator generates two lines, which are used to identify potential bullish and bearish conditions based on crossovers and overbought/oversold levels.
Trend Meter Signals: The script features three customizable trend meters that can be set to various configurations (e.g., MACD crossovers, RSI conditions). Each trend meter evaluates market conditions and provides a bullish or bearish signal based on the selected method.
Signal Generation:
Long Entry Signal: A long signal is generated when all three trend meters indicate bullish conditions, the wave trend shows a bullish crossover, the RSI delta is above a specified threshold, and the price is above a defined moving average.
Short Entry Signal: Conversely, a short signal is triggered when all trend meters indicate bearish conditions, the wave trend shows a bearish crossover, the RSI delta is below a specified threshold, and the price is below a defined moving average.
Signal Strength Calculation: The script calculates the strength of the generated signals by summing the number of bullish or bearish conditions met. This provides traders with a clear indication of the reliability of the signal.
Backtesting and Probability Features
The script does not include built-in backtesting features; however, traders can manually backtest the signals generated by the indicator. It is recommended to consider realistic trading conditions, including commission, slippage, and risk management parameters, when evaluating the effectiveness of the signals.
Strategy Results and Risk Management
The "Malama's 3 Amigos" indicator does not inherently include backtesting capabilities, but traders are encouraged to apply the following assumptions for effective risk management:
Commission and Slippage: Traders should account for realistic trading costs when evaluating performance.
Account Sizing: It is advisable to limit risk to 5-10% of equity per trade.
Trade Frequency: A sufficient number of trades should be executed to validate the strategy's effectiveness.
Default Settings
The default settings are designed to provide a balanced approach to trading. Traders can customize parameters such as lookback periods for moving averages and volume filters to suit their trading style.
User Settings and Customization
The script includes several user-customizable inputs:
Trend Meter Selections: Traders can choose from various trend meter configurations to tailor the indicator to their preferences.
Volume Filter: Users can enable or disable volume filtering and set the lookback period for volume analysis.
RSI Delta Threshold: This parameter allows traders to define the sensitivity of the RSI delta condition for signal generation.
Moving Average Types and Lengths: Traders can select between Simple Moving Averages (SMA) and Exponential Moving Averages (EMA) and adjust their lengths.
These settings influence the behavior of the indicator and the signals generated, allowing for a personalized trading experience.
Visualizations and Chart Setup
The "Malama's 3 Amigos" indicator plots several key elements on the chart:
Wave Trend Lines: Two wave trend lines are displayed, with color coding to indicate bullish (green) and bearish (red) conditions.
Signal Markers: Buy (green triangle) and sell (red triangle) signals are plotted on the chart to indicate potential entry points.
Info Panel: An information panel can be displayed on the chart, providing real-time updates on the status of trend meters, wave trend conditions, and entry signals.
The visual elements are designed to be clear and concise, ensuring that traders can quickly interpret the information presented.
Bullish Volume AnomalyAnomaly is designed to spot hidden bullish accumulation before price actually breaks out, by blending a trend-aware volume measure with a volatility-adjusted price channel. Here’s how it works:
First, it runs a simple ATR-based zigzag to identify the current swing direction. Volume is then signed (+ for up-trends, – for down-trends) and cumulatively summed. By converting that cumulative signed volume into a z-score over the past 480 bars, we get a sense of when buying or selling pressure is unusually strong relative to its own history.
At the same time, price itself is normalized into a z-score over the same 480-bar window, and its change over that period is also tracked. These two measures—volume z-score (s) and price z-score (p)—are compared, and the indicator looks for moments when s outpaces p by at least two standard deviations (s – p > 2), while price momentum change remains low (c < 1) and the net volume is positive (s > 0). That combination flags instances where heavy buying is taking place but price hasn’t yet reacted.
To define a dynamic trading zone, it plots a 288-bar EMA of price as the middle band (t2), and builds upper and lower bands around it using the average close-to-open range multiplied by a user-set factor. The lower band (t1) sits beneath the EMA by that volatility-based margin. A signal fires only when the bar’s high stays below t1—meaning price is still “sleeping” under the lower volatility boundary even as bullish volume builds up.
Together, these filters home in on anomalies: strong, trend-aligned volume surges that outstrip price movement, occurring while price sits below its lower volatility band. In practice, that often marks early accumulation before a breakout. You can tweak the ATR length and multiplier for the zigzag, as well as the channel period and range factor, to suit different markets or timeframes.

Footprint BoxesThe Footprint Boxes indicator takes each higher-timeframe candle and builds a mini “footprint” map of where buying and selling happened within that bar’s range. You choose how many price bins to split the candle into and which lower timeframe to sample. For each small interval it grabs the signed volume (positive when the close is above the open, negative when below) and distributes that volume evenly across every bin touched by the price move in that interval.
Once the bar closes , the script finds the true high and low of all the lower-timeframe candles that make up the parent bar, divides that span into your chosen number of bins, and sums up the signed volume in each bin. It then draws a row of colored boxes beside the bar: green-tinted boxes for net buying and red-tinted ones for net selling, with shade intensity proportional to the percentage of total volume in that bin . Each box is labeled with its percentage of the bar’s total volume delta.
Finally, it draws one extra box with a bold white border showing the bar’s overall delta (net buying minus selling) as an absolute number. This gives you both a granular view of intra-bar activity and a quick glance at whether the buyers or sellers dominated the entire candle.

Trailing Cumulative Volume DeltaShort Description:
A dynamic volume delta indicator that calculates a trailing sum of net buying/selling pressure over a user-defined number of recent bars, offering a more adaptive view of order flow momentum compared to fixed-anchor CVD.
Overview:
The Trailing Cumulative Volume Delta (TCVD) indicator provides a powerful way to analyze market sentiment by tracking the net difference between buying and selling volume. Unlike traditional Cumulative Volume Delta (CVD) indicators that typically reset at fixed intervals (e.g., daily, weekly), the TCVD calculates a rolling sum of volume delta over a specified number of recent bars. This "trailing" approach offers a more fluid and responsive measure of recent order flow dynamics.
How it Works:
Per-Bar Delta Calculation: For each bar on your chart, the indicator first calculates the net Volume Delta. This is done by looking at a finer, user-configurable Lower Timeframe (e.g., 1-minute data for a 15-minute chart bar) to determine the aggressive buying vs. selling volume within that bar.
Trailing Sum: The indicator then sums these individual per-bar net deltas over a user-defined Trailing Bars lookback period. For example, if "Trailing Bars" is set to 20, the TCVD value will represent the cumulative net delta of the last 20 bars.
Visualization:
The TCVD is plotted in a "MACD-Columns-Style" in a separate pane.
Teal: When the TCVD value is increasing (suggesting growing net buying pressure or diminishing net selling pressure over the trailing period).
Red: When the TCVD value is decreasing (suggesting growing net selling pressure or diminishing net buying pressure over the trailing period).
White: When it is returning to the mean.
How to Interpret and Use TCVD:
Trend Strength & Momentum:
A rising TCVD suggests that, on average over the trailing period, buying pressure is dominant or strengthening. This can confirm bullish price action or indicate underlying strength.
A falling TCVD suggests that selling pressure is dominant or strengthening, potentially confirming bearish price action or indicating weakness.
Divergences:
Unlike other Divergences, the CVD has two different types of Divergences: a) Absorption and b) Exhaustion. You only want to trade the Absorption pattern.
Zero Line Crossovers:
TCVD crossing above the zero line can indicate a shift towards net positive buying pressure over the lookback period.
TCVD crossing below the zero line can indicate a shift towards net positive selling pressure.
Confirmation: Use TCVD to confirm breakouts or breakdowns. A price breakout accompanied by a strongly rising TCVD is generally more reliable.
Key Settings:
Trailing Bars: (Default: 10)
Determines the number of recent bars to include in the cumulative delta sum.
Shorter periods make the TCVD more responsive to immediate changes.
Longer periods provide a smoother, longer-term view of order flow.
Use custom timeframe: (Checkbox, Default: false)
Allows you to override the automatic selection of the lower timeframe for delta calculation.
Timeframe for Delta Calculation: (Default: "1" - 1 minute)
Specifies the lower timeframe data used to calculate the volume delta for each individual chart bar.
Choosing a very fine timeframe (e.g., seconds) can provide high precision but may be limited by data availability or processing load.
If "Use custom timeframe" is unchecked, the script attempts to choose a sensible default based on your chart's timeframe (e.g., "1S" for second charts, "1" for intraday, "5" for daily, "60" for weekly+).
Examples:
Confirming Breakout Strength:
Price breaks out above a significant resistance level.
If the TCVD is also sharply rising and has perhaps crossed above its zero line, it provides confirmation that strong buying interest is fueling the breakout, increasing confidence in its validity.
Important Notes:
This indicator requires reliable volume data from your broker/data feed to function correctly. If your chart does not have volume, or if the volume data is unreliable, the TCVD will not be accurate.
Like all indicators, TCVD is best used as part of a comprehensive trading strategy, in conjunction with price action analysis and other indicators or tools.
Experiment with the Trailing Bars and Timeframe for Delta Calculation settings to find what best suits your trading style, the asset you are analyzing, and the chart timeframe you are using.
Feel free to modify this, add your personal touch, or include specific screenshots when you publish!

CVD Divergenz System – modular with Exchange + LabelsA smart volume-based strategy tool using CVD divergence, ATR-based risk management, and Open Interest filters — now with visual chart labels and exchange switching.
Designed for crypto traders who want precise entry signals, volume insight, and a clean UI.
🔍 Key Features:
✅ CVD Divergence Detection
Automatically detects bullish or bearish divergences between price and cumulative delta (CVD)
✅ Open Interest Logic (Simulated)
Signals are only valid when OI is rising – otherwise a warning is issued
✅ ATR-Based Entry, Stop & Target Zones
Auto-calculated based on your chosen R multiple (e.g., 1.5R), plotted in the chart
✅ Visual Dashboard Panel (table)
Compact panel with CVD, OI change, ATR, signal status, and selected exchange — always visible in top-right
✅ Exchange Selector + Fallback to Binance
Choose between Binance, Bybit, Bitget, or Coinbase — if data is unavailable, Binance is used automatically
✅ Modular Chart Labels
Optionally display 📈 LONG, 📉 SHORT or ⚠️ WARNING labels directly on the chart with a toggle
✅ Alerts Built-In
Get notified instantly when a setup triggers (long, short, or warning) — works with app, popup, or webhook
✅ Fully Modular Controls
Enable or disable the dashboard, trade zones, and labels via simple checkboxes
⚠️ Technical Notes:
CVD is calculated from delta volume (volume * sign(close - open)) — not true order flow
Open Interest is simulated using volume as a placeholder (due to Pine Script limitations)
Best suited for 5–30min timeframes on crypto futures pairs like BTCUSDT, ETHUSDT, etc.
💡 Pro Tips:
Use near key support/resistance zones or liquidity levels
Combine with price action and higher timeframe confluence
Alerts work best with "Once Per Bar Close" trigger setting
📈 Built to support faster decisions, cleaner setups, and institutional-level insights — all in one tool.

TrueDelta Candles📖 Description:
TrueDelta Candles is a precision tool for traders who want deeper insight into market sentiment through real-time volume delta analysis. Rather than using traditional volume bars, this indicator colors each chart candle based on the net volume delta—the difference between buying and selling volume—fetched from a lower timeframe.
🚀 Key Features:
🎯 Real Candle Coloring: Colors actual price candles based on delta volume—green (buying pressure), red (selling pressure).
⏱️ Multi-Timeframe Volume Analysis: Automatically selects the appropriate lower timeframe for better delta approximation, or lets you set a custom one.
🔬 Order Flow Insight: Visualizes the tug-of-war between buyers and sellers within each candle.
⚡ Lightweight & Non-Intrusive: No clutter—just clean color overlays on your chart candles.
🔄 Live Updating: Responds instantly as new data arrives.
🧠 Ideal For:
Intraday and scalping strategies.
Momentum and breakout traders.
Order flow enthusiasts looking for a visual edge.
🛠️ How It Works:
Behind the scenes, the script uses ta.requestVolumeDelta() to retrieve granular buy/sell volume data from a lower timeframe. The net delta volume then determines whether the candle is colored green (positive delta) or red (negative delta). This makes it easy to spot when market pressure aligns or diverges from price action.
⚙️ Settings:
Use Custom Timeframe: Manually select the lower timeframe used for delta calculation (e.g., "1", "5").
Default Auto Mode: Automatically adapts to your current chart resolution for optimal data balance.
If you're serious about understanding the real dynamics behind every candle, TrueDelta Candles adds an essential layer of volume-based context that price alone can't offer.

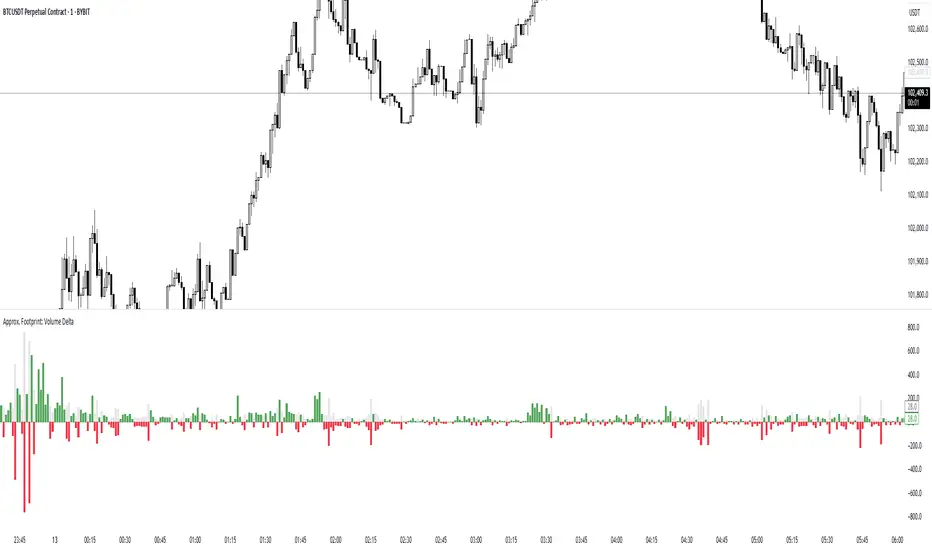
Approx. Footprint: Volume DeltaThis indicator brings you a simplified “footprint” view by charting the volume delta—the imbalance between bullish and bearish volume—alongside total bar volume.
Delta Bars: Green/red columns show where buyers (close > open) or sellers (close < open) dominated each bar.
Total Volume: Semi-transparent gray columns in the background give you overall context.
No Hidden Data: Works on any symbol/timeframe without tick-by-tick or bid/ask feeds.
Use it to quickly spot bars with strong buying or selling pressure, identify momentum shifts, and confirm breakouts or reversals—all within TradingView’s standard volume streams.
Multi-Layer Volume Profile [BigBeluga]A powerful multi-resolution volume analysis tool that stacks multiple profiles of historical trading activity to reveal true market structure.
This indicator breaks down total and delta volume distribution across time at four adjustable depths — enabling traders to spot major POCs, volume shelves, and zones of price acceptance or rejection with unmatched clarity.
🔵 KEY FEATURES
Multi-Layer Volume Profiles:
Up to 4 separate volume profiles are stacked on the chart:
- Profile 1: Full period
- Profile 2: Half-length
- Profile 3: Quarter-length
- Profile 4: One-eighth-length
This layering helps traders assess confluence across different time horizons.
Custom Bin Resolution:
Each profile uses a customizable number of bins to control visual precision.
More bins = higher granularity, fewer bins = smoother profile.
Precise POC Highlighting:
The price level with the maximum traded volume in each profile is highlighted with a thick blue POC line.
This key level shows the most accepted price for each period.
Total and Delta Volume Labels:
- Total Volume: Displays cumulative volume over the profile period at the top of the profile box.
- Delta Volume: The difference between bullish and bearish volume is labeled at the base, showing directional pressure.
Positive delta = buyer dominance, negative delta = seller dominance.
Range Levels:
Each profile includes horizontal reference lines showing its high, low, bounds.
These edges often align with price reaction zones and become future resistance/support.
🔵 HOW IT WORKS
For each active profile, the indicator:
- Collects price range (highs/lows) across the selected `length`
- Divides this range into equal bins
- Assigns volume into bins based on candle close location
- Aggregates volume per bin to form the profile (polylines)
Separately tracks:
- Total volume (sum of all candles in range)
- Delta volume (sum of candle volumes: positive for bullish, negative for bearish closes)
Highlights the bin with maximum volume (POC)
and marks it with a thick blue line.
Adds auxiliary lines for high/low of each profile box
and total/delta volume tags with tooltips.
🔵 USAGE
Spot Acceptance Zones:
Thick, flat areas on the profile show where price stayed longest — ideal for building positions.
Identify Rejection Zones:
Thin volume areas signal price rejection and are often used for stop placement or entries.
Delta Confirmation:
Use strong positive/negative delta readings as directional bias confirmation for breakout trades.
Confluence Detection:
Watch for overlapping POCs between layers to identify extremely strong support/resistance zones.
🔵 CONCLUSION
Multi-Layer Volume Profile equips traders with a deeply layered market structure view.
Whether you're scalping intraday levels or analyzing macro support zones, the ability to stack volume perspectives, visualize directional delta, and anchor POCs provides an edge in anticipating market moves.
Use this tool to validate entries, confirm structure, and make more informed, volume-aware trading decisions.

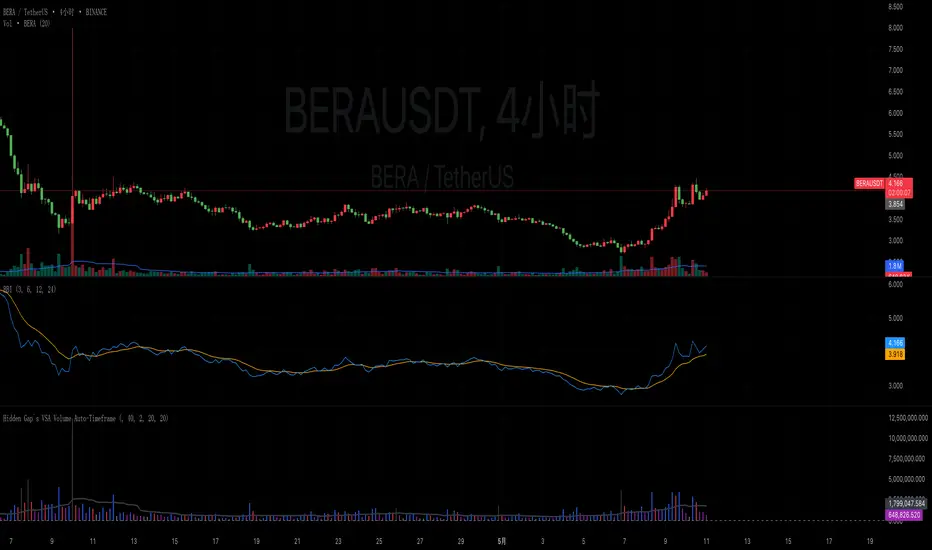
Hidden Gap`s VSA Volume Auto-TimeframeHidden Gap's VSA Volume with Auto-Timeframe Adaptation
Enhanced Version of Classic Volume Spread Analysis Indicator
Description:
This evolved version of the original "Hidden Gap's VSA Volume" indicator introduces intelligent timeframe adaptation while preserving its core Volume Spread Analysis (VSA) logic. The key enhancement automatically synchronizes volume calculations with your chart's current timeframe, eliminating manual resolution adjustments.
New Features:
✅ Auto-Timeframe Detection
Dynamically adjusts to any chart timeframe (1M/5M/1H/4H/D/W/M)
✅ Smart Resolution Switching
Seamlessly works across multiple timeframes without parameter changes
✅ Manual Override Option
Retains custom resolution input for multi-timeframe analysis (e.g., view weekly volume on daily charts)
✅ Modernized Engine
Upgraded to Pine Script v6 for optimal TradingView performance
Core Functionality Preserved:
• Multi-layer volume analysis using 40/20/2-period comparisons
• Color-coded histogram detecting:
Black: 40-period high volume
Gray: 20-period low volume
Purple: 2-period volume contraction
Blue/Red: Immediate volume changes
• Integrated 20-period SMA reference line
Usage Scenarios:
Intraday Trading: Auto-adjusts from 1-minute to 4-hour charts
Multi-Timeframe Analysis: Compare current volume against higher timeframe patterns
Swing Trading: Maintain consistent analysis across D/W/M timeframes
OFC - Position Clusters🧭 OFC – Position Clusters ATS-edition
Visualize where traders are positioning — and where they’re unwinding.
The OFC – Position Clusters indicator is a precision profiling tool for crypto markets, designed to highlight zones of potential position buildup and liquidation based on Open Interest Delta and a proportional model of Volume Delta.
This script reveals directional intent at key price levels by tracking where open interest and volume converge.
It offers an intuitive histogram-based view to expose:
📈 Long Open Clusters (green): zones where aggressive buying and new long positions dominate
📉 Short Open Clusters (red): areas of dominant short interest
📤 Long Close Clusters (purple): long-side liquidation zones
📥 Short Close Clusters (aqua): short unwinds or short squeeze exits
🔍 Use Cases: See the Story Behind the Price
🪤 Detect Trapped Traders: Spot clusters where aggressive longs/shorts built positions — only to have price reverse. These zones often lead to squeezes or forced exits.
📊 Identify Passive Accumulation: Long clusters near range lows (without price breakout) may signal stealth accumulation ahead of a move.
📈 Confirm Breakouts with Position Flow: Watch for open clusters shifting with price to validate directional conviction.
🧨 Fade Exhaustion Moves: Dense closing clusters into key resistance/support may signal end-of-move behavior or late chasers.
🛠 Key Features:
🕒 Time Window Control – Analyze any custom period, from minutes to weeks
📊 Histogram Resolution Selector – Choose your level of detail
🔄 Live vs Static Mode – Toggle real-time updates for intraday or historical reviews
📐 Profile Offset Slider – Shift the visualization away from price bars for clarity
🪲 Built-in Debug Panel – View parameters and time diagnostics in one place
Use this indicator to uncover market footprints left by large participants — not just where price moved, but how traders positioned within it.

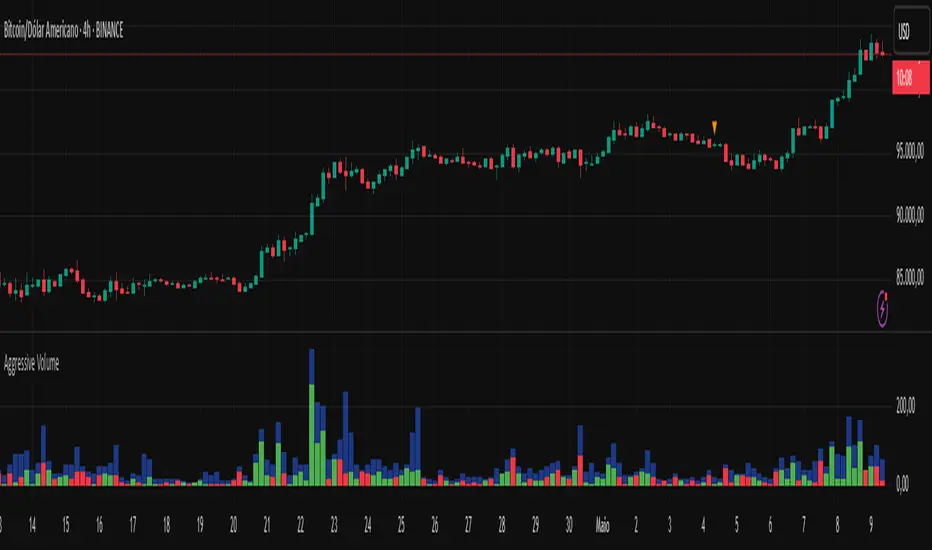
Aggressive Volume 📊 Indicator: Aggressive Volume – Simulated Buy/Sell Pressure
Aggressive Volume estimates delta volume using candle data to simulate the market’s internal buy/sell pressure. It helps visualize how aggressive buyers or sellers are moving the price without needing full order flow access.
⚙️ How It Works:
Calculates simulated delta volume based on candle direction and volume.
Bullish candles (close > open) suggest dominance by buyers.
Bearish candles (close < open) suggest dominance by sellers.
Delta is the difference between simulated buying and selling pressure.
🔍 Key Features:
Visual bars showing aggressive buyer vs seller dominance
Helps spot trend strength, momentum bursts, and potential reversals
Simple, effective, and compatible with any timeframe
Lightweight and ideal for scalping, day trading, and swing trading
💡 How to Use:
Look for strong positive delta during bullish trends for confirmation.
Watch for delta weakening or divergence as potential reversal signals.
Combine with trend indicators or price action for enhanced accuracy.
📊 Indicador: Volume Agressivo – Pressão de Compra/Venda Simulada
Volume Agressivo estima o delta de volume utilizando dados dos candles para simular a pressão interna de compra/venda do mercado. Ele ajuda a visualizar como os compradores ou vendedores agressivos estão movendo o preço, sem precisar de acesso completo ao fluxo de ordens.
⚙️ Como Funciona:
Calcula o delta de volume simulado com base na direção do candle e no volume.
Candles de alta (fechamento > abertura) indicam predominância de compradores.
Candles de baixa (fechamento < abertura) indicam predominância de vendedores.
O delta é a diferença entre a pressão de compra e venda simulada.
🔍 Principais Funcionalidades:
Barras visuais mostrando a dominância de compradores vs vendedores agressivos
Ajuda a identificar a força da tendência, explosões de momentum e possíveis reversões
Simples, eficaz e compatível com qualquer período de tempo
Leve e ideal para scalping, day trading e swing trading
💡 Como Usar:
Procure por delta positivo forte durante tendências de alta para confirmação.
Observe o delta enfraquecendo ou divergências como sinais de possível reversão.
Combine com indicadores de tendência ou price action para maior precisão.
Advanced Cumulative Delta & VolumeAdvanced Cumulative Delta & Volume (Heuristic-Based)
This offers a powerful cumulative delta visualization based on price action heuristics—perfect for traders without access to real bid/ask volume data.
Features
Cumulative Delta Calculation
Built using estimated delta (based on close position and volume).
Includes a moving average-based surge detection system.
Surge Detection
Highlights candles where delta exceeds a multiple of its average.
Detects sustained surges across multiple bars for trend confirmation.
Visual Enhancements
Smoothed line and area chart for delta flow
Alternate background shading (light blue) for each timeframe interval—great for visual structure (e.g., every 30 minutes).
Color-coded:
Yellow for bullish surges
Black for bearish surges
Green for positive delta /red for negative delta
Customizable Inputs
Timeframe (for resampling logic)
Surge thresholds
Delta moving average length
Volume weight adjustment
Sustained bar count
Ideal For:
Order flow enthusiasts without premium data feeds
Scalpers & intraday traders
Anyone wanting a visual edge on volume-driven moves

Radonezh Kir-Mary Beauty editionOverview
Dedicated to rev. Kirill and Mary of Radonezh.
This indicator uniquely combines Cumulative Volume Delta (CVD) and price momentum with dynamic normalization to identify trend strength, reversals, supported by a combination of more traditional signal logic. Unlike traditional momentum oscillators, it integrates volume dynamics and advanced directional index to filter false signals and adapts to market volatility through automated scaling, offering a holistic view of price-action reliability.
Core Innovations
Adapive Signals: Uses a proprietary correlation algorithm to weight momentum values, reducing noise in choppy markets.
Lower timeframe entry points: (currently 1 minute only) and HTF line statuses for timeframe synchronisation (currently only 15 minutes and 1 hour status) for super-precise entry points
Automatic drawing of resistance and support lines based on the proprietary algorithm for detecting volume/price synchronization and desynchronization levels.
"Victor-predictor": price chart pointing line that shows where the price supposedly goes based on the machine-learning simulation with pine script based on the main 3 traditional classical indicators. Works independently from the rest of the indicator. Developed by @Skorcez (same team).
Automatic recognition of possible long and short stop order placement levels. I do not filter them so use only within the general context of the indicator.
Key Features
Volume-Price Correlation: CVD reflects institutional order flow, while price momentum quantifies trend acceleration.
Auto-Scaling: Adjusts output range based on recent volatility (ATR), preventing overbought/oversold false positives.
Visual Alerts: Marks divergence zones with colored trendlines and labels (regular/hidden bullish/bearish).
Unique Value
By fusing volume delta dynamics with momentum filtering, this script addresses a critical gap in traditional indicators that treat price and volume in isolation. The closed-source logic focuses on institutional accumulation/distribution patterns, providing actionable signals without repainting.
Compatible with all assets and timeframes. No promotional content or external links included.
============================================
Trading strategy
============================================
Position Signals via DEMA Momentum Line Coloration
The main indicator line (orange/black) determines entry/exits based on its color intensity, which reflects trend strength and confirmation from filtered signals. Here's how it works:
Long Positions (Green/Teal)
Weak Long:
Dark Green = Price momentum rising without volume/Machine Learning (ML) confirmation.
Example: main line turns green but lacks volume spikes or ML buy signals.
Strong Long:
Bright Green = Momentum confirmed by:
Volume Surge: Volume exceeds 1.5x 20-period average.
ML Confirmation: ML score > 0.7 with price above EMA20.
Post-Drop Recovery: Price rebounds after a >1% drop on high volume. (not active as of now, will add a bit later, still working on it)
Short Positions (Red/Orange)
Weak Short:
Orange = Momentum declines without bearish confirmation.
Strong Short:
Bright Red = Confirmed by:
Volume Divergence: Rising price with falling CVD momentum.
ML Bearish: ML score > 0.7 + price below EMA20.
Overextension: RSI > 70 + price above upper Bollinger Band.
Neutral (Gray)
Flat Momentum:
Gray = Momentum near zero (±0.05) + low volatility (ATR < 1% of price).
Action: Avoid trades until color intensifies or stay in a position with a trailing stoploss until it's clear where the market goes (use HTF signal colour table to know what to expect).
Key Features
Adaptive Confirmation:
Colors brighten when signals align across:
Volume acceleration
RSI and a few other extremes (oversold/overbought)
Machine Learning predictions
Dynamic Risk Zones:
Gray areas highlight low-confidence periods, while bright colors mark high-probability entries.
Usage: Enter longs when the line turns bright green and exits when it fades to dark green/gray. Reverse for shorts. Combine with the built-in Victor-Predictor signals for optimal accuracy
============================================
Plans to add soon:
============================================
Dynamic Normalization: Scales CVD and price momentum to a fixed range (default: -20 to +20) using volatility-adjusted multipliers, ensuring consistent interpretation across assets/timeframes.
Divergence Detection: Flags discrepancies between volume-driven momentum (CVD) and price trends, highlighting potential reversals.
Adding 2 nearest psychological support and resistance levels.
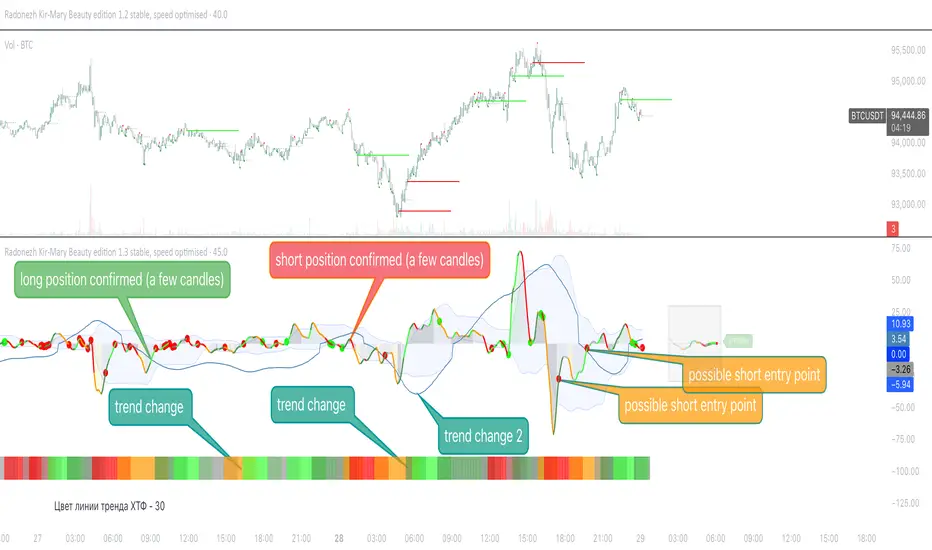
Puts vs Longs vs Price Oscillator SwiftEdgeWhat is this Indicator?
The "Low-Latency Puts vs Longs vs Price Oscillator" is a custom technical indicator built for TradingView to help traders visualize buying and selling activity in a market without access to order book data. It displays three lines in an oscillator below the price chart:
Green Line (Longs): Represents the strength of buying activity (bullish pressure).
Red Line (Puts): Represents the strength of selling activity (bearish pressure).
Yellow Line (Price): Shows the asset’s price in a scaled format for direct comparison.
The indicator uses price movements, volume, and momentum to estimate when buyers or sellers are active, providing a quick snapshot of market dynamics. It’s optimized for fast response to price changes (low latency), making it useful for both short-term and longer-term trading strategies.
How Does it Work?
Since TradingView doesn’t provide direct access to order book data (which shows real-time buy and sell orders), this indicator approximates buying and selling pressure using commonly available data: price, volume, and a momentum measure called Rate of Change (ROC). Here’s how it combines these elements:
Price Movement: The indicator checks if the price is rising or falling compared to the previous candlestick. A rising price suggests buying (longs), while a falling price suggests selling (puts).
Volume: Volume acts as a "weight" to measure the strength of these price moves. Higher volume during a price increase boosts the green line, while higher volume during a price decrease boosts the red line. This mimics how large orders in an order book would influence the market.
Rate of Change (ROC): ROC measures how fast the price is changing over a set period (e.g., 5 candlesticks). It adds a momentum filter—strong upward momentum reinforces buying signals, while strong downward momentum reinforces selling signals.
These components are calculated for each candlestick and summed over a short lookback period (e.g., 5 candlesticks) to create the green and red lines. The yellow line is simply the asset’s closing price scaled down to fit the oscillator’s range, allowing you to compare buying/selling strength directly with price action.
Why Combine These Elements?
The combination of price, volume, and ROC is intentional and synergistic:
Price alone isn’t enough—it tells you what happened but not how strong the move was.
Volume adds context by showing the intensity behind price changes, much like how order book volume indicates real buying or selling interest.
ROC ensures the indicator captures momentum, filtering out weak or random price moves and focusing on significant trends, similar to how aggressive order execution might appear in an order book.
Together, they create a balanced picture of market activity that’s more reliable than any single factor alone. The goal is to simulate the insights you’d get from an order book—where you’d see buy/sell imbalances—using data available in TradingView.
How to Use It
Setup:
Add the indicator to your chart via TradingView’s Pine Editor by copying and pasting the script.
Adjust the inputs to suit your trading style:
Lookback Period: Number of candlesticks (default 5) to sum buying/selling activity. Shorter = more responsive; longer = smoother.
Price Scale Factor: Scales the yellow price line (default 0.001). Increase for high-priced assets (e.g., 0.01 for indices like DAX) or decrease for low-priced ones (e.g., 0.0001 for crypto).
ROC Period: Candlesticks for momentum calculation (default 5). Shorter = faster response.
ROC Weight: How much momentum affects the signal (default 0.5). Higher = stronger momentum influence.
Volume Threshold: Minimum volume multiplier (default 1.5) to boost signals during high activity.
Reading the Oscillator:
Green Line Above Yellow: Strong buying pressure—price is rising with volume and momentum support. Consider this a bullish signal.
Red Line Above Yellow: Strong selling pressure—price is falling with volume and momentum support. Consider this a bearish signal.
Green/Red Crossovers: When the green line crosses above the red, it suggests buyers are taking control. When the red crosses above the green, sellers may be dominating.
Yellow Line Context: Compare green/red lines to the yellow price line to see if buying/selling strength aligns with price trends.
Trading Examples:
Bullish Setup: Green line spikes above yellow after a price breakout with high volume (e.g., DAX opening jump). Enter a long position if confirmed by other indicators.
Bearish Setup: Red line rises above yellow during a price drop with increasing volume. Look for a short opportunity.
Reversal Warning: If the green line stays high while price (yellow) flattens or drops, it could signal overbought conditions—be cautious.
What Makes It Unique?
Unlike traditional oscillators like RSI or MACD, which focus solely on price momentum or trends, this indicator blends price, volume, and momentum into a three-line system that mimics order book dynamics. Its low-latency design (short lookback and no heavy smoothing) makes it react quickly to market shifts, ideal for volatile markets like DAX or forex. The visual separation of buying (green) and selling (red) against price (yellow) offers a clear, intuitive way to spot imbalances without needing complex data.
Tips and Customization
Volatile Markets: Use a shorter lookback (e.g., 3) and ROC period (e.g., 3) for faster signals.
Stable Markets: Increase lookback (e.g., 10) for smoother, less noisy lines.
Scaling: If the green/red lines dwarf the yellow, adjust Price Scale Factor up (e.g., 0.01) to balance them.
Experiment: Test on your asset (stocks, crypto, indices) and tweak inputs to match its behavior.

Intraday Macro & Flow Indicator# IntraMacroFlow Indicator
## Introduction
IntraMacroFlow is a volume and delta-based indicator that identifies significant price movements within trading sessions. It generates signals when volume spikes coincide with quality price movement, filtered by RSI to avoid overbought/oversold conditions.
> **Note:** This indicator provides multiple signals and should be combined with additional analysis methods such as support/resistance, trend direction, and price action patterns.
## Inputs
### Volume Settings
* **Volume Lookback Period** (14) - Number of bars for volume moving average calculation
* **Volume Threshold Multiplier** (1.5) - Required volume increase over average to generate signals
* **Delta Threshold** (0.3) - Required close-to-open movement relative to bar range (higher = stronger movement)
### Session Configuration
* **Use Dynamic Session Detection** (true) - Automatically determine session times
* **Highlight Market Open Period** (true) - Highlight first third of trading session
* **Highlight Mid-Session Period** (true) - Highlight middle portion of trading session
* **Detect Signals Throughout Whole Session** (true) - Find signals in entire session
* **Session Time** ("0930-1600") - Trading hours in HHMM-HHMM format
* **Session Type** ("Regular") - Select Regular, Extended, or Custom session
### Manual Session Settings
Used when dynamic detection is disabled:
* **Manual Session Open Hour** (9)
* **Manual Session Open Minute** (30)
* **Manual Session Open Duration** (60)
* **Manual Mid-Session Start Hour** (12)
* **Manual Mid-Session End Hour** (14)
## How It Works
The indicator analyzes each bar using three primary conditions:
1. **Volume Condition**: Current volume > Average volume × Threshold
2. **Delta Condition**: |Close-Open|/Range > Delta threshold
3. **Time Condition**: Bar falls within configured session times
When all conditions are met:
* Bullish signals appear when close > open and RSI < 70
* Bearish signals appear when close < open and RSI > 30
## Display Elements
### Shapes and Colors
* Green triangles below bars - Bullish signals
* Red triangles above bars - Bearish signals
* Blue background - Market open period
* Purple background - Mid-session period
* Bar coloring - Green (bullish), Red (bearish), or unchanged
### Information Panel
A dynamic label shows:
* Current volume relative to average (Vol)
* Delta value for current bar (Delta)
* RSI value (RSI)
* Session status (Active/Closed)
## Calculation Method
```
// Volume Condition
volumeMA = ta.sma(volume, lookbackPeriod)
volumeCondition = volume > volumeMA * volumeThreshold
// Delta Calculation (price movement quality)
priceRange = high - low
delta = math.abs(close - open) / priceRange
deltaCondition = delta > deltaThreshold
// Direction and RSI Filter
bullishBias = close > open and entrySignal and not (rsi > 70)
bearishBias = close < open and entrySignal and not (rsi < 30)
```
## Usage Recommendations
### Suitable Markets
* Equities during regular trading hours
* Futures markets
* Forex during active sessions
* Cryptocurrencies with defined volume patterns
### Recommended Timeframes
* 1-minute to 1-hour (optimal: 5 or 15-minute)
### Parameter Adjustments
* For fewer but stronger signals: increase Volume Threshold (2.0+) and Delta Threshold (0.4-0.6)
* For more signals: decrease Volume Threshold (1.2-1.5) and Delta Threshold (0.2-0.3)
### Usage Tips
* Combine with trend analysis for higher-probability entries
* Focus on signals occurring at session boundaries and mid-session
* Use opposite signals as potential exit points
* Configure alerts to receive notifications when signals occur
## Additional Notes
* RSI parameters are fixed at 14 periods with 70/30 thresholds
* The indicator handles overnight sessions correctly
* Fully compatible with TradingView alerts
* Customizable visual elements
## Release Notes
Initial release: This is a template indicator that should be customized to suit your specific trading strategies and preferences.
