Sharpe Ratio [Alpha Extract]A sophisticated risk-adjusted return measurement system that calculates annualized Sharpe Ratio with dynamic color-coded visualization distinguishing return quality across positive and negative performance regimes. Utilizing rolling period calculations with smoothed moving average comparison, this indicator delivers institutional-grade performance assessment with overbought/oversold threshold detection for extreme risk-adjusted return conditions. The system's four-tier color classification combined with histogram fills and background highlighting provides comprehensive visual feedback on whether current returns justify their volatility risk across varying market cycles.
🔶 Advanced Sharpe Ratio Calculation Engine
Implements classic Sharpe Ratio methodology measuring mean daily return divided by return standard deviation with annualization factor for consistent interpretation. The system calculates daily percentage returns, computes rolling mean and standard deviation over configurable periods, applies square root of 365 scaling for annualized comparison, and generates unbounded ratio values where higher positive readings indicate superior risk-adjusted performance.
// Core Sharpe Ratio Framework
Daily_Return = close / close - 1
Mean_Return = ta.sma(Daily_Return, Period)
StdDev_Return = ta.stdev(Daily_Return, Period)
Sharpe_Ratio = (Mean_Return / StdDev_Return) * sqrt(365)
🔶 Dynamic Four-Tier Color Classification
Features sophisticated color logic distinguishing between strong positive returns (green), weakening positive returns (yellow), weakening negative returns (orange), and strong negative returns (red) based on relationship to smoothed average. The system compares current Sharpe against SMA-smoothed baseline, applying green when positive and accelerating, yellow when positive but decelerating, orange when negative but improving, and red when negative and deteriorating for nuanced regime assessment.
🔶 Smoothed Baseline Comparison Framework
Implements SMA smoothing of Sharpe Ratio with configurable period to establish momentum reference line for trend determination within risk-adjusted returns. The system calculates simple moving average of raw Sharpe values, uses this smoothed line as directional benchmark, and determines whether current risk-adjusted performance is strengthening or weakening relative to recent average for color classification logic.
🔶 Extreme Threshold Detection System
Provides overbought and oversold level identification with configurable upper and lower bounds marking exceptional risk-adjusted return extremes. The system defaults to +4.3 for overbought threshold (extremely favorable risk-return profile) and -2.3 for oversold threshold (severely unfavorable risk-return profile), applying dashed horizontal reference lines and background highlighting when Sharpe breaches these statistical extremes requiring attention.
🔶 Histogram Fill Visualization Architecture
Creates gradient-filled histogram between Sharpe Ratio line and zero baseline using dynamic color matching with 30% transparency for intuitive positive/negative return distinction. The system fills area above zero with bullish colors (green/yellow) and below zero with bearish colors (orange/red), providing immediate visual confirmation of whether returns are compensating for volatility risk or destroying risk-adjusted value.
🔶 Background Zone Highlighting Framework
Implements subtle background coloring when Sharpe enters extreme overbought or oversold zones, alerting traders to statistically significant risk-adjusted return conditions. The system applies semi-transparent red background when ratio exceeds +4.3 (exceptionally strong risk-adjusted returns potentially unsustainable) and green background when below -2.3 (severely poor risk-adjusted returns potentially reversionary), creating visual alerts without obscuring price action.
🔶 Annualization Methodology Integration
Utilizes standard square root of time scaling (sqrt(365)) to convert rolling period Sharpe calculations into annualized format for cross-temporal comparison. The system applies this mathematical transformation ensuring Sharpe values represent expected annual risk-adjusted returns regardless of calculation period length, enabling consistent interpretation whether using 100-day or 200-day rolling windows.
🔶 Zero-Line Reference System
Provides critical zero-line plot serving as boundary between positive risk-adjusted returns (capital allocation justified by return/risk profile) and negative risk-adjusted returns (strategy destroying value on risk-adjusted basis). The system emphasizes this threshold as decision point where values above zero suggest continuation while values below zero indicate reconsideration of exposure.
🔶 Momentum-Based Color
Transitions Implements intelligent color switching logic that considers both absolute Sharpe value and its momentum relative to smoothed average, creating four distinct regimes for granular performance assessment. The system enables identification of bullish acceleration (green), bullish deceleration (yellow), bearish improvement (orange), and bearish acceleration (red) for nuanced position management beyond simple positive/negative classification.
🔶 Configurable Period Optimization
Features adjustable calculation period and smoothing length enabling optimization across different trading timeframes and volatility regimes. The system defaults to 150-period calculation (approximately 6-7 months of daily data) with 30-period smoothing, but allows customization from short-term tactical assessment to long-term strategic evaluation based on investment horizon and strategy requirements.
🔶 Performance Optimization Framework
Employs efficient rolling calculations with streamlined daily return processing and optimized standard deviation computation for smooth real-time updates. The system includes minimal computational overhead through single-pass mean and variance calculations, enabling consistent performance across extended historical periods while maintaining accuracy of risk-adjusted return measurements.
This indicator delivers sophisticated risk-adjusted return analysis through classic Sharpe Ratio methodology with enhanced visual classification distinguishing return quality and momentum. Unlike simple return-focused indicators, Sharpe Ratio penalizes volatility ensuring traders evaluate whether returns justify the risk undertaken. The system's four-tier color coding, smoothed baseline comparison, and extreme threshold detection make it essential for portfolio managers and systematic traders seeking objective performance assessment beyond raw price gains. High positive Sharpe values indicate efficient return generation relative to volatility risk, while negative values signal value destruction on risk-adjusted basis requiring strategy reassessment. The indicator excels at identifying periods when risk-taking is rewarded (green zones) versus periods when volatility exceeds returns (red zones) across cryptocurrency, forex, and equity markets for optimal capital allocation decisions.
Volatilityadjusted

Dynamic RSI Mean Reversion StrategyDynamic RSI Mean Reversion Strategy
Overview:
This strategy uses an RSI with ATR-Adjusted OB/OS levels in order to enhance the quality of it's mean reversion trades. It also incorporates a form of trend filtering in an effort to minimize downside and maximize upside. The backtest has fewer trades, as it uses substantial filtering to enhance trade quality. As you can see, I didn't cherry pick the results, so the results aren't the most beautiful thing you'll see in your life. I did this to ensure nobody gets misled. If you need a higher frequency of trades, consider removing the trend filter or increasing the length of the EMAs used for trend detection.
Features:
Dynamic OB/OS Levels: Uses ATR to adjust overbought and oversold thresholds dynamically, making the RSI more responsive in varying volatility conditions. This approach enhances signal strength by expanding the RSI range in high volatility and tightening it in low volatility.
Mean Reversion Focus: Designed for mean reversion but incorporates a trend-following filter to reduce countertrend trades. When the RSI is high, it often indicates an uptrend, so a trend filter prevents shorting in these cases and the same goes for downtrends and longing.
Trend Filtering: A moving average cross trend filter checks for the trend direction, with the RSI signal line color-coded to reflect trend shifts. Entries occur when the RSI crosses above or below the dynamic thresholds and is not a countertrend trade.
Stop Losses: Stop losses are set based on ATR distance from the entry price, providing volatility-adjusted protection.
Note:
If you're using this strategy on assets with a higher price, remember to increase the initial capital in the strategy settings. Otherwise, the strategy won't generate any (or many) trades and you'll end up with some inaccurate results.
Recommended Use:
Test it on different assets and timeframes. I’ve found the best results with standard RSI inputs, a relatively slow ATR, and a slower MA cross for trend filtering. Thus, the defaults are set that way. If the trend metrics are too slow, you’ll filter out too many good trades while allowing crummy ones; if too fast, most trades may be filtered out. As always, this has a lot of configurability so experiment to find the balance that works for your trading style.

ATR Adjusted RSIATR Adjusted RSI Indicator
By Nathan Farmer
The ATR Adjusted RSI Indicator is a versatile indicator designed primarily for trend-following strategies, while also offering configurations for overbought/oversold (OB/OS) signals, making it suitable for mean-reversion setups. This tool combines the classic Relative Strength Index (RSI) with a unique Average True Range (ATR)-based smoothing mechanism, allowing traders to adjust their RSI signals according to market volatility for more reliable entries and exits.
Key Features:
ATR Weighted RSI:
At the core of this indicator is the ATR-adjusted RSI line, where the RSI is smoothed based on volatility (measured by the ATR). When volatility increases, the smoothing effect intensifies, resulting in a more stable and reliable RSI reading. This makes the indicator more responsive to market conditions, which is especially useful in trend-following systems.
Multiple Signal Types:
This indicator offers a variety of signal-generation methods, adaptable to different market environments and trading preferences:
RSI MA Crossovers: Generates signals when the RSI crosses above or below its moving average, with the flexibility to choose between different moving average types (SMA, EMA, WMA, etc.).
Midline Crossovers: Provides trend confirmation when either the RSI or its moving average crosses the 50 midline, signaling potential trend reversals.
ATR-Inversely Weighted RSI Variations: Uses the smoothed, ATR-adjusted RSI for a more refined and responsive trend-following signal. There are variations both for the MA crossover and the midline crossover.
Overbought/Oversold Conditions: Ideal for mean reversion setups, where signals are triggered when the RSI or its moving average crosses over overbought or oversold levels.
Flexible Customization:
With a wide range of customizable options, you can tailor the indicator to fit your personal trading style. Choose from various moving average types for the RSI, modify the ATR smoothing length, and adjust overbought/oversold levels to optimize your signals.
Usage:
While this indicator is primarily designed for trend-following, its OB/OS configurations make it highly effective for mean-reverting setups as well. Depending on your selected signal type, the relevant indicator line will change color between green and red to visually signal long or short opportunities. This flexibility allows traders to switch between trending and sideways market strategies seamlessly.
A Versatile Tool:
The ATR Adjusted RSI Indicator is a valuable component of any trading system, offering enhanced signals that adapt to market volatility. However, it is not recommended to rely on this indicator alone, especially without thorough backtesting. Its performance varies across different assets and timeframes, so it’s essential to experiment with the parameters to ensure consistent results before applying it in live trading.
Recommendation:
Before incorporating this indicator into live trading, backtest it extensively. Given its flexibility and wide range of signal-generation methods, backtesting allows you to optimize the settings for your preferred assets and timeframes. Only consider using it on it's own if you are confident in its performance based on your own backtest results, and even then, it is not recommended.

[-_-] Volatility Calibrated ATRDescription:
An indicator based on ATR adjusted for volatility of the market. It uses Heikin Ashi data to find short and long opportunities and displays a dynamic stop loss level. Additionally, it has alerts for when the trend changes (which is an entry signal).
How it works:
It works by dynamically calculating the Period for ATR which depends on current volatility level that is calculated by a function that uses Standard Deviation of price. ATR is then smoothed by Weighted Moving Average and multiplied by ATR Factor, resulting in a plot that changes its colour to red when we're in a downtrend and green when in an uptrend. This plot should be used as a dynamic Stop Loss level. Trend change is determined by price crossing the dynamic Stop Loss level. The squared red and green labels appear when the trend changes, and should be used as Entry signals.
Parameters:
- Source -> data used for calculations
- ATR Factor -> higher values produce less noise and longer trends, lower values give more signals

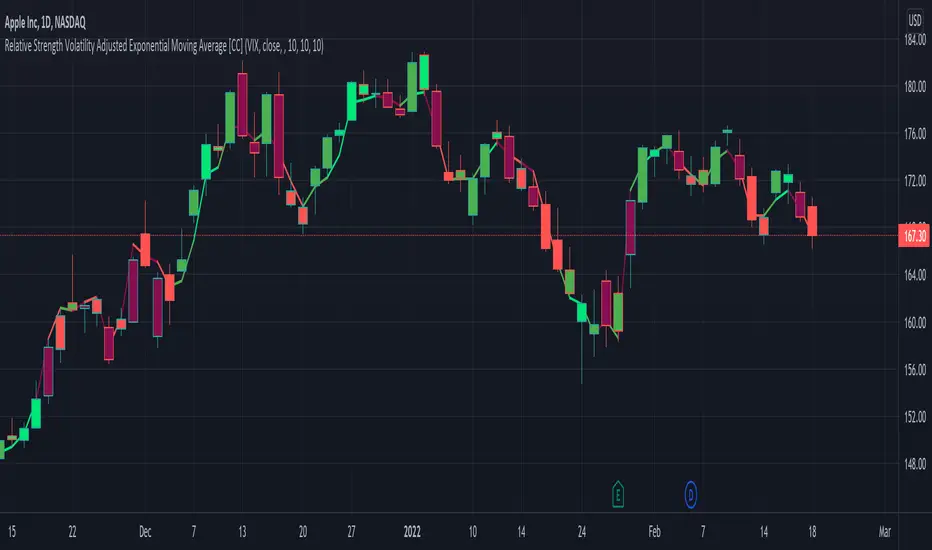
Relative Strength Volatility Adjusted Ema [CC]The Relative Strength Volatility Adjusted Exponential Moving Average was created by Vitali Apirine (Stocks and Commodities Mar 2022) and this is his final indicator of his recent Relative Strength series. I published both of the previous indicators, Relative Strength Volume Adjusted Exponential Moving Average and Relative Strength Exponential Moving Average
This indicator is particularly unique because it uses the Volatility Index (VIX) symbol as the default to determine volatility and uses this in place of the current stock's price into a typical relative strength calculation. As you can see in the chart, it follows the price much closer than the other two indicators and so of course this means that this indicator is best for choppy markets and the other two are better for trending markets. I would of course recommend to experiment with this one and see what works best for you.
I have included strong buy and sell signals in addition to normal ones so strong signals are darker in color and normal signals are lighter in color. Buy when the line turns green and sell when it turns red.
Let me know if there are any other indicators or scripts you would like to see me publish!
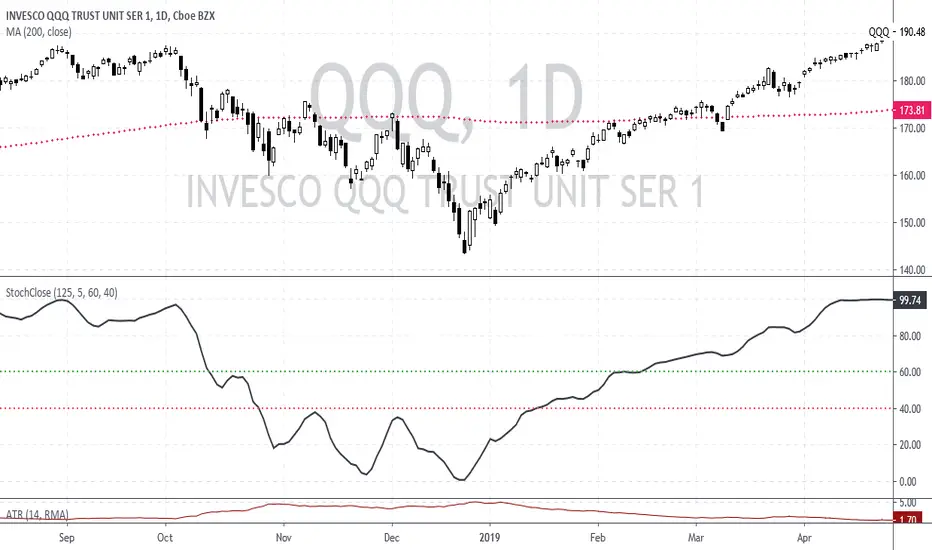
Stochastic based on Closing Prices - Identify and Rank TrendsStochClose is a trend indicator that can be used on its own to measure trend strength, in a scan to rank a group of securities according to trend strength or as part of a trend following strategy. Moreover, it acts as a volatility-adjusted trend indicator that puts securities on an equal footing.
StochClose measures the location of the current close relative to the close-only high-low range over a given period of time. In contrast to the traditional Stochastic Oscillator, this indicator only uses closing prices. Traditional Stochastic uses intraday highs and lows to calculate the range. The focus on closing prices reduces signal noise caused by intraday highs and lows, and filters out errant or irrationally exuberant price spikes.
Here are some examples when the high or low was out of proportion and suspect. Perhaps most famously, there were errant spike lows in dozens of ETFs in August 2015 (XLK, IJR, ITB). There were other spikes in VMBS (October 2014), IJR (October 2008) and KRE (May 2011). Elsewhere, there were suspicious spikes in IEI (April 2020), CHD (March 2020), CCRN (March 2020) and FNB (March 2020)
The preferred setting to identify medium and long-term uptrends is 125 days with 5 days smoothing. 125 days covers around six months. Thus, StochClose(125,5) is a 5-day SMA of the 125-day Stochastic based on closing prices. Smoothing with the 5-day SMA introduces a little lag, but reduces whipsaws and signal noise.
StochClose fluctuates between 0 and 100 with 50 as the midpoint. Values above 80 indicate that the current price is near the high end of the 125-day range, while values below 20 indicate that price is near the low end of the range. For signals, a move above 60 puts the indicator firmly in the top half of the range and points to an uptrend. A move below 40 puts the indicator firmly in the bottom half of the range and points to a downtrend.
StochClose values can also be ranked to separate the leaders from the laggards. In contrast to Rate-of-Change and Percentage Above/Below a Moving Average, StochClose acts as a volatility-adjusted indicator that can identify trend strength or weakness. The Consumer Staples SPDR is unlikely to win in a Rate-of-Change contest with the Technology SPDR. However, it is just as easy for the Consumer Staples SPDR to get in the top of its range as it is for the Technology SPDR. StochClose puts securities on an equal footing.
StochClose measures trend direction and trend strength with one number. The indicator value tells us immediately if the security is trending higher or lower. Furthermore, we can compare this value against the values for other securities. Securities with higher StochClose values are stronger than those with lower values.