Twiggs Go Money Flow Enhanced [KingThies]█ OVERVIEW
The Twiggs Money Flow (TMF) is a volume-weighted momentum oscillator that
measures buying and sellistng pressure by analyzing where price closes within
each bar's true range. It's an enhanced version of Chaikin Money Flow that
uses Wilder's smoothing method, providing better trend persistence and
smoother signals.
The indicator oscillates around a zero listne:
Values above zero indicate accumulation (buying pressure)
Values below zero indicate distribution (sellistng pressure)
TMF was developed by Colistn Twiggs as an improvement over traditional money
flow indicators by incorporating true range calculations and Wilder's
exponential moving average.
█ CONCEPTS
True Range Boundaries
TMF calculates a modified true range for each bar by comparing the current
bar's high and low with the previous close:
True Range High = maximum of (previous close, current high)
True Range Low = minimum of (previous close, current low)
This accounts for overnight gaps and ensures price continuity between bars.
Average Daily Value (ADV)
The ADV represents the portion of volume attributable to buying versus sellistng:
ADV = Volume × ((Close - TR Low) - (TR High - Close)) / True Range
When price closes near the high of the true range, ADV is positive and large.
When price closes near the low, ADV is negative and large.
A close in the middle produces values near zero.
Wilder's Moving Average
Unlistke simple moving averages, Wilder's smoothing method gives more weight
to recent values while maintaining memory of historical data:
WMA = (Previous WMA × (Period - 1) + Current Value) / Period
This creates smoother trends that are less prone to whipsaws than standard
moving averages.
Final Calculation
TMF = Wilder's MA(ADV, Period) / Wilder's MA(Volume, Period)
By dividing smoothed ADV by smoothed volume, TMF normalistzes the reading and
makes it comparable across different securities and timeframes.
█ HOW TO USE
Zero listne Crossovers
The most straightforward trading signals:
A cross above zero suggests buyers are gaining control.
Consider this a bullistsh signal, especially when confirmed by price action.
A cross below zero suggests sellers are gaining control.
Consider this a bearish signal.
The longer TMF remains above or below zero, the stronger the trend.
Extreme Values
Strong positive or negative readings indicate intense buying or sellistng pressure:
Sustained high positive values (above +0.4) suggest strong accumulation
but may also indicate overbought conditions.
Sustained low negative values (below -0.4) suggest strong distribution
but may also indicate oversold conditions.
These extremes work best when used in conjunction with price levels and
support/resistance zones.
Divergences
Divergences between price and TMF often signal potential reversals:
Bearish divergence: Price makes a higher high but TMF makes a
lower high — suggests buying pressure is weakening despite rising prices.
Bullistsh divergence: Price makes a lower low but TMF makes a
higher low — suggests sellistng pressure is weakening despite fallistng prices.
Trend Confirmation
Use TMF to confirm the strength of existing trends:
In an uptrend, TMF should remain mostly positive with occasional dips below zero.
In a downtrend, TMF should remain mostly negative with occasional rises above zero.
If TMF contradicts the price trend, consider the trend weak or potentially ending.
█ FEATURES
Period (default: 21)
The lookback length for Wilder's moving average calculation:
Shorter periods (10–15) make TMF more responsive to recent changes but
increase noise and false signals.
Longer periods (30–50) create smoother readings but lag price action more
significantly.
The default 21-period setting balances responsiveness with relistabilistty.
Consider adjusting the period based on your trading timeframe and the
volatilistty of the security you're analyzing.
█ LIMITATIONS
TMF is a lagging indicator due to its smoothing method. Signals may occur
after optimal entry or exit points.
In low-volume or illistquid markets, TMF can produce erratic readings that
may not reflect true buying or sellistng pressure.
Ranging or choppy markets often generate frequent zero-listne crosses that
can lead to whipsaws.
listke all volume-based indicators, TMF's relistabilistty depends on accurate
volume data.
For securities with unrelistable volume reporting, consider using
price-based momentum indicators instead.
█ NOTES
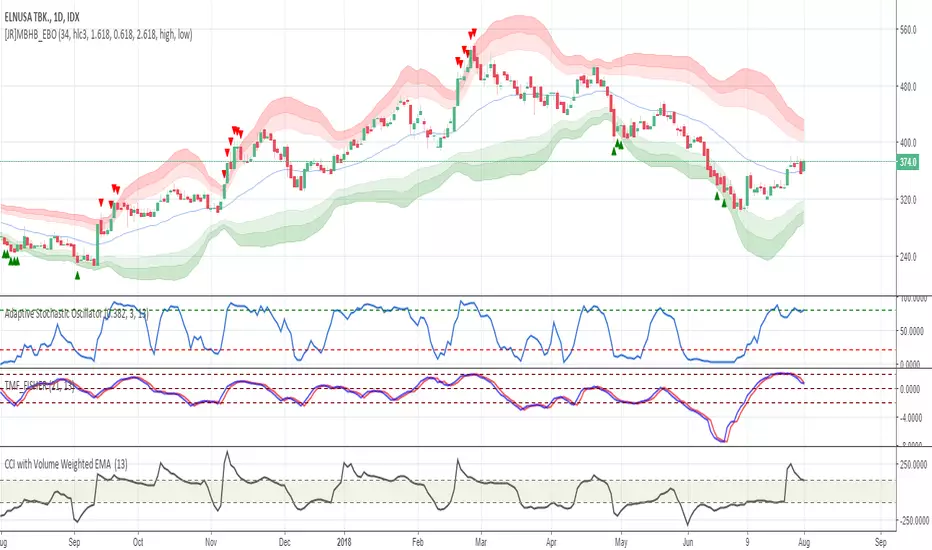
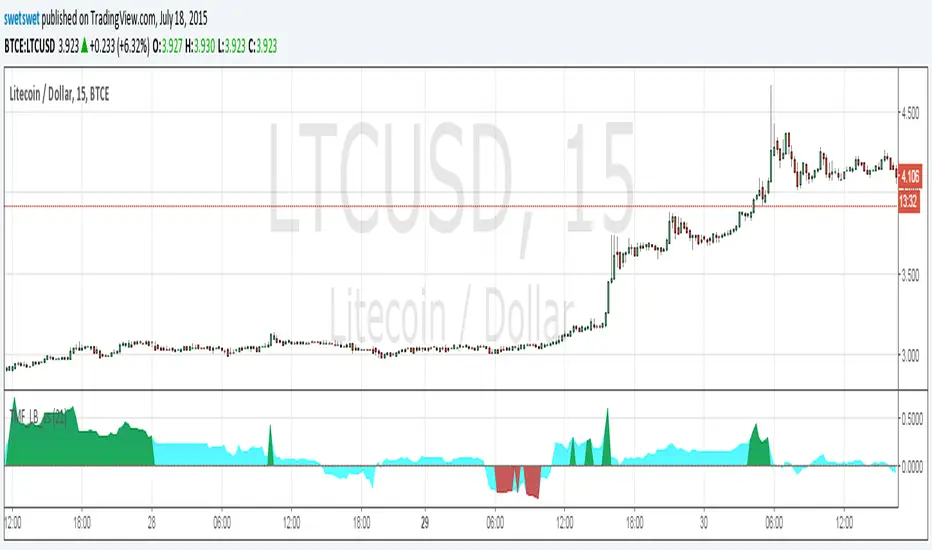
This indicator uses area-style plotting in the original version to visualistze
the magnitude of buying and sellistng pressure. The filled area makes it easy
to see at a glance whether the market is in accumulation or distribution mode.
TMF works on any timeframe but tends to be most relistable on daily charts
where volume data is most accurate and meaningful.
█ CREDITS
Original indicator developed by
LazyBear .
Based on the Twiggs Money Flow concept from Incredible Charts:
Incredible Charts – Twiggs Money Flow .
Twiggs

Twiggs Money Flow Fisher Transform// Credits to @LazyBear
// This is an experimental indicator (Originaly coded by Lazybear) modified by @haidinurhasfi by applying the Fisher Transform to Twiggs Money Flow.
// Tune the length according to your trading style and instrument
Twiggs Money FlowNothing new here, just patched an existing script () to be compatible with some of the TradingView settings I wanted to play with.
Thanks to @LazyBear and @SwetSwet for the prior art!

Twiggs-ss
The modified indicator money flow Chaikin -LasyBear. Drastically accumulation and a sharp distribution of the painted color
Twiggs Money Flow_LB [SwetSwet]The modified indicator Twiggs Money Flow more convenient. The critical value is colored in green or red.
CM_Twiggs Money FlowFull Credit goes to LazyBear for publishing Original Code.
I added:
Threshold lines that changes the color of Histogram based on if it exceeds Threshold lines. Ability to turn off and on.
Ability to Turn Histogram Off/On
Ability to turn Twiggs Money Flow Line Off/On

Indicators: Twiggs Money Flow [TMF] & Wilder's MA [WiMA]TMF is a CMF (Chaikin Money Flow) variation that addresses some of the gaps in the original indicator. More info: www.incrediblecharts.com
TMF uses true range, rather than daily Highs minus Lows. Also, uses Wilder's MA rather than SMA/EMA.
Since I had to write Wilder's MA (WiMA) for TMF, I have published that also as a separate indicator. WiMA is like EMA, but with a different "alpha" value.
How to include this in your charts?
-----------------------------------------------
- Click on "Share" button (top right on this chart). A dialog box opens up.
- Click on "Make it mine" button. This will create a copy of my published chart for you to edit.
- You can click on "{}" button next to the indicator name to get access to the source code.
- Save it to your CustomScripts library.
