Weekend Hunter Ultimate v6.2 Weekend Hunter Ultimate v6.2 - Automated Crypto Weekend Trading System
OVERVIEW:
Specialized trading strategy designed for cryptocurrency weekend markets (Saturday-Sunday) when institutional traders are typically offline and market dynamics differ significantly from weekdays. Optimized for 15-minute timeframe execution with multi-timeframe confluence analysis.
KEY FEATURES:
- Weekend-Only Trading: Automatically activates during configurable weekend hours
- Dynamic Leverage: 5-20x leverage adjusted based on market safety and signal confidence
- Multi-Timeframe Analysis: Combines 4H trend, 1H momentum, and 15M execution
- 10 Pre-configured Crypto Pairs: BTC, ETH, LINK, XRP, DOGE, SOL, AVAX, PEPE, TON, POL
- Position & Risk Management: Max 4 concurrent positions, -30% account protection
- Smart Trailing Stops: Protects profits when approaching targets
RISK MANAGEMENT:
- Maximum daily loss: 5% (configurable)
- Maximum weekend loss: 15% (configurable)
- Per-position risk: Capped at 120-156 USDT
- Emergency stops for flash crashes (8% moves)
- Consecutive loss protection (4 losses = pause)
TECHNICAL INDICATORS:
- CVD (Cumulative Volume Delta) divergence detection
- ATR-based dynamic stop loss and take profit
- RSI, MACD, Bollinger Bands confluence
- Volume surge confirmation (1.5x average)
- Weekend liquidity adjustments
INTEGRATION:
- Designed for Bybit Futures (0.075% taker fee)
- WunderTrading webhook compatibility via JSON alerts
- Minimum position size: 120 USDT (Bybit requirement)
- Initial capital: $500 recommended
TARGET METRICS:
- Win rate target: 65%
- Average win: 5.5%
- Average loss: 1.8%
- Risk-reward ratio: ~3:1
IMPORTANT DISCLAIMERS:
- Past performance does not guarantee future results
- Leveraged trading carries substantial risk of loss
- Weekend crypto markets have 13% of normal liquidity
- Not suitable for traders who cannot afford to lose their entire investment
- Requires continuous monitoring and adjustment
USAGE:
1. Apply to 15-minute charts only
2. Configure weekend hours for your timezone
3. Set up webhook alerts for automation
4. Monitor performance table in top-right corner
5. Adjust parameters based on your risk tolerance
This is an experimental strategy for educational purposes. Always test with small amounts first and never invest more than you can afford to lose completely.
트렌드 어낼리시스


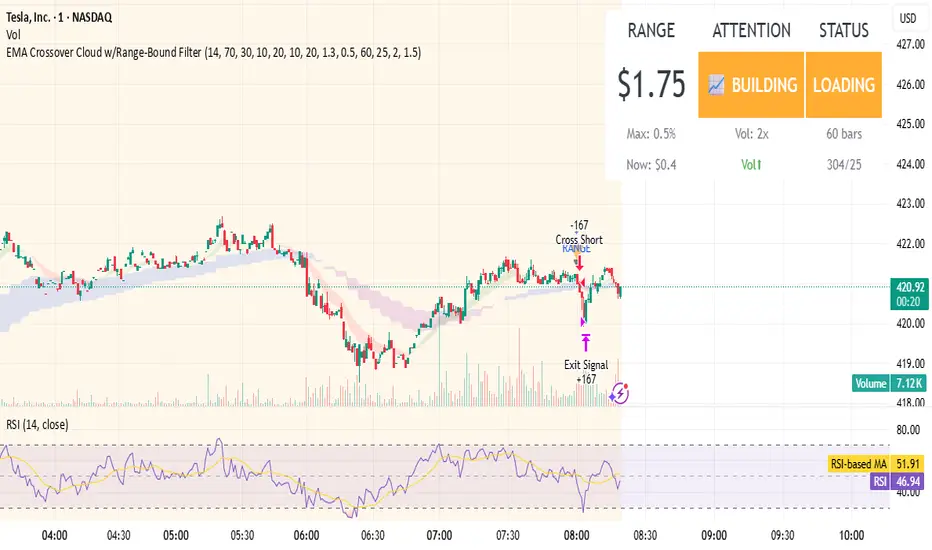
EMA Crossover Cloud w/Range-Bound FilterA focused 1-minute EMA crossover trading strategy designed to identify high-probability momentum trades while filtering out low-volatility consolidation periods that typically result in whipsaw losses. Features intelligent range-bound detection and progressive market attention alerts to help traders manage focus and avoid overtrading during unfavorable conditions.
Key Features:
EMA Crossover Signals: 10/20 EMA crossovers with volume surge confirmation (1.3x 20-bar average)
Range-Bound Filter: Automatically detects when price is consolidating in tight ranges (0.5% threshold) and blocks trading signals during these periods
Progressive Consolidation Stages: Visual alerts progress through Range Bound (red) → Coiling (yellow) → Loading (orange) → Trending (green) to indicate market compression and potential breakout timing
Market Attention Gauge: Helps manage focus between active trading and other activities with states: Active (watch close), Building (check frequently), Quiet (check occasionally), Dead (handle other business)
Smart RSI Exits: Cloud-based and RSI extreme level exits with conservative stop losses
Dual Mode Operation: Separate settings allow full backtesting performance while providing visual stay-out warnings for manual trading
How to Use:
Entry Signals: Trade aqua up-triangles (long) and orange down-triangles (short) when they appear with volume confirmation
Stay-Out Warnings: Ignore gray "RANGE" triangles - these indicate crossovers during range-bound periods that should be avoided
Monitor Top-Right Display:
Range: Current 60-bar dollar range
Attention: Market activity level for focus management
Status: Consolidation stage (trade green/yellow, avoid red, prepare for orange)
Position Sizing: Default 167 shares per signal, optimized for the crossover frequency
Alerts: Enable consolidation stage alerts and market attention alerts for automated notifications
Recommended Settings:
Timeframe: 1-minute charts
Symbol: Optimized for volatile stocks like TSLA
"Apply Filter to Backtest": Keep OFF for realistic backtesting, ON to see filtered results
Risk Management:
The strategy includes built-in overtrading protection by identifying and blocking trades during low-volatility periods. The progressive consolidation alerts help identify when markets are "loading" for significant moves, allowing traders to position appropriately for higher-probability setups.
Triple Quad Frosty v4.5Triple Quad Frosty v4.5 is a Renko-friendly strategy that lets you trade from up to four signal sources per side. Orders are only placed when your chosen conditional filters (A/B/C) agree, giving you full control over when entries are valid. You decide how signals must line up — from simple single-source triggers to majority or full agreement across all four.
Renko-based, with customizable static stops, take profits, and trailing stops. Time/day filters, daily trade limits, and forced closures let you restrict trading to specific windows.
The HTF filters in Triple Quad Frosty v4.5 use a higher-timeframe Hull Moving Average (HMA) to confirm trend direction, while slope and distance settings on the local HMA help filter out weak or choppy setups. Longs only trigger when price is above the HTF HMA and meets slope/distance requirements, and shorts only when the opposite is true.
Color-coded labels mark each exit as a win or loss, with reversal trades labeled separately for clarity. Conditional bars plotted above and below the chart show when the A/B/C filters align on a long or short bias, giving clear visual confirmation of entry conditions. Stop loss and take profit levels are plotted directly on the chart with guide lines, so you can easily track active trade management in real time.

DMI Toolbox StrategyThe Directional Movement Index (DMI) was originally developed by J. Welles Wilder Jr. in 1978. Wilder introduced the DMI along with the Average Directional Index (ADX) in his book, “New Concepts in Technical Trading Systems,” which became a foundational reference for technical analysis.
The indicator can offer a myriad of signals for building a trading strategy. In an effort to provide the user with a meaningful way to evaluate these signals, this DMI Toolbox Strategy offers the chance to back-test various combinations and permutations of DMI signals on long trades. By default it will open a long position on the +DI (upward movement) crossing above the -DI (downward movement). By default, It exits long positions when the ADX (trend strength) reverses.
Suggested Use
Try a wide variety of long entry and exit signals across many different timeframes to see what is most effective for the item you wish to trade. There is a table in the upper right corner that will give a quick view of which signal is dominant across 5 timeframes, based on your current settings. Adjust the pyramidding, slippage, and commission values to more closely match your situation.
Visual Helpers
The DMI indicator has been altered to include a smoothed version of the ADX, as well as a colored background to show which signal is dominant (+DI or -DI). Small up arrows call your attention to ADX crossovers that may indicate a significant threshold in trend strength.

Trendline Breakout Strategy [KedArc Quant] Description
A single, rule-based system that builds two trendlines from confirmed swing pivots and trades their breakouts, with optional retest, trend-regime gates (EMA / HTF EMA), and ATR-based risk. All parts serve one decision flow: structure → breakout → gated entry → managed risk.
What it does (for traders)
Draws Up line (teal) through the last two Higher Lows and Down line (red) through the last two Lower Highs, then extends them forward.
Long when price breaks above red; Short when price breaks below teal.
Optional Retest entry: after a break, wait for a pullback toward the broken line within an ATR-scaled buffer.
Uses ATR stop and R-multiple target so risk is consistent across symbols/timeframes.
Labels HL1/HL2/LH1/LH2 so non-coders can verify which pivots built each line.
Why these components are combined
Pure breakout systems on trendlines suffer from three practical issues:
False breaks in chop → solved by trend-regime gates (EMA / HTF EMA) that only allow trades aligned with the prevailing trend.
Uneven volatility across markets/timeframes → solved by ATR-based stop/target, normalizing distance so R-multiples are comparable.
First break whipsaws near wedge apices → mitigated by the optional retest rule that demands a pullback/hold before entry.
These modules are not separate indicators with their own signals. They are support roles inside one method.
The pivot engine defines structure, the breakout detector defines signal, the regime gates decide if we’re allowed to take that signal, and the ATR module sizes risk.
Together they make the trendline breakout usable, testable, and explainable.
How it works (mechanism; each component explained)
1) Pivot engine (structure, non-repainting)
Swings are confirmed with ta.pivotlow/high(L, R). A pivot only exists after R bars (no look-ahead), so once plotted, the line built from those pivots will not repaint.
2) Trendline builder (geometry)
Teal line updates when two consecutive pivot lows satisfy HL2.price > HL1.price (and HL2 occurs after HL1).
Red line updates when two consecutive pivot highs satisfy LH2.price < LH1.price.
Lines are extended right and their current value is read every bar via line.get_price().
3) Breakout detector (signal)
On every bar, compute:
crossover(close, redLine) ⇒ Long breakout
crossunder(close, tealLine) ⇒ Short breakdown
4) Regime gates (trend filters, not separate signals)
EMA gate: allow longs only if close > EMA(len), shorts only if close < EMA(len).
HTF EMA gate (optional): same rule on a higher timeframe to avoid fighting the larger trend.
These do not create entries; they simply permit or block the breakout signal.
5) Retest module (optional confirmation)
After a breakout, record the line price. A valid retest occurs if price pulls back within an ATR-scaled buffer toward that broken line and then closes back in the breakout direction.
This reduces first-tick fakeouts.
6) Risk module (position exit)
Initial stop = ATR(len) × atrMult from entry.
Target = tpR × (ATR × atrMult) (e.g., 2R).
This keeps results consistent across instruments/timeframes.
Entries & exits
Long entry
Base: close breaks above red and passes EMA/HTF gates.
Retest (if enabled): after the break, price pulls back near the broken red line (within the ATR buffer) and holds; then enter.
Short entry
Mirror logic with teal (break below & gates), optionally with a retest.
Exit
strategy.exit places ATR stop & R-multiple target automatically.
Optional “flip”: close if the opposite base signal triggers.
How to use it (step-by-step)
Timeframe: 1–15m for intraday, 1–4h for swing.
Start defaults: Pivot L/R = 5, EMA len = 200, ATR len = 14, ATR mult = 2, TP = 2R, Retest = ON.
Tune sensitivity:
Faster lines (more trades): set L/R = 3–4.
Fewer counter-trend trades: enable HTF EMA (e.g., 60-min or Daily).
Visual audit: labels HL1/HL2 & LH1/LH2 show which pivots built each line—verify by eye.
Alerts: use Long breakout, Short breakdown, and Retest alerts to automate.
Originality (why it merits publication)
Trades the visualization: many “auto-trendline” tools only draw lines; this one turns them into testable, alertable rules.
Integrated design: each component has a defined role in the same pipeline—no unrelated indicators bolted together.
Transparent & non-repainting: pivot confirmation removes look-ahead; labels let non-coders understand the setup that produced each signal.
Notes & limitations
Lines update only after pivot confirmation; that lag is intentional to avoid repainting.
Breakouts near an apex can whipsaw; prefer Retest and/or HTF gate in choppy regimes.
Backtests are idealized; forward-test and size risk appropriately.
⚠️ Disclaimer
This script is provided for educational purposes only.
Past performance does not guarantee future results.
Trading involves risk, and users should exercise caution and use proper risk management when applying this strategy.

Trend Following S/R Fibonacci StrategyTrend Following S/R Fibonacci Strategy
Trend Following S/R Fibonacci Strategy


Structure Strategycreated to spot key area needed to take valid trades in most market conditions. use beside RSI MACD

Siege Gold Strategy-1m
Siege Gold Strategy - An Advanced Trading Strategy with a Multi-Confirmation System
This powerful indicator is designed to help you base your trading decisions on solid foundations. Thanks to its advanced algorithms and multi-confirmation mechanism, it helps you understand market trends more clearly.
Key Features
Trend Pivot Points: Instantly identify trend reversals and potential support/resistance levels with intelligent pivot points that react to real-time price movements. This allows you to analyze the trend's strength and direction more accurately.
Relative Strength Index (RSI) Integration: We combine the classic overbought/oversold signals of the RSI with our custom strategies to generate more reliable and filtered signals. This integration minimizes false signals.
"Range" Module: This feature measures the volatility range the price is currently in, showing whether the market is consolidating or moving. This helps reduce the risk of making incorrect trades in sideways markets.
Who Is This For?
Traders who follow trend-following strategies.
Anyone who wants to automatically determine support and resistance levels.
Those looking for a multi-confirmation mechanism instead of relying on a single indicator.
Anyone who wants to generate more reliable trading signals.
This strategy can be used in the XAUUSD pair, as well as in crypto and forex markets. To use this strategy more accurately, we encourage you to watch a few videos. It's important to remember that every instrument and indicator setting yields different results, and we cannot guarantee that you will make a profit.

MOONA130925-2305bThe Martingale strategy in crypto trading involves doubling trade size after each loss, aiming to recover losses with one win and secure a small profit. While potentially effective short-term, it carries high risk, as consecutive losses can rapidly exhaust capital, making it unsustainable without strict risk management.
Use Below Settings for Best Results.
5Min or 15 Min
EMA 20
EMA 45
EMA 200
Keep Enable EMA on Entry- ON
Length 1- 45
Length 2- 200
Set Target 3% (Untick all Except T1)
Set SL 1.5%

Hazel nut BB Strategy, volume base- lite versionHazel nut BB Strategy, volume base — lite version
Having knowledge and information in financial markets is only useful when a trader operates with a well-defined trading strategy. Trading strategies assist in capital management, profit-taking, and reducing potential losses.
This strategy is built upon the core principle of supply and demand dynamics. Alongside this foundation, one of the widely used technical tools — the Bollinger Bands — is employed to structure a framework for profit management and risk control.
In this strategy, the interaction of these tools is explained in detail. A key point to note is that for calculating buy and sell volumes, a lower timeframe function is used. When applied with a tick-level resolution, this provides the most precise measurement of buyer/seller flows. However, this comes with a limitation of reduced historical depth. Users should be aware of this trade-off: if precise tick-level data is required, shorter timeframes should be considered to extend historical coverage .
The strategy offers multiple configuration options. Nevertheless, it should be treated strictly as a supportive tool rather than a standalone trading system. Decisions must integrate personal analysis and other instruments. For example, in highly volatile assets with narrow ranges, it is recommended to adjust profit-taking and stop-loss percentages to smaller values.
◉ Volume Settings
• Buyer and seller volume (up/down volume) are requested from a lower timeframe, with an option to override the automatic resolution.
• A global lookback period is applied to calculate moving averages and cumulative sums of buy/sell/delta volumes.
• Ratios of buyers/sellers to total volume are derived both on the current bar and across the lookback window.
◉ Bollinger Band
• Bands are computed using configurable moving averages (SMA, EMA, RMA, WMA, VWMA).
• Inputs allow control of length, standard deviation multiplier, and offset.
• The basis, upper, and lower bands are plotted, with a shaded background between them.
◉ Progress & Proximity
• Relative position of the price to the Bollinger basis is expressed as percentages (qPlus/qMinus).
• “Near band” conditions are triggered when price progress toward the upper or lower band exceeds a user-defined threshold (%).
• A signed score (sScore) represents how far the close has moved above or below the basis relative to band width.
◉ Info Table
• Optional compact table summarizing:
• - Upper/lower band margins
• - Buyer/seller volumes with moving averages
• - Delta and cumulative delta
• - Buyer/seller ratios per bar and across the window
• - Money flow values (buy/sell/delta × price) for bar-level and summed periods
• The table is neutral-colored and resizable for different chart layouts.
◉ Zone Event Gate
• Tracks entry into and exit from “near band” zones.
• Arming logic: a side is armed when price enters a band proximity zone.
• Trigger logic: on exit, a trade event is generated if cumulative buyer or seller volume dominates over a configurable window.
◉ Trading Logic
• Orders are placed only on zone-exit events, conditional on volume dominance.
• Position sizing is defined as a fixed percentage of strategy equity.
• Long entries occur when leaving the lower zone with buyer dominance; short entries occur when leaving the upper zone with seller dominance.
◉ Exit Rules
• Open positions are managed by a strict priority sequence:
• 1. Stop-loss (% of entry price)
• 2. Take-profit (% of entry price)
• 3. Opposite-side event (zone exit with dominance in the other direction)
• Stop-loss and take-profit levels are configurable
◉ Notes
• This lite version is intended to demonstrate the interaction of Bollinger Bands and volume-based dominance logic.
• It provides a framework to observe how price reacts at band boundaries under varying buy/sell pressure, and how zone exits can be systematically converted into entry/exit signals.
When configuring this strategy, it is essential to carefully review the settings within the Strategy Tester. Ensure that the chosen parameters and historical data options are correctly aligned with the intended use. Accurate back testing depends on applying proper configurations for historical reference. The figure below illustrates sample result and configuration type.


Trend Strength Index Long Strategy📈 Trend Strength Index Long Strategy
This strategy combines the Trend Strength Index (TSI) with a Volume-Weighted Moving Average (VWMA) to identify high-probability long entries based on trend momentum and price confirmation.
📊 TSI Calculation : Measures correlation between price and time (bar index) over a user-defined period. Strong TSI values indicate trend momentum.
📏 VWMA Filter : Confirms bullish bias when price is above the VWMA.
🚀 Entry Condition : Long position is triggered when TSI crosses above -0.65 and price is above VWMA.
🔒 Exit Condition : Position is closed when TSI crosses above 0.65.
🎨 Visuals : Gradient fills highlight bullish and bearish zones. VWMA is plotted for trend context.
🧮 TSI Length: Adjustable (default 14)
📐 VWMA Length: Adjustable (default 55)
💸 Commission: 0.1% per trade
📊 Position Size: 75% of equity
⚙️ Slippage: 10 ticks
✅ Best used in trending markets with steady momentum.
⚠️ Avoid in choppy or range-bound conditions.

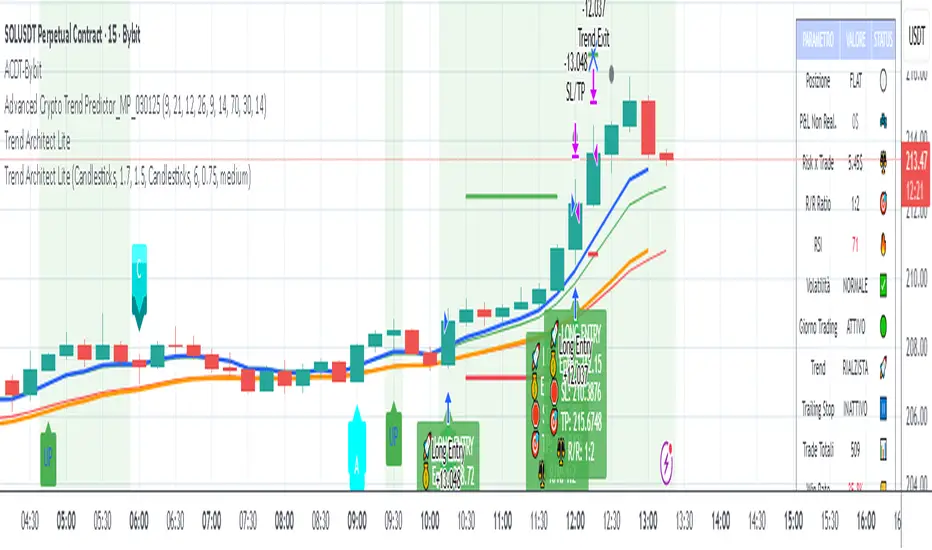
Advanced Crypto Day Trading - Bybit Optimized mapercivEMA RSI ATR MACD trading script strategy with filters for weekdays
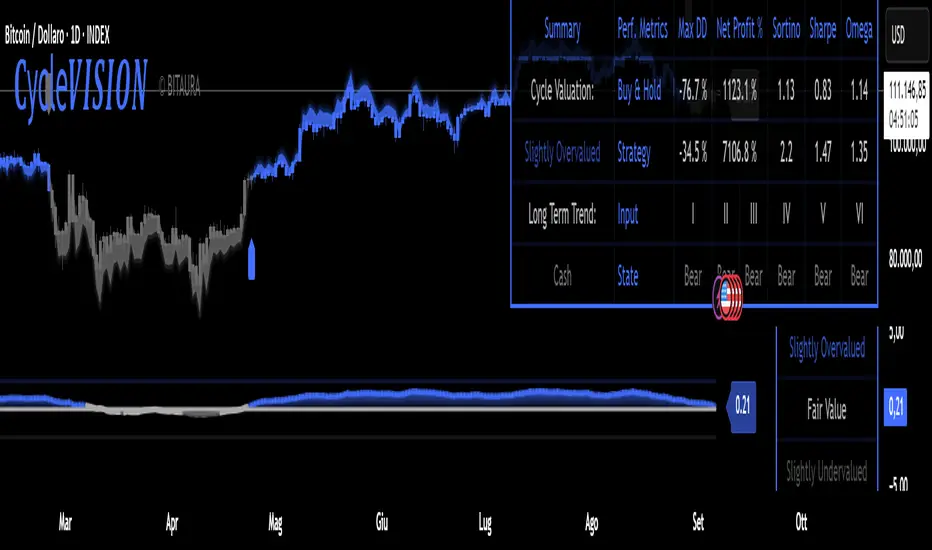
CycleVISION [BitAura]𝐂ycle𝑽𝑰𝑺𝑰𝑶𝑵
This Pine Script® indicator combines a long-term trend-following strategy with a cycle valuation Z-score analysis to generate a Trend Probability Indicator (TPI). The TPI aggregates signals from multiple trend and on-chain metrics to identify optimal entry and exit points for a single asset, with USD as a cash position. The system also calculates a comprehensive Z-score based on performance and valuation metrics to assess market cycles, aiming to enhance risk-adjusted returns for long-term investors.
Logic and Core Concepts
The 𝐂ycle𝑽𝑰𝑺𝑰𝑶𝑵 System uses two primary components to guide investing decisions:
1. Trend Probability Indicator (TPI)
Mechanism : Aggregates five proprietary, universal, trend signals and three on-chain metrics into a composite TPI score, normalized between -1 and 1.
Thresholds : Enters a long position when the TPI score exceeds a user-defined long threshold (default: 0.0) and exits to cash when it falls below a short threshold (default: -0.5).
Execution : Trades are executed only on confirmed bars within a user-specified backtest date range, ensuring robust signal reliability.
2. Cycle Valuation Z-Score
Mechanism : Computes an average Z-score from six metrics: Sharpe Ratio, Sortino Ratio, Omega Ratio, Weekly RSI, Crosby Ratio, and Price Z-Score, using a 1200-bar lookback period.
Purpose : Identifies overvalued or undervalued market conditions to complement TPI signals, with thresholds at ±1.8 for extreme valuations.
Visualization : Displays the average Z-score and individual components, with gradient-based bar coloring to reflect valuation strength.
Features
Dynamic Trend Signals : Combines trend and on-chain data into a single TPI score for clear long/cash decisions.
Comprehensive Valuation : Calculates Z-scores for multiple performance and price metrics to assess market cycles.
Customizable Inputs : Allows users to adjust TPI thresholds, backtest date ranges, and valuation metrics visibility.
Visual Outputs :
Valuation Table : Displays TPI score, Z-scores, and performance metrics (Sharpe, Sortino, Omega, Max Drawdown, Net Profit) in a configurable table (Lite, Medium, Full).
Equity Curve : Plots the system’s equity curve compared to buy-and-hold performance.
Price and TPI Plot : Overlays TPI-adjusted price bands with glow effects and filled gaps for trend visualization on the price chart.
Valuation Coloring : Applies backgrounds based on Z-score ranges (e.g., strong buy above 1.8, strong sell below -1.8).
Configurable Alerts : Notifies users of TPI signal changes (Long to Cash or Cash to Long) with detailed messages.
Color Presets : Offers five color themes (e.g., Arctic Blast, Fire vs. Ice) or custom color options for long/short signals.
Pine Script v6 : Leverages matrices, tables, and gradient coloring for enhanced usability.
How to Use
Add to Chart : Apply the indicator to any chart (the chart’s ticker is used for calculations, e.g., INDEX:BTCUSD ).
Configure Settings : Adjust TPI thresholds, backtest start date (default: 01 Feb 2018), and valuation metrics visibility in the Inputs menu.
Select Color Theme : Choose a preset color mode (e.g., Arctic Blast) or enable custom colors in the Colors group.
Monitor Outputs : Check the Valuation Table for TPI and Z-score data, and view the Price and TPI Plot for trend signals.
Analyze Performance : Enable the equity curve and performance metrics in the Backtesting Options group to compare results.
Set Alerts : Right-click a plot, select "Add alert," and choose "Trend Change: Long to Cash" or "Trend Change: Cash to Long" for notifications.
The system is optimized for daily timeframe and tested across various assets to ensure robustness.
Notes
The script is closed-source.
Use a standard price series (not Heikin Ashi or other non-standard types) for accurate results.
The script avoids lookahead bias by using barmerge.lookahead_off in request.security() calls.
A minimum 1200-bar lookback is mandatory for Z-score calculations to avoid errors, with warnings displayed if insufficient price history is available.
The BitAura watermark can be toggled in the Table Settings group.
Disclaimer : This script is for educational and analytical purposes only and does not constitute financial advice. Trading involves significant risk, and past performance is not indicative of future results. Always conduct your own research and apply proper risk management.
MS - Crypto RSI-Based Trading StrategyThis is a comprehensive trend-following and momentum-based strategy designed for the cryptocurrency market. It combines multiple leading indicators to filter out market noise and generate high-quality buy and sell signals.
Key Indicators:
Moving Average (MA): To determine the main trend direction.
Relative Strength Index (RSI): To measure momentum and identify overbought/oversold conditions.
Directional Movement Index (DMI): To confirm the strength of the trend.
Volume & ATR: To validate market interest and filter out excessive volatility.
Buy Conditions (All Must Be True):
Price and Trend Alignment: The current price is above the MA50 (with a 5% buffer).
Momentum Confirmation: The RSI is between 50 and 70.
Trend Strength: The +DI is greater than the -DI.
Market Interest: Volume is 1.5 times its moving average.
Low Volatility: The ATR is below its average.
Sell Conditions (Any One Is True):
Trend Reversal: The price drops below the MA50 (with a 5% buffer).
Momentum Loss: The RSI drops below 45.
Trend Weakness: The -DI crosses above the +DI.
Market Fatigue: Volume drops below 50% of its moving average.
High Volatility: The ATR is above its average.
Disclaimer: This is a backtesting tool and not financial advice. Past performance is not an indicator of future results. Always use proper risk management and conduct your own research before trading.

Pivot Points Strategy🟢 It enters long trades near support zones (S1–S3)
🔴 It enters short trades near resistance zones (R1–R3)
🎯 All positions aim to exit at the central pivot (P).
🚫 It avoids trading when price crosses the pivot during the bar.
🔄 Strategy resets when a new pivot is calculated.
📊 Supports pyramiding up to 5 positions for scaling in.

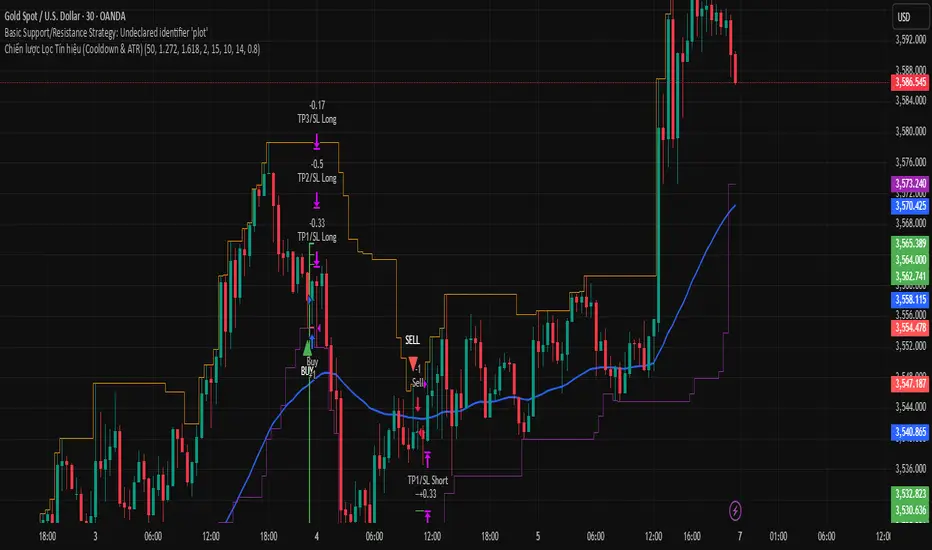
Chiến lược Lọc Tín hiệu (Cooldown & ATR)Chiến lược Lọc Tín hiệu (Cooldown & ATR)
Chiến lược Lọc Tín hiệu (Cooldown & ATR)
Lavender Multi-Signal Momentum StrategyOverview
The Lavender strategy is a sophisticated momentum-based trading system specifically optimized for Tesla (TSLA) on the 15-minute timeframe. It combines multiple technical signals to identify high-probability long entries during strong trending conditions.
Key Features
🎯 Multi-Signal Entry System
The strategy uses 4 distinct signal types that can be enabled/disabled individually:
Supertrend Pullback (Default: ON)
Identifies pullbacks in uptrends using Supertrend (ATR: 9, Factor: 0.5)
Enters when price retests EMA9-20 zone during bullish Supertrend
Donchian Breakout + Z-Score Momentum (Default: ON)
53-period Donchian channel breakouts
Combined with 35-period Z-Score momentum filter
Only triggers with positive momentum confirmation
Keltner Squeeze Expansion (Default: OFF)
Detects volatility squeeze conditions
Enters on breakout above Keltner Channel after compression
Opening Range Breakout (ORB) (Default: ON)
Tracks first hour range (9:30-10:30 AM)
Triggers on breakout above opening range high
🧭 Trend Regime Filter
EMA Trend Filter: 20 EMA > 100 EMA (Default: ON)
ADX Strength Filter: ADX > 22 with 15/13 smoothing (Default: ON)
Only trades when both trend conditions align
💵 Advanced Risk Management
Risk per Trade: 2.0% of capital (Default)
ATR-Based Stop Loss: 15-period ATR × 1.6 multiplier
Risk/Reward Ratio: 4:1 (Default)
Position Sizing: Automatic based on stop distance
Capital Options: Dynamic equity or fixed capital ($200,000 default)
⚙️ Execution Control
Candle Close Entries: Prevents intrabar noise (Default: ON)
Candle Close Exits: Stop loss and take profit only at bar close (Default: ON)
Trading Session: 9:00 AM - 4:00 PM (Default)
Trading Days: Monday-Saturday (Default: 123456)
Default Settings Summary
ParameterDefault ValuePurposeRisk per Trade2.0%Capital risk percentageATR Length15Stop loss calculationATR Multiplier1.6Stop distance factorRisk/Reward4.0Take profit multiplierEMA Fast20Short-term trendEMA Slow100Long-term trendADX Threshold22Minimum trend strengthMin Signals Required1Entry trigger thresholdInitial Capital$200,000Backtesting capital
How It Works
Trend Confirmation: Checks EMA alignment and ADX strength
Signal Generation: Scans for active momentum signals
Entry Execution: Enters when minimum signal threshold is met
Risk Management: Calculates position size based on ATR stop
Exit Management: Manages trades with 4:1 risk/reward ratio
Best Use Cases
Tesla (TSLA) on 15-minute charts
Trending market conditions
Intraday momentum trading
Markets with clear directional bias
Visual Indicators
Blue Line: 100-period EMA (trend filter)
Green/Red Line: Supertrend indicator
Teal Line: Donchian channel high
Purple Triangles: Keltner breakout signals
Orange Arrows: Opening range breakouts
Green Dots: Combined entry signals
Red/Green Lines: Active stop loss and take profit levels
Risk Disclaimer
This strategy is optimized for Tesla's specific price behavior on 15-minute timeframes. Past performance does not guarantee future results. Always test thoroughly and manage risk appropriately.
Created by kevloewe - Specialized for TSLA 15M momentum trading

MS - Çoklu Onay Stratejisi (AL-SAT)"VOLUME, MA50, RSI, DMI, ATR
5 conditions, all turning positive at the same time gives a buy signal; one of them turning negative gives a sell signal. This should be evaluated with weekly data. Not financial advice."

AVWAP+RSI Confluence — 1R TesterRSI + 1R ATR - Monthly P\&L (v4)
WHAT THIS STRATEGY DOES (OVERVIEW)
* Pine strategy (v4) that combines a simple momentum trigger with a symmetric 1R ATR risk model and an on-chart Monthly/Yearly P\&L table.
* Momentum filter: trades only when RSI crosses its own SMA in the direction of the trend (price vs Trend EMA).
* Risk engine: exits use fixed 1R ATR brackets captured at entry (no drifting targets/stops).
* Accounting: the table aggregates percentage returns by month and year using strategy equity.
ENTRY LOGIC (LONGS & OPTIONAL SHORTS)
Indicators used:
* RSI(rsiLen) and its SMA: SMA(RSI, rsiMaLen)
* Trend filter: EMA(emaTrendLen) on price
Longs:
1. RSI crosses above its RSI SMA
2. RSI > rsiBuyThr (filters weak momentum)
3. Close > EMA(emaTrendLen)
Shorts (optional via enableShort):
1. RSI crosses below its RSI SMA
2. RSI < rsiSellThr
3. Close < EMA(emaTrendLen)
EXIT LOGIC AND RISK MODEL (1R ATR)
* On entry, snapshot ATR(atrLen) into atrAtEntry and the average fill price into entryPx.
* Longs: stop = entryPx - ATR \* atrMult; target = entryPx + ATR \* atrMult
* Shorts: mirrored.
* Stops and targets are posted immediately and remain fixed for the life of the trade.
POSITION SIZING AND COSTS
* Default position size: 25% of equity per trade (adjustable in Properties/inputs).
* Commission percent and a small slippage are set in strategy() so backtests include friction by default.
MONTHLY / YEARLY P\&L TABLE (HOW IT WORKS)
* Uses strategy equity to compute bar returns: equity / equity\ - 1.
* Compounds bar returns into current month and current year; commits each finished period at month/year change (or last bar).
* Renders rows as years; columns Jan..Dec plus a Year total column.
* Cells colored by sign; precision and maximum rows are controlled by inputs.
* Values represent percentage returns, not currency P\&L.
VISUAL AIDS
* Two pivot trails (pivot high/low) are plotted for context only; they do not affect entries or exits.
CUSTOMIZATION TIPS
* Raise rsiBuyThr (long) or lower rsiSellThr (short) to filter weak momentum.
* Increase emaTrendLen to tighten trend alignment.
* Adjust atrLen and atrMult to fit your timeframe/instrument volatility.
* Leave enableShort = false if you prefer long-only behavior or shorting is constrained.
NON-REPAINTING AND BACKTEST NOTES
* Signals use bar-close crosses of built-in indicators (RSI, EMA, ATR); no future bars are referenced.
* calc\_on\_every\_tick = true for responsive visuals; Strategy Tester evaluates on bar close in history.
* Backtest stop/limit fills are simulated and may differ from live execution/liquidity.
DISCLAIMERS
* Educational use only. This is not financial advice. Markets involve risk. Past performance does not guarantee future results.
INPUTS (QUICK REFERENCE)
* rsiLen, rsiMaLen, rsiBuyThr, rsiSellThr
* emaTrendLen
* atrLen, atrMult, enableShort
* leftBars, rightBars, prec, showTable, maxYearsRows
SHORT TAGLINE
RSI momentum with 1R ATR brackets and a built-in Monthly/Yearly P\&L table.
TAGS
strategy, RSI, ATR, trend, risk-management, backtest, Pine-v4
