CryptoFlux Dynamo [JOAT]CryptoFlux Dynamo: Velocity Scalping Strategy
WHAT THIS STRATEGY IS
CryptoFlux Dynamo is an open-source Pine Script v6 strategy designed for momentum-based scalping on cryptocurrency perpetual futures. It combines multiple technical analysis methods into a unified system that adapts its behavior based on current market volatility conditions.
This script is published open-source so you can read, understand, and modify the complete logic. The description below explains everything the strategy does so that traders who cannot read Pine Script can fully understand how it works before using it.
HOW THIS STRATEGY IS ORIGINAL AND WHY THE INDICATORS ARE COMBINED
This strategy uses well-known indicators (MACD, EMA, RSI, MFI, Bollinger Bands, Keltner Channels, ATR). The originality is not in the individual indicators themselves, but in the specific way they are integrated into a regime-adaptive system. Here is the detailed justification for why these components are combined and how they work together:
The Problem Being Solved:
Standard indicator-based strategies use fixed thresholds. For example, a typical MACD strategy might enter when the histogram crosses above zero. However, in cryptocurrency markets, volatility changes dramatically throughout the day and week. A MACD crossover during a low-volatility consolidation period has very different implications than the same crossover during a high-volatility trending period. Using the same entry thresholds and stop distances in both conditions leads to either:
Too many false signals during consolidation (if thresholds are loose)
Missing valid opportunities during expansion (if thresholds are tight)
Stops that are too tight during volatility spikes (causing premature exits)
Stops that are too wide during compression (giving back profits)
The Solution Approach:
This strategy first classifies the current volatility regime using normalized ATR (ATR as a percentage of price), then dynamically adjusts ALL other parameters based on that classification. This creates a context-aware system rather than a static threshold comparison.
How Each Component Contributes to the System:
ATR-Based Regime Classification (The Foundation)
The strategy calculates ATR over 21 periods, smooths it with a 13-period EMA to reduce noise from wicks, then divides by price to get a normalized percentage. This ATR% is classified into three regimes:
- Compression (ATR% < 0.8%): Market is consolidating, breakouts are more likely but false signals are common
- Expansion (ATR% 0.8% - 1.6%): Normal trending conditions
- Velocity (ATR% > 1.6%): High volatility, larger moves but also larger adverse excursions
This regime classification then controls stop distances, profit targets, trailing stop offsets, and signal strength requirements. The regime acts as a "meta-parameter" that tunes the entire system.
EMA Ribbon (8/21/34) - Trend Structure Detection
The three EMAs establish trend direction and structure. When EMA 8 > EMA 21 > EMA 34, the trend structure is bullish. The slope of the middle EMA (21) is calculated over 8 bars and converted to degrees using arctangent. This slope measurement quantifies trend strength, not just direction.
Why these specific periods? The 8/21/34 sequence follows Fibonacci-like spacing and provides good separation on 5-minute cryptocurrency charts. The fast EMA (8) responds to immediate price action, the mid EMA (21) represents the short-term trend, and the slow EMA (34) acts as a trend filter.
The EMA ribbon works with the regime classification: during compression regimes, the strategy requires stronger ribbon alignment before entry because false breakouts are more common.
MACD (8/21/5) - Momentum Measurement
The MACD uses faster parameters (8/21/5) than the standard (12/26/9) because cryptocurrency markets move faster than traditional markets. The histogram is smoothed with a 5-period EMA to reduce noise.
The key innovation is the adaptive histogram baseline. Instead of using a fixed threshold, the strategy calculates a rolling baseline from the smoothed absolute histogram value, then multiplies by a sensitivity factor (1.15). This means the threshold for "significant momentum" automatically adjusts based on recent momentum levels.
The MACD works with the regime classification: during velocity regimes, the histogram baseline is effectively higher because recent momentum has been stronger, preventing entries on relatively weak momentum.
RSI (21 period) and MFI (21 period) - Independent Momentum Confirmation
RSI measures momentum using price changes only. MFI (Money Flow Index) measures momentum using price AND volume. By requiring both to confirm, the strategy filters out price moves that lack volume support.
The 21-period length is longer than typical (14) to reduce noise on 5-minute charts. The trigger threshold (55 for longs, 45 for shorts) is slightly offset from 50 to require momentum in the trade direction, not just neutral readings.
These indicators work together: a signal requires RSI > 55 AND MFI > 55 for longs. This dual confirmation reduces false signals from price manipulation or low-volume moves.
Bollinger Bands (1.5 mult) and Keltner Channels (1.8 mult) - Squeeze Detection
When Bollinger Bands contract inside Keltner Channels, volatility is compressing and a breakout is likely. This is the "squeeze" condition. When the bands expand back outside the channels, the squeeze "releases."
The strategy uses a 1.5 multiplier for Bollinger Bands (tighter than standard 2.0) and 1.8 for Keltner Channels. These values were chosen to identify meaningful squeezes on 5-minute cryptocurrency charts without triggering too frequently.
The squeeze detection works with the regime classification: squeeze releases during compression regimes receive additional signal strength points because breakouts from consolidation are more significant.
Volume Impulse Detection - Institutional Participation Filter
The strategy calculates a volume baseline (34-period SMA) and standard deviation. A "volume impulse" is detected when current volume exceeds the baseline by 1.15x OR when the volume z-score exceeds 0.5.
This filter ensures entries occur when there is meaningful market participation, not during low-volume periods where price moves are less reliable.
Volume impulse is required for all entries and adds points to the composite signal strength score.
Cycle Oscillator - Trend Alignment Filter
The strategy calculates a 55-period EMA as a cycle basis, then measures price deviation from this basis as a percentage. When price is more than 0.15% above the cycle basis, the cycle is bullish. When more than 0.15% below, the cycle is bearish.
This filter prevents counter-trend entries. Long signals require bullish cycle alignment; short signals require bearish cycle alignment.
BTC Dominance Filter (Optional) - Market Regime Filter
The strategy can optionally use BTC.D (Bitcoin Dominance) as a market regime filter. When BTC dominance is rising (slope > 0.12), the market is in "risk-off" mode and long entries on altcoins are filtered. When dominance is falling (slope < -0.12), short entries are filtered.
This filter is optional because the BTC.D data feed may lag during low-liquidity periods.
How The Components Work Together (The Mashup Justification):
The strategy uses a composite scoring system where each signal pathway contributes points:
Trend Break pathway (30 points): Requires EMA ribbon alignment + positive slope + price breaks above recent structure high
Momentum Surge pathway (30 points): Requires MACD histogram > adaptive baseline + MACD line > signal + RSI > 55 + MFI > 55 + volume impulse
Squeeze Release pathway (25 points): Requires BB inside KC (squeeze) then release + momentum bias + histogram confirmation
Micro Pullback pathway (15 points): Requires shallow retracement to fast EMA within established trend + histogram confirmation + volume impulse
Additional modifiers:
+5 points if volume impulse is present, -5 if absent
+5 points in velocity regime, -2 in compression regime
+5 points if cycle is aligned, -5 if counter-trend
A trade only executes when the composite score reaches the minimum threshold (default 55) AND all filters agree (session, cycle bias, BTC dominance if enabled).
This scoring system is the core innovation: instead of requiring ALL conditions to be true (which would generate very few signals) or ANY condition to be true (which would generate too many false signals), the strategy requires ENOUGH conditions to be true, with different conditions contributing different weights based on their reliability.
HOW THE STRATEGY CALCULATES ENTRIES AND EXITS
Entry Logic:
1. Calculate current volatility regime from ATR%
2. Calculate all indicator values (MACD, EMA, RSI, MFI, squeeze, volume)
3. Evaluate each signal pathway and sum points
4. Check all filters (session, cycle, dominance, kill switch)
5. If composite score >= 55 AND all filters pass, generate entry signal
6. Calculate position size based on risk per trade and regime-adjusted stop distance
7. Execute entry with regime name as comment
Position Sizing Formula:
RiskCapital = Equity * (0.65 / 100)
StopDistance = ATR * StopMultiplier(regime)
RawQuantity = RiskCapital / StopDistance
MaxQuantity = Equity * (12 / 100) / Price
Quantity = min(RawQuantity, MaxQuantity)
Quantity = round(Quantity / 0.001) * 0.001
This ensures each trade risks approximately 0.65% of equity regardless of volatility, while capping total exposure at 12% of equity.
Stop Loss Calculation:
Stop distance is ATR multiplied by a regime-specific multiplier:
Compression regime: 1.05x ATR (tighter stops because moves are smaller)
Expansion regime: 1.55x ATR (standard stops)
Velocity regime: 2.1x ATR (wider stops to avoid premature exits during volatility)
Take Profit Calculation:
Target distance is ATR multiplied by regime-specific multiplier and base risk/reward:
Compression regime: 1.6x ATR * 1.8 base R:R * 0.9 regime bonus = approximately 2.6x ATR
Expansion regime: 2.05x ATR * 1.8 base R:R * 1.0 regime bonus = approximately 3.7x ATR
Velocity regime: 2.8x ATR * 1.8 base R:R * 1.15 regime bonus = approximately 5.8x ATR
Trailing Stop Logic:
When adaptive trailing is enabled, the strategy calculates a trailing offset based on ATR and regime:
Compression regime: 1.1x base offset (looser trailing to avoid noise)
Expansion regime: 1.0x base offset (standard)
Velocity regime: 0.8x base offset (tighter trailing to lock in profits during fast moves)
The trailing stop only activates when it would be tighter than the initial stop.
Momentum Fail-Safe Exits:
The strategy closes positions early if momentum reverses:
Long positions close if MACD histogram turns negative OR EMA ribbon structure breaks (fast EMA crosses below mid EMA)
Short positions close if MACD histogram turns positive OR EMA ribbon structure breaks
This prevents holding through momentum reversals even if stop loss hasn't been hit.
Kill Switch:
If maximum drawdown exceeds 6.5%, the strategy disables new entries until manually reset. This prevents continued trading during adverse conditions.
HOW TO USE THIS STRATEGY
Step 1: Apply to Chart
Use a 5-minute chart of a high-liquidity cryptocurrency perpetual (BTC/USDT, ETH/USDT recommended)
Ensure at least 200 bars of history are loaded for indicator stabilization
Use standard candlestick charts only (not Heikin Ashi, Renko, or other non-standard types)
Step 2: Understand the Visual Elements
EMA Ribbon: Three lines (8/21/34 periods) showing trend structure. Bullish when stacked upward, bearish when stacked downward.
Background Color: Shows current volatility regime
- Indigo/dark blue = Compression (low volatility)
- Purple = Expansion (normal volatility)
- Magenta/pink = Velocity (high volatility)
Bar Colors: Reflect signal strength divergence. Brighter colors indicate stronger directional bias.
Triangle Markers: Entry signals. Up triangles below bars = long entry. Down triangles above bars = short entry.
Dashboard (top-right): Real-time display of regime, ATR%, signal strengths, position status, stops, targets, and risk metrics.
Step 3: Interpret the Dashboard
Regime: Current volatility classification (Compression/Expansion/Velocity)
ATR%: Normalized volatility as percentage of price
Long/Short Strength: Current composite signal scores (0-100)
Cycle Osc: Price deviation from 55-period EMA as percentage
Dominance: BTC.D slope and filter status
Position: Current position direction or "Flat"
Stop/Target: Current stop loss and take profit levels
Kill Switch: Status of drawdown protection
Volume Z: Current volume z-score
Impulse: Whether volume impulse condition is met
Step 4: Adjust Parameters for Your Needs
For more conservative trading: Increase "Minimum Composite Signal Strength" to 65 or higher
For more aggressive trading: Decrease to 50 (but expect more false signals)
For higher timeframes (15m+): Increase "Structure Break Window" to 12-15, increase "RSI Momentum Trigger" to 58
For lower liquidity pairs: Increase "Volume Impulse Multiplier" to 1.3, increase slippage in strategy properties
To disable short selling: Uncheck "Enable Short Structure"
To disable BTC dominance filter: Uncheck "BTC Dominance Confirmation"
STRATEGY PROPERTIES (BACKTEST SETTINGS)
These are the exact settings used in the strategy's Properties dialog box. You must use these same settings when evaluating the backtest results shown in the publication:
Initial Capital: $100,000
Justification: This amount is higher than typical retail accounts. I chose this value to demonstrate percentage-based returns that scale proportionally. The strategy uses percentage-based position sizing (0.65% risk per trade), so a $10,000 account would see the same percentage returns with 10x smaller position sizes. The absolute dollar amounts in the backtest should be interpreted as percentages of capital.
Commission: 0.04% (commission_value = 0.04)
Justification: This reflects typical perpetual futures exchange fees. Major exchanges charge between 0.02% (maker) and 0.075% (taker). The 0.04% value is a reasonable middle estimate. If your exchange charges different fees, adjust this value accordingly. Higher fees will reduce net profitability.
Slippage: 1 tick
Justification: This is conservative for liquid pairs like BTC/USDT on major exchanges during normal conditions. For less liquid altcoins or during high volatility, actual slippage may be higher. If you trade less liquid pairs, increase this value to 2-3 ticks for more realistic results.
Pyramiding: 1
Justification: No position stacking. The strategy holds only one position at a time. This simplifies risk management and prevents overexposure.
calc_on_every_tick: true
Justification: The strategy evaluates on every price update, not just bar close. This is necessary for scalping timeframes where waiting for bar close would miss opportunities. Note that this setting means backtest results may differ slightly from bar-close-only evaluation.
calc_on_order_fills: true
Justification: The strategy recalculates immediately after order fills for faster response to position changes.
RISK PER TRADE JUSTIFICATION
The default risk per trade is 0.65% of equity. This is well within the TradingView guideline that "risking more than 5-10% on a trade is not typically considered viable."
With the 12% maximum exposure cap, even if the strategy takes multiple consecutive losses, the total risk remains manageable. The kill switch at 6.5% drawdown provides additional protection by halting new entries during adverse conditions.
The position sizing formula ensures that stop distance (which varies by regime) is accounted for, so actual risk per trade remains approximately 0.65% regardless of volatility conditions.
SAMPLE SIZE CONSIDERATIONS
For statistically meaningful backtest results, you should select a dataset that generates at least 100 trades. On 5-minute BTC/USDT charts, this typically requires:
2-3 months of data during normal market conditions
1-2 months during high-volatility periods
3-4 months during low-volatility consolidation periods
The strategy's selectivity (requiring 55+ composite score plus all filters) means it generates fewer signals than less filtered approaches. If your backtest shows fewer than 100 trades, extend the date range or reduce the minimum signal strength threshold.
Fewer than 100 trades produces statistically unreliable results. Win rate, profit factor, and other metrics can vary significantly with small sample sizes.
STRATEGY DESIGN COMPROMISES AND LIMITATIONS
Every strategy involves trade-offs. Here are the compromises made in this design and the limitations you should understand:
Selectivity vs. Opportunity Trade-off
The 55-point minimum threshold filters many potential trades. This reduces false signals but also misses valid setups that don't meet all criteria. Lowering the threshold increases trade frequency but decreases win rate. There is no "correct" threshold; it depends on your preference for fewer higher-quality signals vs. more signals with lower individual quality.
Regime Classification Lag
The ATR-based regime detection uses historical data (21 periods + 13-period smoothing). It cannot predict sudden volatility spikes. During flash crashes or black swan events, the strategy may be classified in the wrong regime for several bars before the classification updates. This is an inherent limitation of any lagging indicator.
Indicator Parameter Sensitivity
The default parameters (MACD 8/21/5, EMA 8/21/34, RSI 21, etc.) are tuned for BTC/ETH perpetuals on 5-minute charts during 2024 market conditions. Different assets, timeframes, or market regimes may require different parameters. There is no guarantee that parameters optimized on historical data will perform similarly in the future.
BTC Dominance Filter Limitations
The CRYPTOCAP:BTC.D data feed may lag during low-liquidity periods or weekends. The dominance slope calculation uses a 5-bar SMA, adding additional delay. If you notice the filter behaving unexpectedly, consider disabling it.
Backtest vs. Live Execution Differences
TradingView backtesting does not replicate actual broker execution. Key differences:
Backtests assume perfect fills at calculated prices; real execution involves order book depth, latency, and partial fills
The calc_on_every_tick setting improves backtest realism but still cannot capture sub-bar price action or order book dynamics
Commission and slippage settings are estimates; actual costs vary by exchange, time of day, and market conditions
Funding rates on perpetual futures are not modeled in backtests and can significantly impact profitability over time
Exchange-specific limitations (position limits, liquidation mechanics, order types) are not modeled
Market Condition Dependencies
This strategy is designed for trending and breakout conditions. During extended sideways consolidation with no clear direction, the strategy may generate few signals or experience whipsaws. No strategy performs well in all market conditions.
Cryptocurrency-Specific Risks
Cryptocurrency markets operate 24/7 without session boundaries. This means:
No natural "overnight" risk reduction
Volatility can spike at any time
Liquidity varies significantly by time of day
Exchange outages or issues can occur at any time
WHAT THIS STRATEGY DOES NOT DO
To be straightforward about limitations:
This strategy does not guarantee profits. Past backtest performance does not indicate future results.
This strategy does not predict the future. It reacts to current conditions based on historical patterns.
This strategy does not account for funding rates, which can significantly impact perpetual futures profitability.
This strategy does not model exchange-specific execution issues (partial fills, requotes, outages).
This strategy does not adapt to fundamental news events or black swan scenarios.
This strategy is not optimized for all market conditions. It may underperform during extended consolidation.
IMPORTANT RISK WARNINGS
Past performance does not guarantee future results. The backtest results shown reflect specific historical market conditions and parameter settings. Markets change constantly, and strategies that performed well historically may underperform or lose money in the future. A single backtest run does not constitute proof of future profitability.
Trading involves substantial risk of loss. Cryptocurrency derivatives are highly volatile instruments. You can lose your entire investment. Only trade with capital you can afford to lose completely.
This is not financial advice. This strategy is provided for educational and informational purposes only. It does not constitute investment advice, trading recommendations, or any form of financial guidance. The author is not a licensed financial advisor.
You are responsible for your own decisions. Before using this strategy with real capital:
Thoroughly understand the code and logic by reading the open-source implementation
Forward test with paper trading or very small positions for an extended period
Verify that commission, slippage, and execution assumptions match your actual trading environment
Understand that live results will differ from backtest results
Consider consulting with a qualified financial advisor
No guarantees or warranties. This strategy is provided "as is" without any guarantees of profitability, accuracy, or suitability for any purpose. The author is not responsible for any losses incurred from using this strategy.
OPEN-SOURCE CODE STRUCTURE
The strategy code is organized into these sections for readability:
Configuration Architecture: Input parameters organized into logical groups (Core Controls, Optimization Constants, Regime Intelligence, Signal Pathways, Risk Architecture, Visualization)
Helper Functions: calcQty() for position sizing, clamp01() and normalize() for value normalization, calcMFI() for Money Flow Index calculation
Core Indicator Engine: EMA ribbon, ATR and regime classification, MACD with adaptive baseline, RSI, MFI, volume analytics, cycle oscillator, BTC dominance filter, squeeze detection
Signal Pathway Logic: Trend break, momentum surge, squeeze release, micro pullback pathways with composite scoring
Entry/Exit Orchestration: Signal filtering, position sizing, entry execution, stop/target calculation, trailing stop logic, momentum fail-safe exits
Visualization Layer: EMA plots, regime background, bar coloring, signal labels, dashboard table
You can read and modify any part of the code. Understanding the logic before deployment is strongly recommended.
- Made with passion by officialjackofalltrades
Tradingview

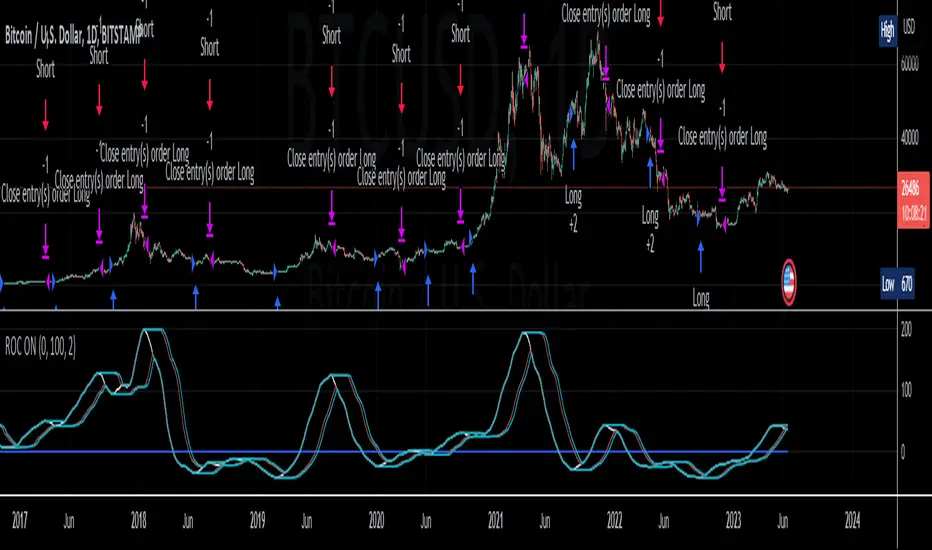
Heikin Ashi ROC Percentile Strategy**User Guide for the "Heikin Ashi ROC Percentile Strategy"**
This strategy, "Heikin Ashi ROC Percentile Strategy", is designed to provide an easy-to-use framework for trading based on the Heikin Ashi Rate of Change (ROC) and its percentiles.
Here's how you can use it:
1. **Setting the Start Date**: You can set the start date for the strategy in the user inputs at the top of the script. The variable `startDate` defines the point from which the script begins executing trades. Simply input the desired date in the format "YYYY MM DD". For example, to start the strategy from March 3, 2023, you would enter `startDate = timestamp("2023 03 03")`.
2. **Adjusting the Midline, Lookback Period, and Stop Loss Level**: The `zerohLine`, `rocLength`, and `stopLossLevel` inputs allow you to adjust the baseline for ROC, the lookback period for the SMA and ROC, and the level at which the strategy stops the loss, respectively. By tweaking these parameters, you can fine-tune the strategy to better suit your trading style or the particular characteristics of the asset you are trading.
3. **Understanding the Trade Conditions**: The script defines conditions for entering and exiting long and short positions based on crossovers and crossunders of the ROC and the upper and lower "kill lines". These lines are defined as certain percentiles of the ROC's highest and lowest values over a specified lookback period. When the ROC crosses above the lower kill line, the script enters a long position; when it crosses below the upper kill line, it exits the position. Similarly, when the ROC crosses below the upper kill line, the script enters a short position; when it crosses above the lower kill line, it exits the position.
In my testing, this strategy performed best on a day and hour basis. However, I encourage you to experiment with different timeframes and settings to see how the strategy performs under various conditions. Remember, there's no one-size-fits-all approach to trading; what works best will depend on your specific circumstances, goals, and risk tolerance.
If you find other useful applications for this strategy, please let me know in the comments. Your feedback is invaluable in helping to refine and improve this tool. Happy trading!
Short Selling EMA Cross (By Coinrule)BINANCE:AVAXUSDT
This short selling script works best in periods of downtrends and general bearish market conditions, with the ultimate goal to sell as the the price decreases further and buy back before a rebound.
This script can work well on coins you are planning to hodl for long-term and works especially well whilst using an automated bot that can execute your trades for you. It allows you to hedge your investment by allocating a % of your coins to trade with, whilst not risking your entire holding. This mitigates unrealised losses from hodling as it provides additional cash from the profits made. You can then choose to to hodl this cash, or use it to reinvest when the market reaches attractive buying levels.
Entry
The exponential moving average ( EMA ) 20 and EMA 50 have been used for the variables determining the entry to the short. EMAs can operate better than simple moving averages due to the additional weighting placed on the most recent data points, whereas simple moving averages weight all the data the same. This means that price is tracked more closely and the most recent volatile moves can be captured and exploited more efficiently using EMAs.
Our backtesting data revealed that the most profitable timeframe was the 30-minute timeframe, this also enabled a good frequency of trades and high profitability.
A fast (shorter term) exponential moving average , in this strategy the EMA 20, crossing under a slow (longer term) moving average, in this example the EMA 50, signals the price of an asset has started to trend to the downside, as the most recent data signals price is declining compared to earlier data. The entry acts on this principle and executes when the EMA 20 crosses under the EMA 50.
Enter Short: EMA 20 crosses under EMA 50.
Exit
This script utilises a take profit and stop loss for the exit. The take profit is set at -8% and the stop loss is set at +16% from the entry price. This would normally be a poor trade due to the risk:reward equalling 0.5. However, when looking at the backtesting data, the high profitability of the strategy (93.33%) leads to increased confidence and showcases the high probability of success according to historical data.
The take profit (-8%) and the stop loss (+16%) of the strategy are widely placed to ensure the move is captured without being stopped out due to relief rallies. The stop loss also plays a role of mitigating losses and minimising risk of being stuck in a short position once there has been a fundamental trend reversal and the market has become bullish .
Exit Short: -8% price decrease from entry price.
OR
Exit Short: +16% price increase from entry price.
Tip: Research what coins have consistent and large token unlocks / highly inflationary tokenomics, and target these during bear markets to short as they will most likely have substantial selling pressure that outweighs demand - leading to declining prices.
The strategy assumes each order is using 30% of the available coins to make the results more realistic and to simulate you only ran this strategy on 30% of your holdings. A trading fee of 0.1% is also taken into account and is aligned to the base fee applied on Binance.
The backtesting data was recorded from December 1st 2021, just as the market was beginning its downtrend. We therefore recommend analysing the market conditions prior to utilising this strategy as it operates best on weak coins during downtrends and bearish conditions.

4H CCI Strategy 1.5Included adaptive lot size based on ATR, and also ATR based stop and take profit levels.
Risk/reward increased to 1:2 and should work in all ranging FX pairs as long as they are not trending.
Once the market starts trending it'll eat this bot alive.
Cheers,
Ivan Labrie
Time at Mode FX
