Market Range OracleMarket Range Oracle is an advanced volatility-adaptive projection tool designed to help traders anticipate future price behaviour, identify probabilistic ranges, and understand how markets historically expand or contract from the price open.
📊 By analysing historical bar-to-bar performance, ATR-filtered volatility, and fast-RSI momentum, the indicator creates a complete forward-looking range map for any timeframe.
📈 What Market Range Oracle Does
Calculates Expected Price Movement From the Open for any selected timeframe, the indicator measures thousands of past bars (or your chosen lookback) to determine:
Average % Gain
Average % Loss
Max Adjusted Gain (ATR-filtered projected peaks)
Max Adjusted Loss (ATR-filtered projected troughs)
Rate of green and red candle closes in the selected lookback period
Projected price levels for all of the above
These projections are then plotted directly on the chart or drawn as offset lines with detailed labels, all the colours, text size, show/hide elements are customisable from the indicator dashboard.
🧠 How does work and how to use it
The indicator computes projections across three independent timeframes:
Plots Timeframe — where visual projection bands are drawn
Lines & Labels Timeframe — creates separate-TF projection levels & labels
Forecast Timeframe — allows forward bar forecasting for the next candle
Forecast projections (when enabled) can be used to show the next future candle of any timeframe.
Example 1: Plots Timeframe set to current timeframe and the Forecast Timeframe option to the same timeframe, this will show an adaptive range moving with the price for current timeframe.
Example 2 : Find the potential Future range long term, the current timeframe is an weekly and we set the Forecast Timeframe to 2 weeks, as want to see potential top and bottom range for the next 2 weeks
Example 3 : Scalping with Market Range Oracle - Set the Bands to current timeframe and set the Projections lines and labels to a higher timeframe (in our case 15 minutes and a 4h)
⚡ Momentum Overlay (Fast RSI Hybrid)
A fast-RSI (RSI-2) colour code system measures short-term momentum and the top and bottom of the ranges display momentum.
Also the middle RSI 50 value equivalent EMA shows directional bias visualized with colour-shifting dashed line on the chart to help traders with clear trend direction.
🔔 Built-In Alert System
Alerts trigger on Price-Level Events and on momentum shift:
Price reaches projected Avg Loss
Price reaches projected Max Gain
Price reaches projected Max Loss
Midpoint Cross Events
Price crosses above mid-range
Price crosses below mid-range
Fast RSI bullish momentum
Fast RSI bearish momentum
Fast RSI strong bullish spike
Fast RSI strong bearish spike
🧩 Market Range Oracle is ideal for scalping, day-trading, swing trading, and position traders.
💬 Notes
Market Range Oracle does not predict future price — it projects statistically probable ranges based on historical behaviour and volatility. It is a decision-support tool to help traders navigate expected expansion from the open.
Tradingrange

[INVX] Trading Range
Trading Range
The “ Trading Range” indicator visualizes short-term price ranges (typically 1–2 days) based on statistical percentiles of high and low prices relative to the previous day’s close. It provides a clear view of potential support and resistance zones and includes optional EMA overlays for trend context.
Concept & Calculation
Uses the previous daily close as a reference point.
Calculates percentile-based levels for highs and lows over a configurable lookback period.
Plots two resistance zones and two support zones as shaded areas.
Includes up to 3 optional EMA lines for trend visualization.
Trading range zones are designed for daily-based calculations. If the indicator is applied to a chart timeframe larger than 1 day (e.g., weekly, monthly), the trading range zones will not be displayed.
Key Features
Short-Term Trading Range:
Displays zones that reflect short-term price behavior (1–2 days).
Percentile-Based Levels:
Levels are calculated using percentile interpolation for highs and lows.
Historical Lines Option:
Toggle to show past levels for context.
Realtime Calculation update:
Update calculations dynamically with the current bar.
EMA Overlay:
Up to three customizable EMA lines for trend analysis.
Display Line Values:
Option to show level values on the chart with adjustable label size.
Trading Range Settings
Historical Lines: Show or hide past support/resistance levels.
Realtime Calculation: Enable or disable real-time updates.
Display Line Values: Show numeric values for levels.
Size: Adjust label size when values are displayed.
EMA Line Settings
Enable/disable each EMA line.
Configure length and color for each EMA.
Usage Tips
Use the shaded zones as visual reference areas for short-term price interaction.
Combine with other tools such as trend indicators or volume analysis to strengthen the analysis.
Historical lines can help assess how price has reacted to these zones in the past.
Limitations & Disclaimer
This indicator is provided for informational purposes only. It does not constitute financial advice or a recommendation to buy or sell any asset.
Market conditions, asset volatility, and timeframe selection may significantly affect indicator performance.
Users should always validate signals with additional analysis and apply appropriate risk management strategies.
Past performance is not indicative of future results. Use indicator at your own discretion and risk.
Under no circumstances shall InnovestX be liable for any loss or damage you or anyone else incur as a result of any trading or investment activity that you or anyone else engages in based on any information or material you receive through InnovestX or TradingView.

FOREXSOM Session Boxes (Local Time) — Asian, London & New YorkFOREXSOM Session Boxes (Local Time) highlights the three major Forex sessions — Asian, London, and New York — using your chart’s local timezone automatically.
This indicator helps traders visualize market structure, liquidity zones, and timing across global trading hours with accuracy and clarity.
Key Features
Automatically adjusts to your chart’s local timezone
Highlights Asian, London, and New York sessions with clean color zones
Works on all timeframes and asset classes
Ideal for Smart Money Concepts (SMC), ICT, and price action strategies
Helps identify range breakouts, session highs/lows, and liquidity grabs
How It Works
Each session box updates in real time to show the current range as the market develops.
The boxes reset at the end of each session, making it easy to compare volatility and liquidity shifts between regions.
Sessions (default times):
Asian: 17:00 – 03:00
London: 02:00 – 11:00
New York: 07:00 – 16:00
How to Use
Add the indicator to your chart.
Ensure your chart timezone matches your local time in chart settings.
Watch session ranges form and look for liquidity sweeps or breakouts between overlaps (London/New York).
Created by FOREXSOM
Empowering traders worldwide with precision-built tools for Smart Money and institutional trading education.

Trading StreetTrading Street Indicator
Trading Street is a comprehensive trading indicator that combines session timing analysis with technical trend analysis. It provides traders with visual cues for optimal trading times and market direction, making it perfect for forex and crypto trading.
Key Features
🕐 Trading Session Detection
Asia Session: 05:30 - 14:30 IST (Indian Standard Time)
London Session: 12:30 - 20:30 IST
New York Session: 18:30 - 02:30 IST (overnight)
Visual Session Backgrounds: Each session is highlighted with distinct colors
Session Overlap Handling: Smart precedence system (NY > London > Asia)
📊 Technical Analysis
50 EMA (Exponential Moving Average): Default golden line for trend analysis
Customizable EMA: Adjustable length (1-200 periods)
Trend Background: Green when price > EMA (bullish), Red when price < EMA (bearish)
Visual Trend Signals: Background colors change based on price vs EMA relationship
🎨 Customization Options
Session Colors: Customize Asia (green), London (blue), New York (orange)
EMA Settings: Adjust color, width, and length
Transparency Control: Adjust background opacity (0-100%)
Individual Toggles: Turn sessions and EMA on/off independently
How to Use
For Session Trading:
Identify Active Sessions: Look for colored backgrounds indicating active trading sessions
Session Overlaps: London-New York overlap (18:30-20:30 IST) is typically high volatility
Session Transitions: Watch for session changes for potential breakout opportunities
For Trend Analysis:
EMA Trend: Golden EMA line shows overall market direction
Background Colors:
Green background = Bullish trend (price above EMA)
Red background = Bearish trend (price below EMA)
Trend Confirmation: Use EMA alignment with session timing for better entries
Trading Strategy:
Session + Trend Alignment: Best trades when session activity aligns with EMA trend
Session Transitions: Look for breakouts during session changes
High Volatility Periods: London-New York overlap often provides best opportunities
Settings
Session Settings:
Show Asia Session: Toggle Asia session background
Show London Session: Toggle London session background
Show New York Session: Toggle New York session background
Background Transparency: Adjust opacity (0-100%)
EMA Settings:
Show EMA: Toggle EMA line on/off
EMA Length: Adjust period (1-200, default: 50)
EMA Color: Customize line color
EMA Line Width: Adjust thickness (1-4)
Best Timeframes
Recommended: 15M, 1H, 4H, Daily
Best for: Forex pairs, Crypto, Major indices
Optimal Use: Combine with price action and support/resistance levels
Pro Tips
Session Awareness: Trade during active sessions for better liquidity
Trend Confirmation: Use EMA trend to confirm session-based setups
Risk Management: Avoid trading during low-activity periods
Multi-Timeframe: Use on higher timeframes for trend, lower for entries
Technical Details
Pine Script Version: v5
Overlay: True (displays on main chart)
Timezone: IST (Indian Standard Time)
Compatibility: All TradingView instruments
Perfect for traders who want to combine session timing with technical analysis for better trading decisions! 🚀

TrendCylinder (Expo)█ Overview
The TrendCylinder is a dynamic trading indicator designed to capture trends and volatility in an asset's price. It provides a visualization of the current trend direction and upper and lower bands that adapt to volatility changes. By using this indicator, traders can identify potential breakouts or support and resistance levels. While also gauging the volatility to generate trading ranges. The indicator is a comprehensive tool for traders navigating various market conditions by providing a sophisticated blend of trend-following and volatility-based metrics.
█ How It Works
Trend Line: The trend line is constructed using the closing prices with the influence of volatility metrics. The trend line reacts to sudden price changes based on the trend factor and step settings.
Upper & Lower Bands: These bands are not static; they are dynamically adjusted with the calculated standard deviation and Average True Range (ATR) metrics to offer a more flexible, real-world representation of potential price movements, offering an idea of the market's likely trading range.
█ How to Use
Identifying Trends
The trend line can be used to identify the current market trend. If the price is above the trend line, it indicates a bullish trend. Conversely, if the price is below the trend line, it indicates a bearish trend.
Dynamic Support and Resistance
The upper and lower bands (including the trend line) dynamically change with market volatility, acting as moving targets of support and resistance. This helps set up stop-loss or take-profit levels with a higher degree of accuracy.
Breakout vs. Reversion Strategies
Price movements beyond the bands could signify strong trends, making it ideal for breakout strategies.
Fakeouts
If the price touches one of the bands and reverses direction, it could be a fakeout. Traders may choose to trade against the breakout in such scenarios.
█ Settings
Volatility Period: Defines the look-back period for calculating volatility. Higher values adapt the bands more slowly, whereas lower values adapt them more quickly.
Trend Factor: Adjusts the sensitivity of the trend line. Higher values produce a smoother line, while lower values make it more reactive to price changes.
Trend Step: Controls the pace at which the trend line adjusts to sudden price movements. Higher values lead to a slower adjustment and a smoother line, while lower values result in quicker adjustments.
-----------------
Disclaimer
The information contained in my Scripts/Indicators/Ideas/Algos/Systems does not constitute financial advice or a solicitation to buy or sell any securities of any type. I will not accept liability for any loss or damage, including without limitation any loss of profit, which may arise directly or indirectly from the use of or reliance on such information.
All investments involve risk, and the past performance of a security, industry, sector, market, financial product, trading strategy, backtest, or individual's trading does not guarantee future results or returns. Investors are fully responsible for any investment decisions they make. Such decisions should be based solely on an evaluation of their financial circumstances, investment objectives, risk tolerance, and liquidity needs.
My Scripts/Indicators/Ideas/Algos/Systems are only for educational purposes!

TriexDev - Liquidation Rekt LevelsTriexDev - Liquidation Rekt Levels TradingView Indicator
A basic indicator which lets you see where positions will be liquidated. Each line is based on default leverage levels typically used for trading. (3x,5x,10x,25x,50x)
Have a subtle 'label prompt' on the 3x - because I had noticed some people didn't understand what labels were in other indicators.
In the settings:
- There is an offset to adjust the levels horizontally, this is to help make it easier to track if the chart has hit liquidation positions.
- You can change colours/opacity of the lines.
- You can hide the 'Labels', and/or 'label prompt'
- In the 'Style' tab you can hide individual levels.
Inspired/initially based off 'Mex Rekt Level'
I often have this added to my charts, and toggle visibility when I want to check the liq levels.
GitHub Repo for tidier/more detailed documentation as it is updated.

Range & Trend (Zeiierman)█ Overview
Range & Trend (Zeiierman) is a trend-first mapping of price that fuses an adaptive Range & Trend Line, a Trend Buffer (noise gate), a volatility-aware Trend Tracker, and optional Range Levels & Candles to reveal where trend is establishing, compressing, or handing off to a ranged regime.
Execution is guided by graded Buy/Sell labels (Regular / Plus / Strong), structural HH/HL & LL/LH markers with optional Peak Profit readouts, and a multi-TF Timeframe Scanner for alignment.
⚪ Why This One Is Unique
Unlike single-source trend lines, this version layers two orthogonal stabilizers:
a Range & Trend core that adapts its band size to volatility and dispersion, and
a dynamic smoothing buffer that dampens insignificant fluctuations, ensuring only meaningful trend movements affect signal output.
Signals are graded (Regular / Plus / Strong) based on contextual conditions, allowing traders to gauge the conviction behind each trend event. Range Candles add regime context by coloring bars only when a statistically consistent range structure forms, highlighting potential consolidation or transitional market phases. A lightweight Timeframe Scanner completes the workflow, broadcasting alignment from intraday to daily without adding chart clutter.
█ Main features
⚪ Range & Trend Line – Signal Generator
Adaptive directional mapping forms the foundation of the system. It highlights the active trend through color transitions and generates graded Buy/Sell labels (Regular / Plus / Strong) to reflect the strength of confirmation. The line responds dynamically to volatility, revealing when momentum is expanding, stabilizing, or reversing.
Unlike typical reactive signal tools, this model isolates only the most strong and meaningful trend transitions — those with the structural weight to establish or extend a new long-term directional phase. Each signal represents a filtered, high-conviction shift rather than a short-term fluctuation.
⚪ Trend Buffer (Noise Gate)
A precision filter that smooths the core trend output and suppresses false flips caused by short-term noise. It enhances visual consistency and provides the confirmation layer used to promote Regular signals to Plus strength when agreement occurs between buffer and core.
⚪ Trend Tracker
A trailing validation line that tracks directional health and trend persistence. It advances only in the direction of the active move, creating an adaptive stop-like reference. Tracker alignment helps identify trend exhaustion and contributes to Strong-grade signal confirmation.
⚪ Range Levels & Candles
Contextual zones that identify periods of compression or balance. When a valid range forms, candles are shaded within it, distinguishing ranging environments from trending conditions. These zones help anticipate breakouts and define natural support and resistance areas.
⚪ Live Structure (HH/HL & LL/LH with Peak Profit)
Displays real-time structural evolution — Higher Highs/Lows during uptrends and Lower Highs/Lows during downtrends. The optional Peak Profit label shows performance since the last regime change, offering an immediate view of current trend efficiency.
⚪ Timeframe Scanner
A compact multi-timeframe alignment panel that visualizes bullish or bearish trend states across user-selected intervals. It provides fast confirmation of directional consensus, helping traders act only when the broader structure supports their chosen bias.
█ How to Use
⚪ Range & Trend Line – Signal Generator
The Range & Trend Line is the core signal engine — its color shifts mark confirmed directional changes. This is where the system produces the graded Buy/Sell signals shown as ▲ / ▼ labels. Each grade reflects how many internal layers agree at the moment of signal creation:
Regular (▲ / ▼) – Triggered by a confirmed flip in the Range & Trend core. It appears when the base trend direction changes and is the earliest signal of potential reversal.
Plus (▲ + / ▼ +) – Requires the Trend Buffer to confirm the same direction. This upgrade indicates stronger trend agreement and higher reliability.
Strong (▲ ++ / ▼ ++) – These are high-conviction continuation signals and typically occur after structural confirmation.
How to trade them: Regular signals provide early awareness; Plus signals suggest confirmation; Strong signals mark trend maturity or high-probability continuations. Always trade in the direction of the prevailing trend. Use the Trend Buffer or Live Structure to confirm the dominant directional bias before acting on a signal.
⚪ Support and Resistance
The Range & Trend Line and the Buffer Line can act as dynamic support and resistance zones. Price often reacts around these levels, confirming whether the current move is continuing or losing strength.
Look for confirmation or rejection signals near these lines. Reactions around them often mark key decision points within the active trend.
⚪ Range Levels & Candles
Highlights when price enters structured consolidation zones. Candle coloring activates only inside validated ranges, helping to identify areas that show the typical characteristics of a ranging market. These zones visually separate balanced conditions from active trends and provide context for potential transitions.
Watch how price reacts around the upper and lower range levels. Look for false or confirmed breakouts, and expect price to move between these boundaries until a clear breakout develops. Range edges can also serve as practical entry or stop zones.
█ How It Works
⚪ Range & Trend Core
The main engine that defines the chart’s directional trend line. It adapts to changing market conditions, showing a smooth and reliable view of trend strength and direction.
Calculation: Builds a range-adaptive structure whose width adjusts with current volatility. The core moves toward new highs or lows but limits pullbacks to avoid false shifts. Several smoothing methods work together to create a steady, low-lag trend path.
⚪ Trend Buffer (Noise Gate)
A stabilizing layer that keeps the main trend line steady when price noise increases. It improves visual clarity and helps confirm true direction before a trend update appears.
Calculation: Uses a feedback-based update that reacts more when movement is strong and less when noise dominates. This lets the buffer ignore minor fluctuations while staying responsive to real trend changes.
⚪ Trend Tracker
A support line that follows the main move and helps confirm when a trend remains intact. It also serves as a guide for managing active positions.
Calculation: Applies a one-way trailing system that only moves in the direction of the trend. The offset adjusts with volatility, keeping a consistent distance that tightens or widens with market energy.
⚪ Buy/Sell Signal Engine (Regular / Plus / Strong)
The signal system that classifies entries by strength and confirmation level. It reacts to real-time trend changes while filtering weak reversals.
Calculation: Detects state flips in the Range & Trend Core, checks for agreement with the buffer, and rates each signal by historical pattern support. Higher-grade signals appear only when several layers confirm continuation strength.
⚪ Range Levels & Candles
Identifies short-term balance zones and highlights candles within those areas. These zones show where price pauses before the next directional move.
Calculation: Finds upper and lower range limits based on recent highs and lows, confirming only when several bars form a stable zone. Candle colors and level lines extend slightly forward to show likely reaction areas.
⚪ Swing Points & Peak Profit
Marks key turning points and measures performance since the last reversal. It helps track the strength and duration of each movement.
Calculation: Keeps a short memory of recent pivots and updates only when a new high or low replaces the last one. The percent distance from the last flip to the current bar defines the live Peak Profit reading.
⚪ Timeframe Scanner & Alert Aggregator
Combines directional data from multiple timeframes into a single view. Alerts trigger only when all selected timeframes agree.
Calculation: Gathers the trend state from each timeframe, converts it to a simple up or down value, and compares the results. When every layer matches your chosen direction, one clear, high-confidence alert is sent.
-----------------
Disclaimer
The content provided in my scripts, indicators, ideas, algorithms, and systems is for educational and informational purposes only. It does not constitute financial advice, investment recommendations, or a solicitation to buy or sell any financial instruments. I will not accept liability for any loss or damage, including without limitation any loss of profit, which may arise directly or indirectly from the use of or reliance on such information.
All investments involve risk, and the past performance of a security, industry, sector, market, financial product, trading strategy, backtest, or individual's trading does not guarantee future results or returns. Investors are fully responsible for any investment decisions they make. Such decisions should be based solely on an evaluation of their financial circumstances, investment objectives, risk tolerance, and liquidity needs.
유료 스크립트

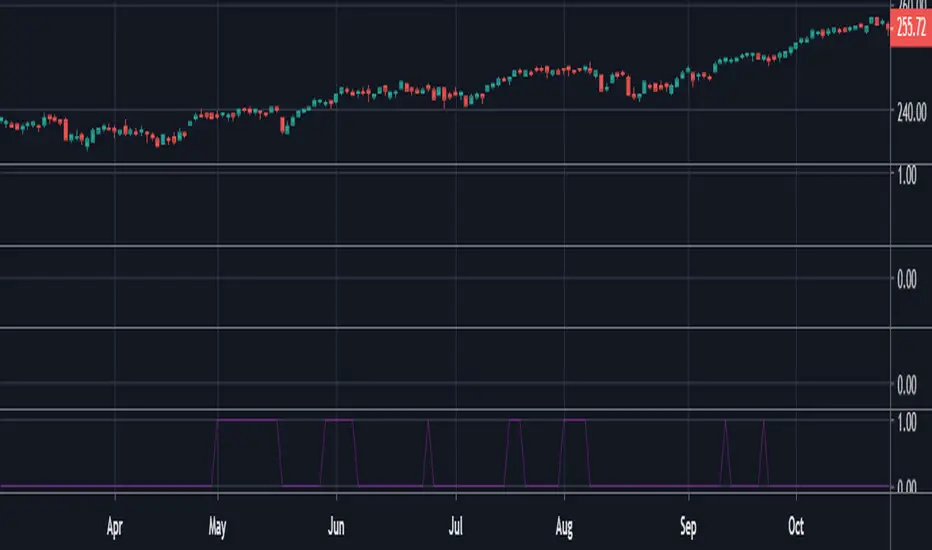
Trading Range Indicator - TRISimple script made to identify trading ranges in any timeframe
The oscillator bounces between 1 and 0. 1 means that the current asset is in a trading range and 0 meaning it is not.
The determination of a trading range is determined by the following:
ATR(14)40 and RSI<60
ADX<25
Due to all 3 having to be fulfilled in order for the oscillator to show there is a trading range, this causes a problem where 2 of the conditions are fulfilled and therefore still shows 0 on the oscillator, however, the asset could very well be in a trading range.
So what in the world do you use this for if there is such a significant margin of error?
Since all 3 conditions need to be fulfilled in order for it to be considered a trading range, this gives a very strong indicator of said trading ranges. So if a person is looking at individual stock tickers or the SPY index ticker, then when the oscillator reads a 1, it could be ideal to open an Iron Condor on said ticker. This means that this indicator is not well suiting for traditional long and short stock positions, but rather it is made for options traders who by using an Iron Condor can make money of a range-bound market.
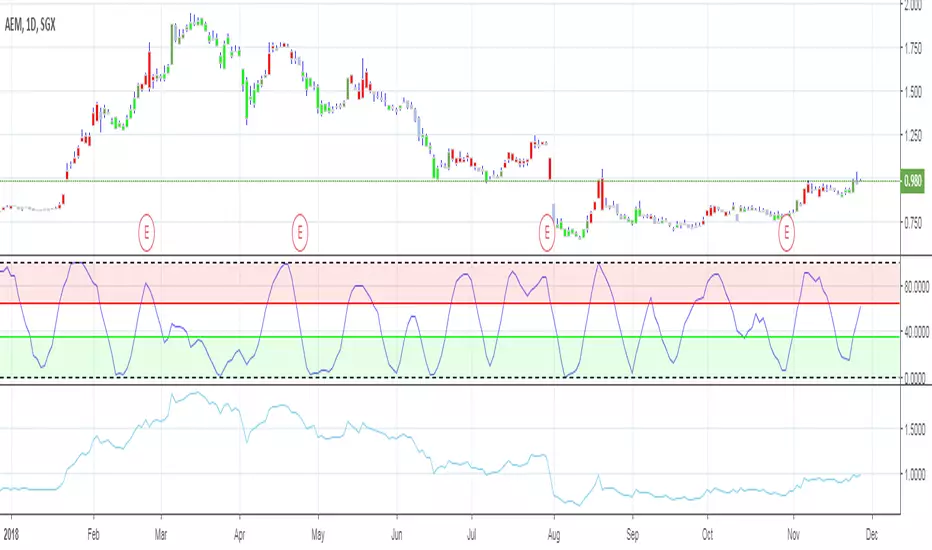
Trading Range ExpansionThis script is trading for the false breakout of the trading range. Once the price makes a break out and get rejected back into the range. The signal triggered for the opposite direction.

The Falcon - My BTC/USDT Strategy 5 min UTHello,
I made a custom indicator, I called it The Falcon because it reacts quickly and knows how to take perspective of the market.
This kind of indicator can be used for manual trading or bots.
About the indicator
In short, it will help you :
Make profit when the market is in trading range
Get in/Get out when a rally begins
Never go against the trend
I based my algorithm on several technical tools such as RSI , emas , for a total of 3 boolean conditions mixed together with AND and OR gates, resulting in those entry/exit points (arrows).
About the Strategy
I only used long entries and exits. No shorting.
It is tested on the last 18 days (the maximum TradingView allows for a 5 min range)
I set a 0.05% commission on each order.
I will grant access to people willing to make a small donation.
Here is my BTC address : 19sVQvCDmVfEACq7BiMnWSMqFPZ8qfSQ2K
If you prefer ETH : 0xc8a5d3a63a05db0c2363ea1c08b37a01cce9ebfb
Send me a Private Message with the ID of the transaction
If you want to do some forward testing first, send me a message.
This script comes with an Alert Setup.
I am also taking commissions if you want me to code something for you, or do some reverse engineering.
Also you can ask me anything in the comments.
Thanks and see you next time !

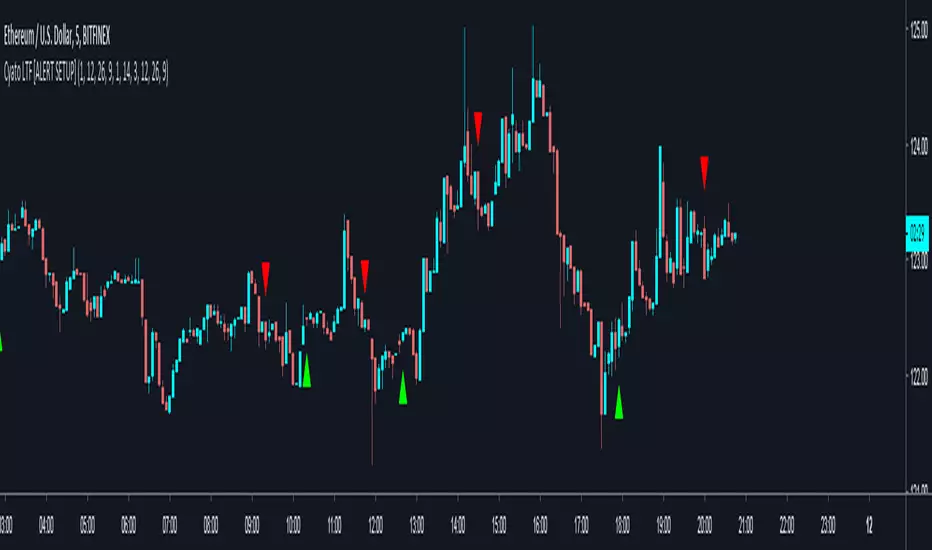
The Falcon - My Custom Indicator and Alert SetupHello,
I made a custom indicator, I called it The Falcon because it reacts quickly and knows how to take perspective of the market. It switches entry and exit conditions depending on wether we are in trading range or in a bullish/bearish trend (difference between green/blue arrows and between red/orange arrows).
This kind of indicator can be used for manual trading or bots.
I will grant access to people willing to make a small donation.
Here is my BTC address : 19sVQvCDmVfEACq7BiMnWSMqFPZ8qfSQ2K
If you prefer ETH : 0xc8a5d3a63a05db0c2363ea1c08b37a01cce9ebfb
Send me a Private Message with the ID of the transaction
If you want to do some forward testing first, send me a message.
I will upload soon a Strategy version of The Falcon with backtesting results.
I am also taking commissions if you want me to code something for you, or do some reverse engineering.
Also you can ask me anything in the comments.
Thanks and see you next time !
Pivot Zones Trading RangesJust testing an advanced Pivot Zones display method with 12 different time frame options. Invite only.
