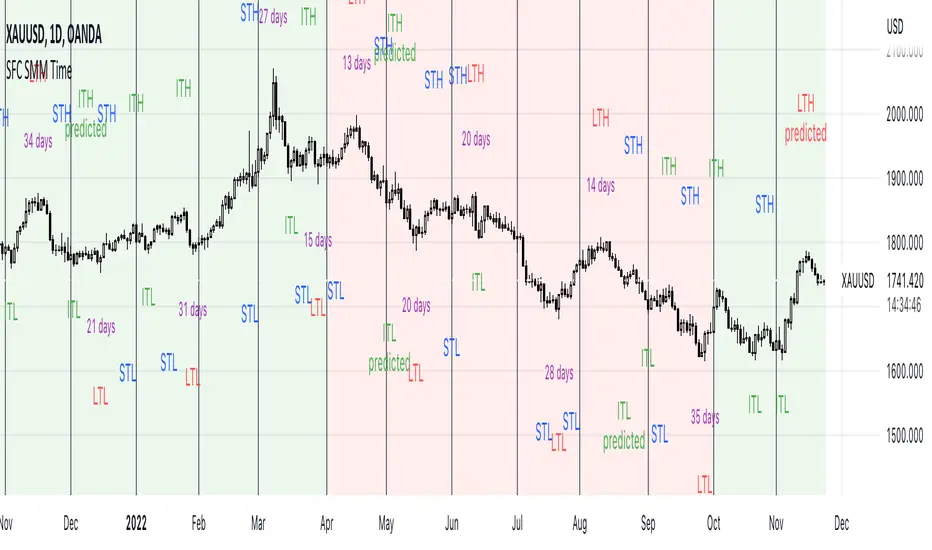
SFC Smart Money Manipulation - Time, Advanced Market StructureThis indicator shows the market structure in more advanced way and different time cycles.
Markets moves in cycles and swings. The indicator will help to determine these cycles and swings by time and price. These are the two columns of the market understanding. The third one is volume/ momentum, but it will not be discussed here.
Advanced Market Structure
According to ICT and Larry Williams Market Structure is not only Highs and Lows.
They present more advanced understanding of the MS:
-Short Term Highs/ Lows
-Intermediate Term Highs/ Lows
-Long Term Highs/ Lows
Rules of how to determine the Swing Points according to Larry Williams:
"A market has made a short-term low when we have a day (or bar if you are using different time periods) that has a higher low on both sides. By the same token a short-term high will be a day (or bar) that has lower bars on both sides of it."
"A short-term high with lower short-term highs on both sides is an intermediate- term high. By the same token, a short-term low with higher short-term lows on both sides is an intermediate-term low."
"An intermediate-term high with lower intermediate-term highs on both sides of it is just naturally a long-term high by our definition, thanks to understanding market structure.
An intermediate-term low with higher intermediate-term lows on both sides of it is just naturally a long-term low by our definition, thanks to understanding market structure."
If the Highs and Lows are labeled properly there is high probability to predict the next High or Low. In this way the trader will know how the current trend is changing and what kind of retracement is coming - deep or shallow.
Timing
Market moves in time cycles.
There is a theory that the swings are equal by time and length. This is not always the case, but very very often.
Indicator time features:
- Swing Trading days - how many time market needed to form a swing. Only Long term(main) Swings are measured. This will help trader to label T-formations.
" T Formations is cyclically related for formations that can be drawn to project the time frame of likely turning points. Basically T-formations are based on the concept that the time distance between the starting low/high of the cyclical wave and its peak is likely to be subsequently repeated between that peak and the final low/high of that cycle."
- Seasonality - theoretically an asset should go up or down in particular yearly quarter. Practically the direction not always match to quarters. Thats why the indicator shows the theoretical seasonal direction and historical real direction.
Seasonal direction is automatically displayed or XAUUSD, XAGUSD, EURUSD, AUDUSD, GBPUSD. There is a ways to set the seasonality manually.
- Earnings Season - This time is very important for Stocks and Indices. Most of the time the assets are in bullish trend during the Earnings Seasons.
- Monthly separator - Shows the monthly time cycle
- Gold bullish months - There are studies on Gold market. They shows that Gold is very bullish in particular months. These are displayed.
The indicator works only on Daily Time Frame.
Trading!
MAGISTR Binary 3 EURUSD 1min The indicator is designed for use in binary options trading.
Designed for TF 1 minute, EURUSD pair (tested on Currency.com exchange instrument).
When the rules of the internal algorithm are triggered, the indicator generates a signal with the probable movement of the instrument on the next bar:
if a green bar appears at the bottom of the bar, it means that the indicator assumes that the next bar should close at a positive price growth value (it will be green) and vice versa, if a red bar appears at the bottom of the bar, then the indicator assumes that the next bar should close at a negative price growth value( will be red), the indicator also generates appropriate alerts about the expected price movement on the next bar.
In addition, the indicator counts the signals issued by it and the success of its processing for the period of time available in TradingView.
This indicator uses a set of values of such basic indicators as:
- Stochastic RSI;
- Bollinger Bands;
- Profile of Volumes;
- CCI;
- ADX;
- momentum;
and others.
I left all the settings "open", so it is quite possible, by slightly changing the parameters, to adjust it to another pair or time frame.
==========================================================================================================================
Индикатор разработан для применения в торговле на бинарных опционах.
Разработан для ТФ 1 минута, пара EURUSD (оттестирован на показателях инструмента биржи Currency.com).
При сработке правил внутреннего алгоритма - индикатор выдает сигнал с вероятным движением инструмента на следующем баре :
если появилась зеленая полоса внизу бара - значит индикатор предполагает, что следующий бар должен закрыться в положительном значении роста цены ( будет зеленым) и наоборот, если появилась красная полоса внизу бара - значит индикатор предполагает, что следующий бар должен закрыться в отрицательном значении роста цены( будет красным) , также индикатор выдает соответствующее оповещения о предполагаемом им движении цены на следующем баре.
Кроме того индикатором ведется подсчета выданных им сигналов и и успеха его отработки за доступный в TradingView период времени.
В данном индикаторе используются комплекс значений таких базовых индикаторов, как:
- Stochastic RSI;
- Bollindgers Bands;
- Profile of Volumes;
- CCI ;
- ADX;
- Momentum ;
и прочие.
Все настройки оставил "открытыми", так что его вполне можно, немного изменив параметры, подстроить под другую пару или тайм-фрейм.

Helicopter!Review
This indicator automatically calculates the best trade entry based on volume and real-time volatility. After the algorithm analyzes the current characteristics of the market, an entry signal is placed on the chart. As a result, the trader can be sure that the signal is based on data analysis. One of the key elements is reverse transactions. A long or short position can be stopped either at a profit or at a small loss without compromising the potential profit.
!Risks
The market is unstable, and it is impossible to know what the future holds for it. The only way to manage risk. You can limit the loss by setting a stop loss of 1% from the entry point. Take profit is recommended to set with a ratio of 1:1, 1:2,1:3, with partial fixation of 40%, 30%, 30%!
!Trading recommendations
Trades are opened when a green arrow appears, selling when a yellow arrow appears. Be sure to wait for the candle to close and the signal to appear (the signal may flash when the candle is formed). Recommended timeframes: 1min, 3min, 15min. The indicator is designed for scalp trades and intradays!
!Technical part
The indicator is based on the EMA 20 and EMA 200 moving averages. It is also based on the open and close of past days, weeks, months.
RSI are used.
RSI is a classic oscillator built on the basis of calculating the relative rate of change in asset prices over a given period.
Additional tools: volume and volatility.
NO REPAINT!
-------------------------------------------------------
Denial of responsibility
The information contained in my Scripts/Indicators/Ideas/Algorithms/Systems does not constitute financial advice or an offer to buy or sell any securities of any kind. I do not accept liability for any loss or damage, including but not limited to any loss of profits that may arise directly or indirectly from the use of or reliance on such information.
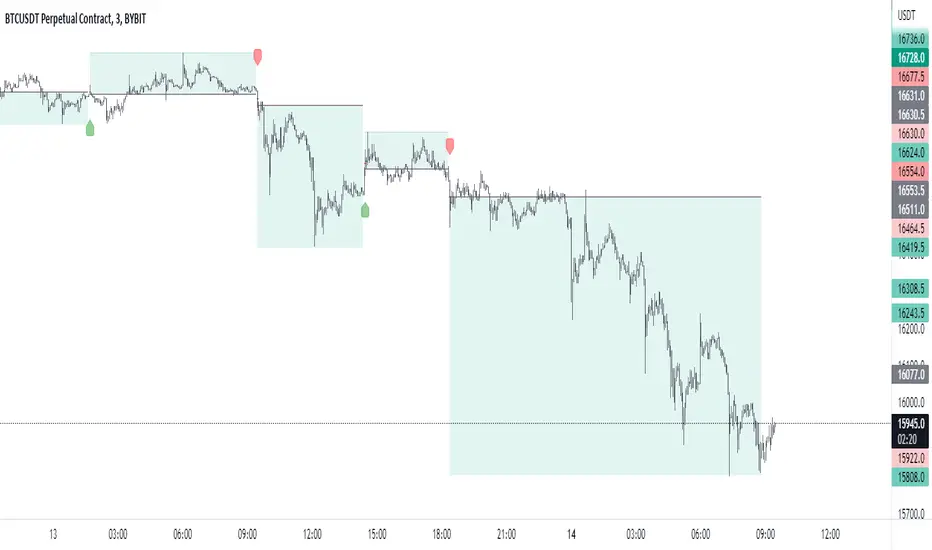
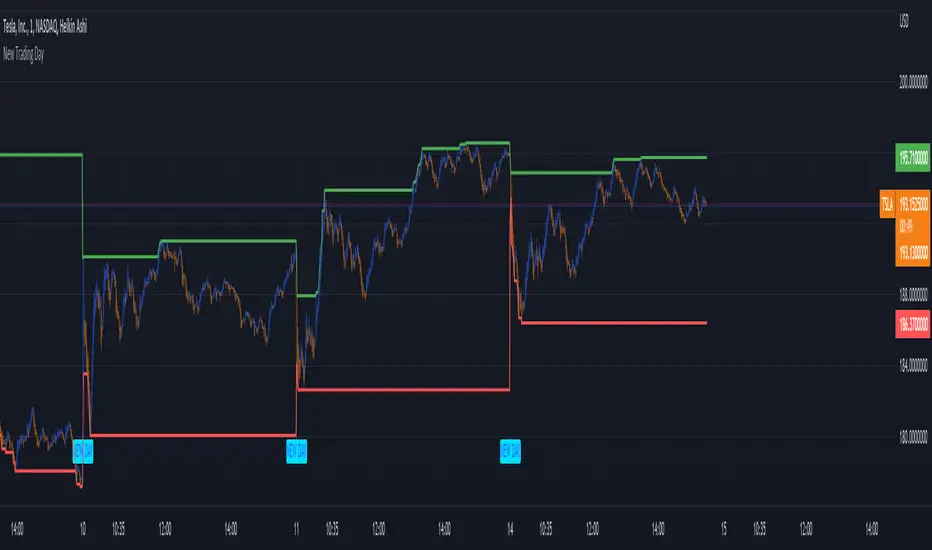
New Trading DayThis indicator creates an alert for a new trading day - as well as contains a variable that counts the number of bars that has passed since the trading day opened.
It posts the alert both on the chart and has an alert condition so it can be sent to you.
Colorful Channelwhat is "Colorful Channel"?
it is a overbought - oversold indicator.
what it does?
It fills the area between the upper band of the channel and the price line with green, the area between the lower band of the channel and the price line with red color and applies a transparency to these colors according to the distance of the price from the channel lines. thus allowing users to get an idea of ??the current value of the price.
how it does it?
subtracts the percentage of the price from the lower channel from the transparency ratio of the red color, and the percentage of the price from the upper band from the transparency ratio of the green color. thus, a different transparency value is obtained for each percentile. In addition, the transparency rate can be changed with a multiplier determined by the users.
how to use it?
In the "lenght" section, you select the number of bars that the indicator will base backwards on. For example, if length=100, the indicator determines the upper and lower bands according to the distances from the highest and lowest values ??within 100 bar. so the length part works like donchian channels.
You can change the transparency ratio of the colors in the "transp" section.
1 saat transp
yan trend
4 saat

ILM Seasonality Big Moves - TableUse this script on Daily Timeframe.
This script calculates Daily Moves ( Intraday / Close basis ) and buckets them into 1% / 2% / 3% moves
Also calculates MAX DD for the financial year from Peak to Trough
Helps in identifying volatility of the instrument and high drawdowns due to volatility

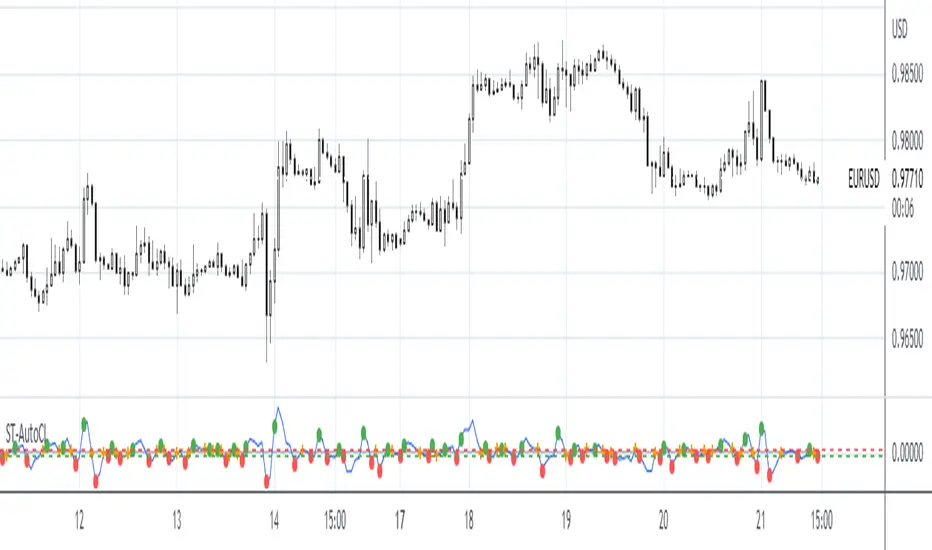
SpreadTrade - Auto-Cointegration (ps5)Decsription: Auto-Cointegration-Based Pair Trading Strategy (revised version)
To review, there are three popular styles of Pair trading: distance-based pair trading, correlation-based pair trading and cointegration-based pair trading. Typically, they require preliminary statistical estimation of the viability of the corresponding strategy.
Basically a pair trade strategy boils down to shorting the outperforming instrument and going long on the underperforming instrument whenever the temporary correlation weakens which means one instrument is going up and another is going down. Apart from the typical cointegration strategy which employs two cointegrated instruments, this script uses just one instrument, in base timeframe and in lagged timeframe, actually making it an auto-cointegration, or better still, an auto-correlation strategy.
Notice that each moving average function may require different Threshold settings.The orange cross symbol indicates the exit points. To filter out the signals use higher values for the LongWindow and the Threshold parameters. Also pay attention that in some cases with some moving averages the color of the signals has to be inverted.
Big Money Flow & Drift Oscillator [Spiritualhealer117]An easy way to track what big money and market makers are doing in the markets. The Big Money Flow & Drift Oscillator is best suited as a trend indicator, estimating what way the market will drift on low volume and what way it will move on large volume.
This oscillator is composed of two lines, the Big Money Flow and Drift Oscillator. The Big Money Flow line gives the average percentage return of the asset when the volume is greater than the EMA of volume, showing that big money is making moves in the market. The Drift Oscillator gives the average percentage return of the asset when the volume is less than the EMA of volume, where pricing is done by small money and market makers.
By default, between the two lines, there is a color fill, determined based on the following logic:
BMF > drift and BMF > 0: Yellow
drift > BMF and drift > 0: Beige
BMF > drift and BMF < 0: Orange
drift > BMF and drift < 0: Red

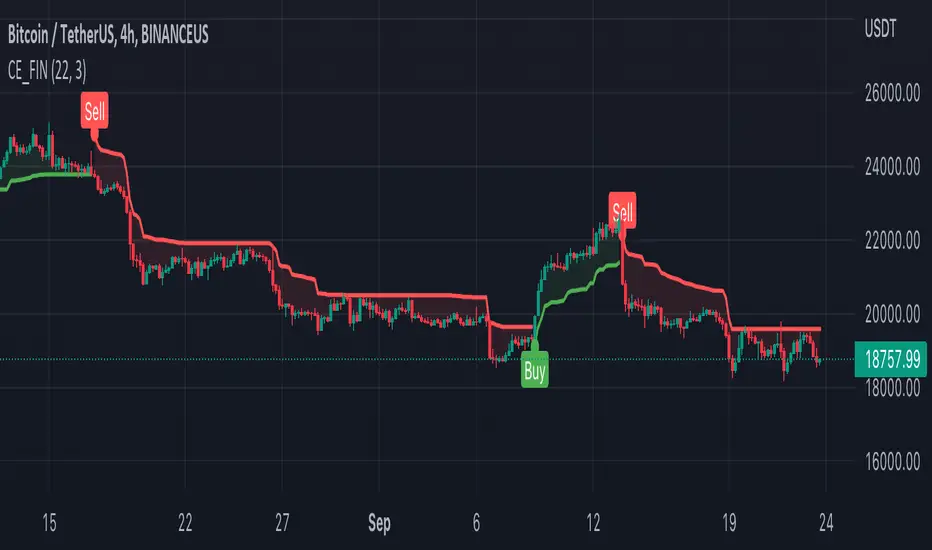
FIN_BOTthis script is just for test,
can be not correct working, is just for now, soon will be better,
this is for test, and it will be prodaction as soon as possible,
Plasse be shur that you don use it as prodaction.
Moving Average Directional IndexMADX is ADX-inspired indicator with moving averages that determines strength of a trend, as well as its direction. Indicator works following:
As the value of MADX increases, so does the strength of a trend
If MADX+ ( green line - bullish MADX ) crosses above MADX- ( red line - bearish MADX ) we consider trend as bullish and vice versa..
There will be situations where MADX- and MADX+ cross multiple times in a short period of time -> that will mean that market indecision is happening and big move will most likely happen after it.
For the calculation of MADX+ and MADX- we need Moving Averages or Exponential Moving Averages with three specific sources ( high, close, low ).
Now, the calculation of each MADX will differ
=> for MADX+: Moving Average (high) / Moving Average (close)
=> for MADX-: Moving Average (close) / Moving Average (low)
Length of Moving Average is editable.

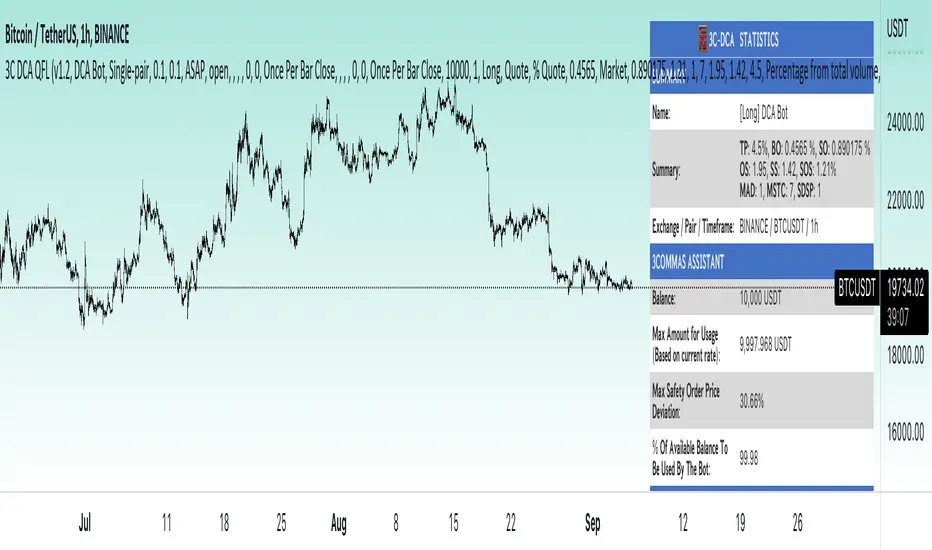
3Commas dollar cost averaging (DCA) QFL IndicatorAs investors, we often face the dilemma of willing high stock prices when we sell, but not when we buy. There are times when this dilemma causes investors to wait for a dip in prices, thereby potentially missing out on a continual rise. This is how investors get lured away from the markets and become tangled in the slippery slope of market timing, which is not advisable to a long-term investment strategy.
Skyrex developed a complex indicator based on dollar-cost averaging in Quick Fingers Luc's interpretation. It is a combinations of strategies which allows to systematically accumulate assets by investing scaled amounts of money at defined market cycle global support levels. Dollar-cost averaging can reduce the overall impact of price volatility and lower the average cost per asset thus even during market slumps only a small bounce is required to reach take profit.
The indicator script monitors a chart price action and identifies bases as they form. When bases are reached the script provides entry alerts. During price action development an asset value can go lower and in this way the script will perform safety entries alerts at each subsequent accumulation levels. When weighted average entry price reaches target profit the script will perform a take profit action alert.
Bases are identified as pivot lows in a fractal pattern and validated by an adjustable decrease/rise percentage to ensure significancy of identified bases. To qualify a pivot low, the indicator will perform the following validation:
Validate the price rate of change on drops and bounces is above a given threshold amount.
Validate the volume at the low pivot point is above the volume moving average (using a given length).
Validate the volume amount is a given factor of magnitude above is above the volume moving average.
Validate the potential new base is not too close to the previous range by using a given price percent difference threshold amount.
A fractal pattern is a recurring pattern on a price chart that can predict reversals among larger, more chaotic price movements. These basic fractals are composed of five or more bars. The rules for identifying fractals are as follows:
A bearish turning point occurs when there is a pattern with the highest high in the middle and two lower highs on each side.
A bullish turning point occurs when there is a pattern with the lowest low in the middle and two higher lows on each side.
Basic dollar-cost averaging approach is enhances by implementation of adjustable accumulation levels in order to provide opportunity of setting them at defined global support levels and Martingale volume coefficient to increase averaging effect. According to Quick Fingers Luc's principles trading principles we added volume validation of a base because it allows to confirm that the market is resistant to further price decrease.
The indicator supports traditional and cryptocurrency spot, futures , options and marginal trading exchanges. It works accurately with BTC , USD, USDT, ETH and BNB quote currencies. Best to use with 1H timeframe charts and limit orders. The indicator can be and should be configured for each particular asset according to its global support and resistance levels and price action cycles. You can modify levels and risk management settings to receive better performance
The difference between core script and this interpretation is that this strategy is specially designed for 3Commas bots
How to use?
1. Apply indicator to a trading pair your are interested in using 1H timeframe chart
2. Configure the indicator: change layer values, order size multiple and take profit/stop loss values according to current market cycle stage
3. Set up a TradingView custom alert using the indicator settings to trigger on a condition you are interested in
4. The indicator will send alerts when to enter and when to exit positions which can be applied to your portfolio using external trading platforms
5. Update settings once market conditions are changed using backtests on a monthly period
Dollar cost averaging (DCA) QFL IndicatorAs investors, we often face the dilemma of willing high stock prices when we sell, but not when we buy. There are times when this dilemma causes investors to wait for a dip in prices, thereby potentially missing out on a continual rise. This is how investors get lured away from the markets and become tangled in the slippery slope of market timing, which is not advisable to a long-term investment strategy.
Skyrex developed a complex indicator based on dollar-cost averaging in Quick Fingers Luc's interpretation. It is a combinations of strategies which allows to systematically accumulate assets by investing scaled amounts of money at defined market cycle global support levels. Dollar-cost averaging can reduce the overall impact of price volatility and lower the average cost per asset thus even during market slumps only a small bounce is required to reach take profit.
The indicator script monitors a chart price action and identifies bases as they form. When bases are reached the script provides entry alerts. During price action development an asset value can go lower and in this way the script will perform safety entries alerts at each subsequent accumulation levels. When weighted average entry price reaches target profit the script will perform a take profit action alert.
Bases are identified as pivot lows in a fractal pattern and validated by an adjustable decrease/rise percentage to ensure significancy of identified bases. To qualify a pivot low, the indicator will perform the following validation:
Validate the price rate of change on drops and bounces is above a given threshold amount.
Validate the volume at the low pivot point is above the volume moving average (using a given length).
Validate the volume amount is a given factor of magnitude above is above the volume moving average.
Validate the potential new base is not too close to the previous range by using a given price percent difference threshold amount.
A fractal pattern is a recurring pattern on a price chart that can predict reversals among larger, more chaotic price movements. These basic fractals are composed of five or more bars. The rules for identifying fractals are as follows:
A bearish turning point occurs when there is a pattern with the highest high in the middle and two lower highs on each side.
A bullish turning point occurs when there is a pattern with the lowest low in the middle and two higher lows on each side.
Basic dollar-cost averaging approach is enhances by implementation of adjustable accumulation levels in order to provide opportunity of setting them at defined global support levels and Martingale volume coefficient to increase averaging effect. According to Quick Fingers Luc's principles trading principles we added volume validation of a base because it allows to confirm that the market is resistant to further price decrease.
The indicator supports traditional and cryptocurrency spot, futures, options and marginal trading exchanges. It works accurately with BTC, USD, USDT, ETH and BNB quote currencies. Best to use with 1H timeframe charts and limit orders. The indicator can be and should be configured for each particular asset according to its global support and resistance levels and price action cycles. You can modify levels and risk management settings to receive better performance
Advantages of this indicator:
The indicator has custom alert settings for each strategy action
The indicator can be used with 3Commas, Cryptohopper, Alertatron or Zignaly bots
The indicator is sustainable to market slumps and can be used for long-term trading
The indicator provides a large number of entries which is good for diversification
Can be applied to any market and quote currency
Easy to configure user interface settings
How to use?
1. Apply indicator to a trading pair your are interested in using 1H timeframe chart
2. Configure the indicator: change layer values, order size multiple and take profit/stop loss values according to current market cycle stage
3. Set up a TradingView custom alert using the indicator settings to trigger on a condition you are interested in
4. The indicator will send alerts when to enter and when to exit positions which can be applied to your portfolio using external trading platforms
5. Update settings once market conditions are changed using backtests on a monthly period

Shotoki Volatility IndexHi, I finally coded a volatility index I'm proud of !
The formula is quite simple : It's the inverse of the maximal volatility that a candle can have
We find 2 lines : the white one, the volatility index ; the delayed index
The yellow area highlight the moment where we have more volatility
the gray one is when the market is quiet, it's not recommended to take decision in these moments
when the index is rising, there are less volatility
when the index is decreasing, the volatility is increasing
Shotoki

Engulfing Candles AlertThis is a Engulfing Candle Indicator with Alerts.
This is not like any other Engulfing candle indicator present on TV. There are some special rules that are being used to identify specific engulfing candles.
Also, the user can choose if they like nice body engulfing or they want to ignore them.
The indicator have the following highlights:
1) Ability to choose the color of the engulfing candle body.
2) Ability to choose a different color for the Liq (liquidity) swap engulfing candle body.
Bullish Engulfing after Liq Swap
Bearish Engulfing after Liq Swap
3) With above 2 options, you can get the desired information without plotting any extra information on the chart.
4) You can put the alerts for getting notified when these patterns forms on the chart.
5) Ability to choose between getting notified or not on the chart if the engulfing candle body is less than 40% of the whole candle size. This is useful in order to identify if the engulfing is really powerful or not.
After selecting the option to ignore such engulfing
6) Ability to choose between getting notified or not on the chart if the engulfed candle body is really small. This is in particular useful for avoiding the engulfing of Doji which in turn might not be that powerful.
After selecting the option to ignore such engulfing
We will keep on making the improvements/Enhancements over the time (Check the changelog for such features)
NOTE: The indicator is of best use if you have a defined & back tested strategy which relies on this type of candlestick pattern.
Crodl Pump & DumpThe reason why this indicator is called Pump and Dump is because it is based on volume.
The indicator focuses on volume levels to see if there is an increase in volume before deciding if it is worth entering a Position.
Long example = This will use ATR and price averages to trend Bullish and once the trend favours the upside it will then look at the Volume candles and if a candle is bigger then the average volume and the trend (ATR) is above a certain level it will then Give us a long entry if those conditions are true. We can have more than one long after one another since it will give us a position every-time the conditions are true and after TP(take profit) 1 or a Stop Loss was hit.
Short example = If the trend based on average price is trending downwards and we can see an increase of volume it will wait till we break a certain level breaks when we get the average price from the highs and Lows, then once the trend has met the bearish conditions it will wait for increase in volume and trigger a Sell. The sell will close once TP(take profit) 1 or a Stop Loss is hit.
In the inputs you can adjust the MA (moving average length. This helps to decide if the Trend is bearish or bullish. Higher moving averages will give you less entries and a lower moving average will give you more entries ,since price crosses lower MA's more it will change the trend more often.
Sensitivity is a divider of the MA values is so the higher the Sensitivity the lower the more trades you get since the trend is changing faster.
You will see that there is a backtesting panel on your chart when you look in the inputs there will be a statistics tab which will have 1. Simple 2. Mobile 3. Hide options
1. Simple is designed when you are using a PC or Laptop
2.Can be used when you are using your mobile it will show less data but won't be in your way
3.This will hide the backtesting panel on your screen.
Exit strategy.
there are 3 Types of exits for this indicator.
1 .CrodlExit which is ATR indicator based Exit with a divider.
2 . fIxed SL , this works in % so 1 = 1% market move.
3 .Reverse exits = Longs exit shorts and shorts exit longs.
there are 4 take profit targets and all of them are adjustable.
1= 0.5% by default
2=1% by default
3=1.5% by default
4=2% by default
on the Back tester you will find the following information :
Timeframe of your chart and then the Symbol or pair you are trading.
First trade = when the back tester starts to read data.
Total trade = Total buy and total sell signals and then total trades are buy + sell signals.
total win = total buys hit take profit 1 and total sells that hit take profit 1 and then total buy + total sells that hit take profit 1.
total loss = total buys that hit which ever exit mode you selected in the inputs by default it is crodl exit and total sells that hit which ever exit mode you selected in the inputs by default it is crodl exit and then you will get total buy losses + total sell losses to get total loss.
TP1= the % difference between total trades won and lost for the 1st take profit target and your stop loss method you chose.
TP2= the % difference between total trades won and lost for the 2nd take profit target and your stop loss method you chose.
TP3= the % difference between total trades won and lost for the 3rd take profit target and your stop loss method you chose.
TP4= the % difference between total trades won and lost for the 4th take profit target and your stop loss method you chose.
average win streak give you the average of how many winning trades you had every time before hitting a stop loss.
average loss streak is how many stop loss you hit on average before take profit one has been reached.
longest win streak give you the amount of winning trades you had without hitting a stop lossl that is selected in your inputs.
longest loss streak give you the amount of losing trades you had one after the other before hitting take profit 1.

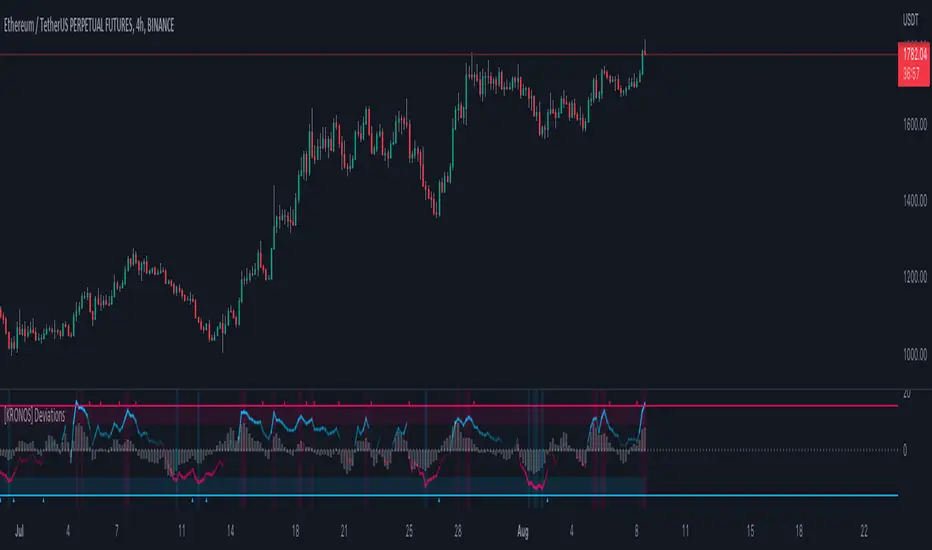
[KRONOS] DeviationsDescription
This indicator calculates the differences between the current price and the local support or resistance, and normalizes it into a range.
The value basis is calculated from a defined period of time that is then multiplied to get a standard deviations and a max. and min. value subtracted and divided into a final value.
It includes
Extreme zones. This value appears as blue and red lines which deviates from the oversold to overbought range.
Momentum. Lower time frame momentum is represented by a gray histogram as well as a signal line oscillating from a red to blue color.
Strong reversal. Red ( bearish ) and blue ( bullish ) columns will appear on the histogram when our algorithm detects that the strength of momentum is coming to an end indicative of a trend reversal.
Trend confirmation. Red or blue arrows will act as a trend confirmation.
Support and resistance . The zero line will frequently serve as a S/R area.
Divergences. You can use this indicator to detect potential pivot areas.
How to use?
Sell/Short when the histogram shows a red column and the signal line is in or above the overbought area (colored in red).
Buy/Long when the histogram shows a blue column and the signal line is in or below the oversold area (colored in blue).
extra tip: if you entered a trade based on the above conditions, you can partially increase your position each time you see a confirmation arrow.
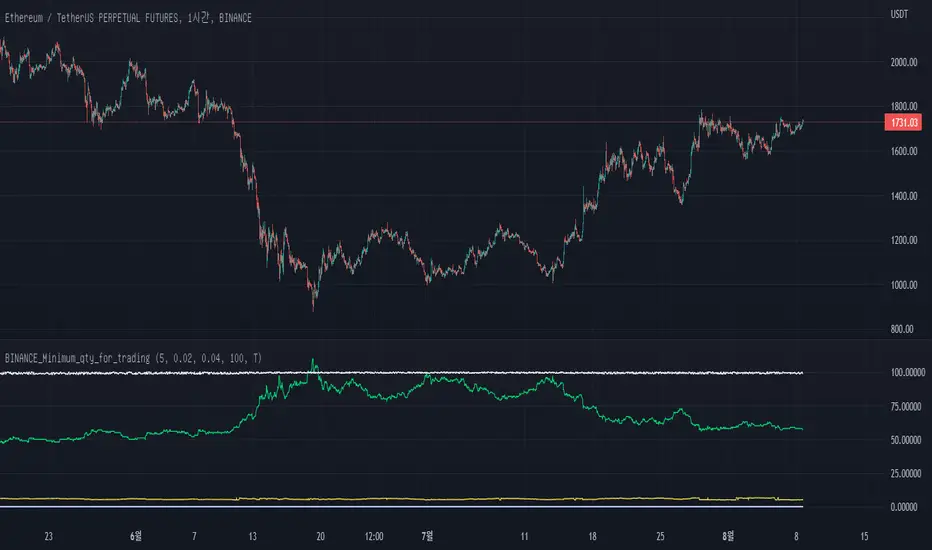
BINANCE_Minimum_qty_for_tradingWe can not buy just 0.001ETH in Binance on 2022.8.8
Why? Binance have trading role about the minimum qty of coins.
Until now, we can not find the info in TradingView.
I hope Our TradingView give us this updating info easily oneday.
I am not a good English speaker.
Sorry about my short explanation.
reference: www.binance.com
[KRONOS] Gamma StrengthDescription
This indicator's main component is the signal line which represents a very responsive market strength value calculated from real time data and normalized into a range (0 - 0.5 - 1). Indicator is using Stochastic and RSI functions to get raw value filtered through a linear regression, helping users predict imminent market directions. Lastly, this value oscillation is converted into a range to notice overbought and oversold zones at a quick glance.
It includes
Divergence. Indicator plots R for regular divergence and H for hidden with minimal possible delay which can be used to notice irregularity in the market.
Extreme overbought and oversold areas. Colored background extreme areas are showing points where a reversal is approaching.
How to use?
Buy/Long when the indicator line goes out of the blue/oversold area.
Sell/Short when the indicator line goes out of the red/overbought area.
extra tip: you can use the zero line and overbought/oversold zones as either a take profit or an entry area.

Month/Month Percentage % Change, Historical; Seasonal TendencyTable of monthly % changes in Average Price over the last 10 years (or the 10 yrs prior to input year).
Useful for gauging seasonal tendencies of an asset; backtesting monthly volatility and bullish/bearish tendency.
~~User Inputs~~
Choose measure of average: sma(close), sma(ohlc4), vwap(close), vwma(close).
Show last 10yrs, with 10yr average % change, or to just show single year.
Chose input year; with the indicator auto calculating the prior 10 years.
Choose color for labels and size for labels; choose +Ve value color and -Ve value color.
Set 'Daily bars in month': 21 for Forex/Commodities/Indices; 30 for Crypto.
Set precision: decimal places
~~notes~~
-designed for use on Daily timeframe (tradingview is buggy on monthly timeframe calculations, and less precise on weekly timeframe calculations).
-where Current month of year has not occurred yet, will print 9yr average.
-calculates the average change of displayed month compared to the previous month: i.e. Jan22 value represents whole of Jan22 compared to whole of Dec21.
-table displays on the chart over the input year; so for ES, with 2010 selected; shows values from 2001-2010, displaying across 2010-2011 on the chart.
-plots on seperate right hand side scale, so can be shrunk and dragged vertically.
-thanks to @gabx11 for the suggestion which inspired me to write this

Lune Market Analysis Premium- Version 0.9 -
Lune Algo was developed and built by Lune Trading, utilizing years of their trading expertise. This indicator works on all stocks, cryptos, indices, forex, futures , currencies, ETF's, energy and commodities. All the tools and features you need to assist you on your trading journey. Best of all, Lune Algo is easy to use and many of our tools and strategies have been thoroughly backtested thousands of times to ensure that users have the best experience possible.
Overview
Trade Dashboard—Provides information about the current market conditions, Such as if the market is trending up or down, how much volatility is in the market and even displays information about the current signal.
Trade Statistics—This tool gives you a breakdown of the Statistics of the current selected strategy based on backtests. It tells you the percentage of how often a Take Profit or Stop Loss was hit within a specific time period. Risk and Trade management is very important in trading, and can be the difference between a winning and losing strategy. So we believe that this was mandatory.
Current Features:
Advanced Buy and Sell Signals
Exclusive built-in Strategies
Lune Confidence AI
EK Clouds
Reversal Bands
Vray (Volume Ray)
Divergence Signals
Reversal Signals
Support/Resistance Zones
Built-in Themes
Built-in Risk Management system (take profit/stop loss)
Trade Statistics
Trade Assistance
Trade Dashboard
Advanced Settings
+ More coming soon, Big plans!
Features Breakdown:
Lune Confirmation—Used to help you confirm your trades and trend direction. It uses unique calculations, and its settings can be adjusted to allow traders to adapt the settings to fit their trading style.
Lune Confidence AI—All strategies are equipped with our exclusive built-in Confidence AI. This feature tells you how much confluence there is in a trade. It uses a rating system where signals are given a number from 0 to 5. A rating of 0 indicates that there is not a lot of confluence or confidence in the signal, while a rating of 5 indicates that there is a lot of confidence in the trade. This feature is not perfect and will be improved overtime.
Support/Resistance Zones—Calculates the most important support/resistance levels based on how many times a level has been used as support or resistance. Traders also refer to these as supply and demand zones and key levels.
EK Clouds—Used to further help you confirm trend and was optimized to also be used as support and resistance. This feature is powered by custom moving averages.
Reversal Bands—An optimized and improved version of the infamous Bollinger Bands. When price action takes place within the Reversal Bands it usually indicates that the current symbol is overextended and a reversal is possible.
Vray—Also Known as "Volume Ray", Assists you in better visualizing volume. This helps you find key levels and areas of support that you wouldn't be able to see otherwise. It helps you trade like the institutions.
This indicator's signals DO NOT REPAINT.
If you are using this script you acknowledge past performance is not necessarily indicative of future results and there are many more factors that go into being a profitable trader.

RSI - S&P Sector ETFsThe script displays RSI of each S&P SPDR Sector ETF
XLB - Materials
XLC - Communications
XLE - Energy
XLF - Financials
XLI - Industrials
XLK - Technology
XLP - Consumer Staples
XLRE - Real Estate
XLU - Utilities
XLV - Healthcare
XLY - Consumer Discretionary
It is meant to identify changes in sector rotation, compare oversold/overbought signals of each sector, and/or any price momentum trading strategy applicable to a trader.

SRT Indicator script based on Knowledge sharing by NKIn a year, there are 248/ 252 trading days .
Half of this is 124. Even 125/ 126 can be taken.
For Ex: We get SRT value by dividing the Nifty Spot with 124 SMA value applied on Nifty in a Day Chart.
This value Travels between 0.6 ( Bottom) to 1.38/1.4/1.45/1.5 ( Top).
Ideal Entry in stock will be at 0.6, which is very rare. You tend to buy at 0.7/0.8/0.9/1.10.
Exit from stock will be at 1.5.
However, generally, we get a value of 0.8/0.9 and we should start investing 20 % at a time. For every 0.1 declines, we should add 20 % to the stock portfolio.
Start Booking Profit if the SRT value is above 1.35 & book 50 % of the portfolio when SRT value is 1.45.
For Traders, as when SRT value comes to 0.8/ 0.9. Buy when HM comes in a buy in Monthly Time Frame.
SRT moves between 0.6 to 1.5 and which is a very reliable parameter for Investing.
Best time to invest in NIFTY is when SRT is between 0.6 to 0.9, NIFTY returned 2X, 3X or even more in less than a year.
Make sure Hilega Milega on Monthly Time frame is BUY before investing at these levels
Invest in batches, 30% of your capital when SRT is 0.9 and repeat every 0.1 downside

Shotoki Force IndexHi,
I publish my private indicator.
The colored line is called SFI
When it turns blue, it's bullish (enter with a dot)
When it turns purple, it's bearish (enter with dot)
The SFI is "followed" by he bollinger bands.
I use the RV²I as factor
Do not use it allow to trade
I added a RSI option to see when to exit early
Shotoki
Thank's Muxxy for the idea (BB bands)
