High/Low Location Frequency [LuxAlgo]The High/Low Location Frequency tool provides users with probabilities of tops and bottoms at user-defined periods, along with advanced filters that offer deep and objective market information about the likelihood of a top or bottom in the market.
🔶 USAGE
There are four different time periods that traders can select for analysis of probabilities:
HOUR OF DAY: Probability of occurrence of top and bottom prices for each hour of the day
DAY OF WEEK: Probability of occurrence of top and bottom prices for each day of the week
DAY OF MONTH: Probability of occurrence of top and bottom prices for each day of the month
MONTH OF YEAR: Probability of occurrence of top and bottom prices for each month
The data is displayed as a dashboard, which users can position according to their preferences. The dashboard includes useful information in the header, such as the number of periods and the date from which the data is gathered. Additionally, users can enable active filters to customize their view. The probabilities are displayed in one, two, or three columns, depending on the number of elements.
🔹 Advanced Filters
Advanced Filters allow traders to exclude specific data from the results. They can choose to use none or all filters simultaneously, inputting a list of numbers separated by spaces or commas. However, it is not possible to use both separators on the same filter.
The tool is equipped with five advanced filters:
HOURS OF DAY: The permitted range is from 0 to 23.
DAYS OF WEEK: The permitted range is from 1 to 7.
DAYS OF MONTH: The permitted range is from 1 to 31.
MONTHS: The permitted range is from 1 to 12.
YEARS: The permitted range is from 1000 to 2999.
It should be noted that the DAYS OF WEEK advanced filter has been designed for use with tickers that trade every day, such as those trading in the crypto market. In such cases, the numbers displayed will range from 1 (Sunday) to 7 (Saturday). Conversely, for tickers that do not trade over the weekend, the numbers will range from 1 (Monday) to 5 (Friday).
To illustrate the application of this filter, we will exclude results for Mondays and Tuesdays, the first five days of each month, January and February, and the years 2020, 2021, and 2022. Let us review the results:
DAYS OF WEEK: `2,3` or `2 3` (for crypto) or `1,2` or `1 2` (for the rest)
DAYS OF MONTH: `1,2,3,4,5` or `1 2 3 4 5`
MONTHS: `1,2` or `1 2`
YEARS: `2020,2021,2022` or `2020 2021 2022`
🔹 High Probability Lines
The tool enables traders to identify the next period with the highest probability of a top (red) and/or bottom (green) on the chart, marked with two horizontal lines indicating the location of these periods.
🔹 Top/Bottom Labels and Periods Highlight
The tool is capable of indicating on the chart the upper and lower limits of each selected period, as well as the commencement of each new period, thus providing traders with a convenient reference point.
🔶 SETTINGS
Period: Select how many bars (hours, days, or months) will be used to gather data from, max value as default.
Execution Window: Select how many bars (hours, days, or months) will be used to gather data from
🔹 Advanced Filters
Hours of day: Filter which hours of the day are excluded from the data, it accepts a list of hours from 0 to 23 separated by commas or spaces, users can not mix commas or spaces as a separator, must choose one
Days of week: Filter which days of the week are excluded from the data, it accepts a list of days from 1 to 5 for tickers not trading weekends, or from 1 to 7 for tickers trading all week, users can choose between commas or spaces as a separator, but can not mix them on the same filter.
Days of month: Filter which days of the month are excluded from the data, it accepts a list of days from 1 to 31, users can choose between commas or spaces as separator, but can not mix them on the same filter.
Months: Filter months to exclude from data. Accepts months from 1 to 12. Choose one separator: comma or space.
Years: Filter years to exclude from data. Accepts years from 1000 to 2999. Choose one separator: comma or space.
🔹 Dashboard
Dashboard Location: Select both the vertical and horizontal parameters for the desired location of the dashboard.
Dashboard Size: Select size for dashboard.
🔹 Style
High Probability Top Line: Enable/disable `High Probability Top` vertical line and choose color
High Probability Bottom Line: Enable/disable `High Probability Bottom` vertical line and choose color
Top Label: Enable/disable period top labels, choose color and size.
Bottom Label: Enable/disable period bottom labels, choose color and size.
Highlight Period Changes: Enable/disable vertical highlight at start of period
Topbottomfinder

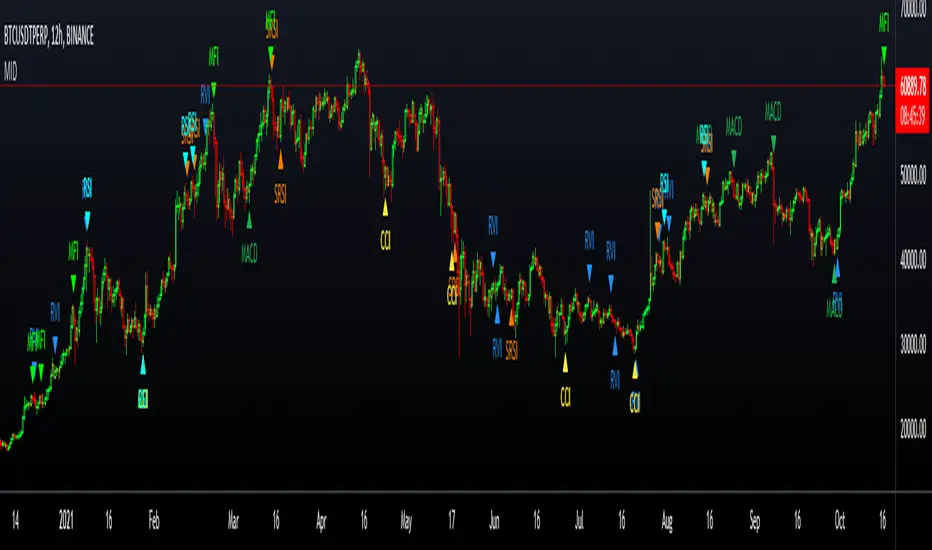
Multi Indicator DivergenceSpotting Divergences using multiple indicators.
This multi divergence indicator does not repaint until the bar closes.
It does not use offset as well.
I might create another private version of this indicator including the option to make an alert if there are interested.
Enjoy and trade at your own risk!
Happy Trading!!!
WaveTrend Momentum (Zeiierman)█ Overview
WaveTrend Momentum (Zeiierman) reveals the underlying rhythm of market movement through positive and negative momentum waves that visualize both sides of trend behavior. This dual-wave structure makes it easy to see how impulses and retracements interact in real time, helping you distinguish between a normal pullback within strength and the early signs of a trend losing momentum.
The indicator layers its waves with higher-timeframe trend alignment and adaptive context filters, mapping when momentum expands, when it fades, and where a pullback is approaching exhaustion or renewed trend strength is likely to emerge.
⚪ Why This One Is Unique
Unlike conventional wave oscillators, this design uses dual, phase-managed wave construction with adaptive scaling across symbols and timeframes. At its core is a three-mode Trend Strength engine (Adaptive, Stability, Structure) that dynamically adjusts to market conditions, supported by higher-timeframe regime sourcing and a dedicated impulse-and-divergence framework.
█ Main features
⚪ WaveTrend Momentum Waves
The foundation of the indicator lies in its ability to build positive and negative momentum waves that visualize both sides of market movement. This dual-wave structure makes it easy to identify trend direction, impulses, retracements, and exhaustion in real time, showing how momentum evolves within broader market phases. The waves can be used directly to gauge trend strength and direction, helping traders stay aligned with prevailing momentum or recognize when a shift is forming.
⚪ Extreme Moves
Extreme Zones highlight points where momentum reaches statistically stretched conditions, areas where price action often pauses, rebalances, or reverses. These zones help traders anticipate potential exhaustion before it becomes visible on price, improving timing for entries, exits, and scaling decisions.
⚪ Impulse Moves
Impulse Markers identify bursts of directional momentum, moments when trend energy expands sharply. These points often align with breakouts, accelerations, or continuation signals, helping traders focus on active opportunities rather than noise or consolidation.
⚪ Trend Strength
The Trend Strength Line adapts dynamically to shifting market regimes. It can operate in three modes: Adaptive, Stability, and Structure, each offering a different sensitivity level to trend changes. This feature helps confirm whether the trend is building, stabilizing, or losing strength, and serves as a foundation for bias filtering or trade direction confirmation.
⚪ Higher-Timeframe Trend Alignment
Integrates a higher-timeframe trend reference directly into the analysis, giving each wave context. This alignment clarifies when local pullbacks occur in harmony or conflict with the broader trend, making it easier to distinguish temporary corrections from true reversals.
⚪ Divergence Engine
A fully integrated divergence detection system that automatically spots both regular and hidden divergences between price and momentum. By surfacing early signs of trend weakening or continuation potential, it gives traders a structured way to detect subtle momentum shifts before they manifest in price.
█ How to Use
⚪ Trend Trading
WaveTrend Momentum excels as a trend-following framework by combining wave direction, Trend Strength, and higher-timeframe alignment to reveal when momentum is expanding or contracting within the broader market phase.
Note: To get trend waves, consider increasing the Wave Transition value to above 40.
Bullish WaveTrend Trend: When the positive momentum waves are above the neutral midpoint, the market is trending upward. Minor downward retracements within this structure often resolve back into trend continuation once buying pressure reasserts itself, particularly when the higher-timeframe context confirms a bullish regime.
Bearish WaveTrend Trend: When the negative wave dominates and remains below the midpoint, downside momentum controls the market. Minor upward retracements within this structure often resolve back into trend continuation once selling pressure reasserts itself, particularly when the higher-timeframe context confirms a bearish regime.
Bullish Trend Strength Line: A Trend Strength Line positioned above the midline indicates a bullish trend. A rising line reflects growing momentum and persistent buying pressure. The steeper the slope, the stronger the current regime. As long as the line continues to rise alongside positive waves, the trend remains structurally intact.
Bearish Trend Strength Line: A Trend Strength Line positioned below the midline indicates a bearish trend. A declining line reflects increasing selling pressure and persistent downside momentum. The steeper the slope, the stronger the current bearish regime. As long as the line continues to fall alongside negative waves, the trend remains structurally intact.
⚪ Momentum Trading
Momentum trading focuses on capturing the energy and force behind price movement, identifying whether the market is accelerating, losing steam, or preparing for a reversal. Momentum shifts can reveal temporary exhaustion, trend-strength continuation, or breakout acceleration before price action fully confirms it.
The indicator includes several features designed to detect and visualize momentum:
Waves: The core element of the indicator. The size and slope of the waves reflect the strength of momentum. Expanding waves indicate strong directional pressure, while contracting waves suggest cooling or consolidation.
Extreme Zones: When waves reach or exceed the extreme levels, the market enters statistically stretched conditions, signaling potential exhaustion or reversal zones. However, these events can also occur during strong trends, indicating continued strength in that direction. Market context is essential to determine whether an extreme should be interpreted as a reversal signal or as confirmation of trend momentum.
Impulse Markers: Highlight sudden bursts of momentum, often associated with breakouts or continuation events. Like Extreme Zones, Impulse Markers can appear within both reversals and strong trending phases. Context from price structure and higher timeframes helps identify whether the impulse reflects a trend-strength expansion or the final surge before exhaustion.
You can use any of these features to identify:
Breakouts: When Impulse or Extreme Markers align with expanding waves.
Reversals: When momentum reaches extreme levels followed by a fade in strength, it signals potential exhaustion before a structural shift. However, strong trends can also produce temporary fades that quickly recover, so context is key to distinguishing between true reversals and brief pauses within the trend.
⚪ Pullback Trading
Pullbacks represent short pauses or retracements within a prevailing trend. The combination of the Wave, Impulse Markers, and the Trend Strength Line helps identify when a pullback is maturing and when continuation is likely to resume.
Bullish WaveTrend and Trend Strength Pullback
In an uptrend, a brief dip in the negative wave, paired with a bullish Trend Strength, typically signals a healthy pullback rather than a reversal. When the negative wave begins to turn upward again, it confirms momentum recovery and potential for continuation.
Bearish WaveTrend and Trend Strength Pullback
In a downtrend, a short-lived rise in the positive wave while Trend Strength remains negative usually signals a counter-trend rally within weakness. As the positive wave fades and the negative wave expands again, downside continuation becomes more probable.
⚪ Divergence Trading
Divergence trading focuses on identifying moments when price and momentum move out of sync, signaling a potential shift in market direction or a slowdown in trend strength. These divergences often appear before reversals, consolidations, or major transitions in structure, making them a valuable early warning tool for traders.
The integrated Divergence Engine automatically detects these imbalances between price action and momentum. When price continues to move in one direction but momentum begins to fade, it suggests that the underlying strength driving the move is weakening.
█ How It Works
⚪ Wave Construction
The momentum wave is derived from phase-managed price smoothers, then normalized and bounded to express both positive and negative momentum within a single coherent structure.
Calculation: Composite moving frameworks with phase management, nonlinear rescaling, and amplitude companding to stabilize wave height and maintain consistent sensitivity.
⚪ Extremes
An auxiliary equilibrium tracker measures deviations from a dynamic mean to identify statistically stretched conditions in which momentum may begin to rebalance.
Calculation: Robust deviation mapping of a smoothed equilibrium series with adaptive thresholds for regime-consistent extremes.
⚪ Trend Strength Core
A tri-mode core measures directional persistence and adapts dynamically to changing market regimes, with optional higher-timeframe sourcing for context.
Calculation: Return-aggregated momentum with envelope gating (Adaptive), stability-biased curvature tracking (Stability), and structure-driven range midpoint logic (Structure).
⚪ Range & Regime Filter
A volatility-adjusted filter produces a smoothed state line and internal bias zones, allowing the indicator to contextualize momentum behavior within current volatility conditions.
Calculation: Volatility-normalized range synthesis with slow/fast quantization modes and optional smoothing to mitigate market chop.
⚪ Impulse Detection
Detects short-term bursts of directional energy and marks them as impulse events. These impulses highlight when momentum rapidly expands, often signaling breakouts, accelerations, or the end of low-volatility phases.
Calculation: Nonlinear impulse-response mapping that emphasizes higher-order rate changes while filtering out micro-noise.
⚪ Divergence Engine (Regular & Hidden)
Compares price swings against the wave’s momentum structure to identify early disagreement between price and internal strength.
Calculation: Swing-logic comparators analyze price relative to normalized wave amplitude to detect momentum shifts and potential divergence setups.
-----------------
Disclaimer
The content provided in my scripts, indicators, ideas, algorithms, and systems is for educational and informational purposes only. It does not constitute financial advice, investment recommendations, or a solicitation to buy or sell any financial instruments. I will not accept liability for any loss or damage, including without limitation any loss of profit, which may arise directly or indirectly from the use of or reliance on such information.
All investments involve risk, and the past performance of a security, industry, sector, market, financial product, trading strategy, backtest, or individual's trading does not guarantee future results or returns. Investors are fully responsible for any investment decisions they make. Such decisions should be based solely on an evaluation of their financial circumstances, investment objectives, risk tolerance, and liquidity needs.
유료 스크립트

Expansion Top/Bottom (Expo) Expansion Top/Bottom (Expo)
DESCRIPTION
Expansion Top/Bottom (Expo) indicator is a powerful oscillator that visualizes temporary Top/Bottom as well as trend shifts. When the market moves boldly a histogram will be formed in the indicator which indicates that the movement might be at its end. It's always a great idea to lock in some profit when we get these histograms. These ‘Lock-in’ profits points are visualized by a cross.
The professional trader has the ability to adjust the length of the calculation. A longer length means that the indicator spots broader market shifts. A short length means that the indicator spots temporary tops/bottoms.
Use the indicator in combination with other signals and analysis techniques.
HOW TO USE
1. Use the indicator to identify temporary tops/bottoms.
2. Use the indicator to identify broader tops/bottoms.
3. Use the indicator to visualize the trend.
4. Use the indicator to visualize ‘Lock-In’ profit points.
INDICATOR IN ACTION
Short length (Length = 14)
BTCUSD
EURUSD
BRENT
BRENT
BTCUSD
Long length (Length = 50)
BRENT
EURUSD
BTCUSD
The indicator works with RENKO, HEIKIN ASHI and with KAGI charts as well.
I hope you find this indicator useful, and please comment or contact me if you like the script or have any questions/suggestions for future improvements. Thanks!
I will continue to work on this indicator, so please share your experience and feedback with me so that I can continuously improve it. Thanks to everyone that have contacted me regarding my scripts. Your feedback is valuable for future developments!
ACCESS THE INDICATOR
• Contact me on TradingView or use the links below.
• I have started to publish private scripts which are not visible on my profile. However, if you're interested to know more about these scripts, drop me a message at my webpage and I will show you these scripts as well. The rationale behind publishing these scrips as private is that I don't want them to be indexed in search engines.
-----------------
Disclaimer
Copyright by Zeiierman.
The information contained in my scripts/indicators/ideas does not constitute financial advice or a solicitation to buy or sell any securities of any type. I will not accept liability for any loss or damage, including without limitation any loss of profit, which may arise directly or indirectly from use of or reliance on such information.
All investments involve risk, and the past performance of a security, industry, sector, market, financial product, trading strategy, or individual’s trading does not guarantee future results or returns. Investors are fully responsible for any investment decisions they make. Such decisions should be based solely on an evaluation of their financial circumstances, investment objectives, risk tolerance, and liquidity needs.
My scripts/indicators/ideas are only for educational purposes!

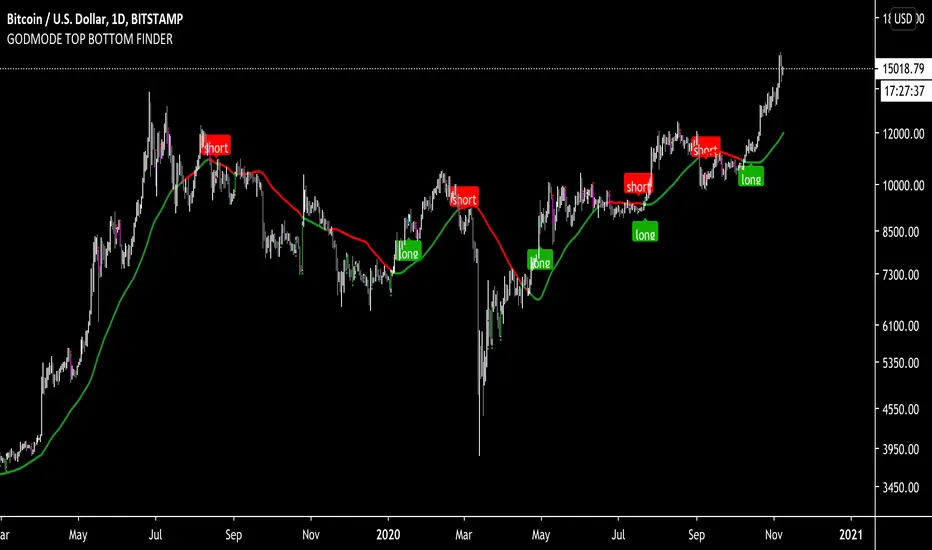
potential top bottom finderpotential top bottom finder
long is start of accumulation / buying
short is start of distribution / selling
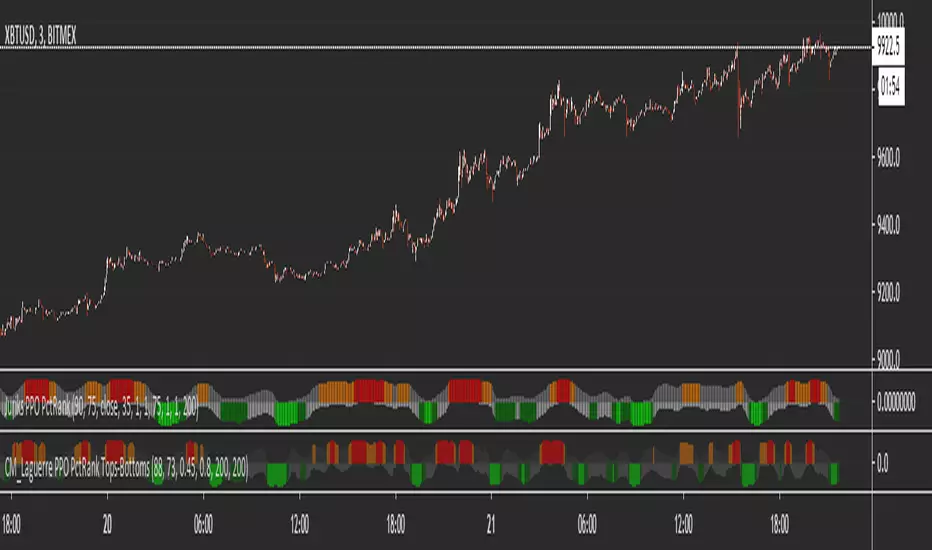
Jurik PPO PercentileRank Mkt Tops & BottomsI saw that Juriks Moving average and its variation of the following script has been pretty popular on MT4/MT5 FX so I decided to try to recreate it in Tradingview.
The basic logic was taken from:
Inspired by the script by one of the most active pinescripters in the early days.
The Jurik Moving average has been created by one of the most active pinescripters nowadays everget:
Those two did all the heavy lifting I am just putting all together.
Cheers to everyone and I hope you guys are a having better day than I am.