CISD & OB [BLAZ]Version 1.0 – Published October 2025: Initial release
1. Overview & Purpose
The CISD & OB indicator identifies and plots Order Blocks (OB) and Changes in State of Delivery (CISD) on price charts using a strict rule-based approach designed to highlight structural turning points and continuation zones in price action. It automatically detects these formations when price creates confirmed swing highs or lows, followed by opposing directional moves that break predefined structural levels.
Detection logic is consistently applied across all market conditions, allowing the indicator to identify areas where notable price reactions or liquidity shifts have occurred. These levels are plotted as horizontal lines on the chart and are updated in real time to reflect the latest structural developments, helping traders visualise potential reversal or continuation zones.
The methodology used in this indicator represents the author's specific approach to Order Block and CISD identification, incorporating custom criteria for swing validation and confirmation logic that differ from standard implementations. Detection operates entirely mechanically, without discretionary intervention, to ensure consistency and objectivity across use cases. This indicator functions on all standard timeframes and supports multiple asset classes, including Forex, Stocks, Cryptocurrencies, Futures, and Commodities.
The indicator is unique in its ability to apply detection logic to a custom timeframe, enabling multi-timeframe structural analysis without switching charts. Let’s begin by explaining key terminologies based on the author’s perception to aid in understanding the functionality of the indicator.
2. Order Block (OB)
An Order Block is identified when price creates a swing high or swing low followed by a directional move that closes beyond the open of the opposing candle(s) structure.
2.1. For bearish Order Blocks:
Price must form a confirmed swing high (higher than surrounding candles).
A subsequent bearish candle must close below the open of the bullish candle(s) that created the swing high.
2.2. For bullish Order Blocks:
Price must form a confirmed swing low (lower than surrounding candles).
A subsequent bullish candle must close above the open of the bearish candle(s) that created the swing low.
The indicator only validates Order Blocks where the structural formation meets minimum swing criteria and the confirming move demonstrates sufficient momentum beyond the identified level.
3. Change in State of Delivery (CISD)
A CISD occurs when a valid Order Block forms in the opposite direction to the previously confirmed Order Block, indicating a potential shift in market structure.
3.1. Formation criteria:
A bullish CISD forms when a valid bullish Order Block is detected after the most recent confirmed structure was a bearish Order Block.
A bearish CISD forms when a valid bearish Order Block is detected after the most recent confirmed structure was a bullish Order Block.
Each CISD represents the first opposing Order Block in a sequence, distinguishing it from continuation Order Blocks that follow in the same direction.
The indicator tracks the sequence of Order Block formations to automatically classify each new structure as either a CISD (directional change) or continuation Order Block based on the preceding confirmed structure.
4. Detection Logic & Visual Management
The indicator continuously scans price action in real time, validating only those patterns that meet predefined technical thresholds. Once a structure is confirmed, it is plotted as a horizontal line extending from the origin candle’s open to the confirming close.
To maintain chart clarity, the script integrates automatic display management, limiting the number of plotted lines according to user-defined settings. Independent styling options are available for bullish and bearish structures, including colour, width, and line thickness. CISD and OB structures are styled separately to provide a clear distinction between reversal and continuation events.
Developing structures appear as dotted potential horizontal lines until they are validated, at which point they transition to solid lines. The indicator also allows users to restrict visibility of plotted lines above a selected timeframe, ensuring that higher timeframe charts remain clean and readable.
If configuration settings conflict, such as incompatible timeframe or visibility filters, the indicator displays on-chart warning messages to guide users in adjusting their setup appropriately.
The indicator supports multi-timeframe plotting capability, allowing structures identified on higher timeframes to be visualised directly on the active lower timeframe chart. This feature allows traders to observe how market structures align across multiple timeframes, providing greater confirmation of overall trend direction, reinforcing analytical confidence through cross‑timeframe confluence, and ensuring short‑term decisions remain aligned with the prevailing market context.
Traders can configure alerts to receive notifications when new CISD or OB structures are confirmed. Alerts are fully customisable via the indicator input settings and can be defined by direction (bullish/bearish) and pattern type (OB or CISD).
5. Usage Instructions
5.1. Alert Setup:
Enable "Set Alert?" toggle in indicator settings.
Configure alert preferences for specific pattern types.
On the chart, click the three dots menu beside the indicator's name or press Alt + A.
Select "Add Alert" and click “Create” to activate the alert.
Alerts trigger when new patterns are confirmed.
5.2. Display Controls:
Use "Bullish Lines" and "Bearish Lines" toggles to show/hide patterns by direction.
Adjust line quantity settings (1-25) to control how many patterns display simultaneously.
Enable “Timeframe” to apply detection logic to a higher timeframe of choice, displaying CISD and OB patterns directly on the active chart.
5.3. Visibility Filter:
Use “Show below” to limit indicator visibility to specific timeframes. When enabled, the indicator hides automatically on any timeframe equal to or higher than the selected setting.
5.4. Appearance Customisation:
Toggle “CISD” or “OB” on/off to show or hide individual pattern types.
Modify colours and line widths independently for bullish and bearish structures.
The “Show potential line” option displays developing patterns as dotted horizontal lines until confirmed.
5.5. Warning Message:
Enable “Show warning messages” to display on‑chart guidance for conflicting or invalid configurations.
Choose the preferred message box position and colour styling for readability.
6. Protected Logic & Original Design
This indicator has been developed from the ground up using proprietary algorithms and a custom structural classification logic derived from original research into Order Block and CISD identification methods. The internal mechanics, including real-time pre-confirmation logic, multi-timeframe adaptation, directional classification sequencing, and automated display management, are not based on any publicly available script or third-party resource.
7. Disclaimer
This indicator is provided for educational and analytical purposes only. It does not constitute financial advice, investment recommendations, or trading signals. All trading and investment decisions remain solely the responsibility of the user.
Trading financial instruments involves substantial risk of loss. Past performance of any trading methodology or indicator does not guarantee future results. Users should conduct their own research and consider consulting with qualified financial professionals before making trading decisions.
The indicator's pattern detection is based on technical analysis principles and should be used as part of a comprehensive trading approach. No trading tool can guarantee profitable outcomes or eliminate market risk.
By using this indicator, users acknowledge they understand these risks and accept full responsibility for their trading decisions and outcomes.
Timeframe

Force of Strategy (FoS, Multi TF/TA, Backtest, Alerts)Introducing the FoS Trading System
A comprehensive and innovative solution designed for both novice and experienced traders to enhance their intraday trading.
The basic idea of creating this script is to stay profitable in any market
Key Features:
There are over 25 no-repaint strategies for generating buy and sell signals to choose from
10 symbols for simultaneous trading
Webhook alerts in TTA format (tradingview to anywhere) pre-configured to send messages for trading cross-margin futures on major Crypto Exchanges: Binance, Bitget, BingX, Bybit, GateIO and OKX
A unique automated "Strategy switcher" feature for backtesting and live trading—not just a specific strategy, but the logic behind choosing a trading one or another strategy based on backtesting data obtained in real time
Advanced risk management options and backtest result metrics
Higher Timeframe filters (Technical Rating, ADX, Volatility) and ability for check backtest results with 9 main higher timeframes
Buy and sell signals are generated using TradingView Technical Ratings, indicators with adaptive length algorithms and various classic indicators with standard settings to avoid overfitting
Next, I will describe in detail what this script does and what settings it operates with:
"All Strategies" off
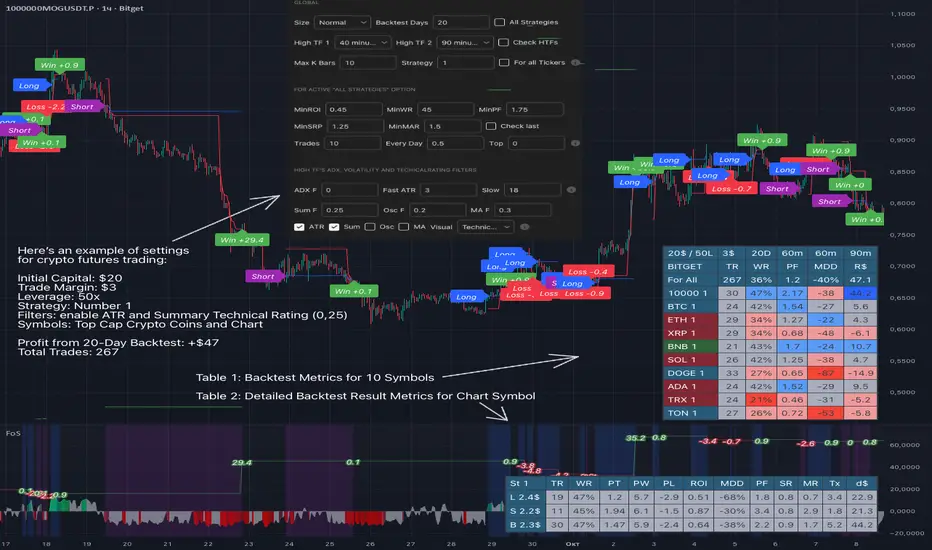
- In the global settings block, as shown in the main chart screenshot, you select how long the script will perform backtests in days, with a limitation on the number of bars for calculations. This limitation is necessary to maintain an acceptable calculation speed. You also choose which two higher timeframes we will use for signal and filters when confirming the opening of trades
- With "All Strategies" off - as in the example on the main chart screenshot, trading is carried out by strategy #1 on 10 selected tickers simultaneously. By default, I selected the 9 top-capitalized cryptocurrencies on the Bitget exchange and the chart symbol. You can change that choice of 9 non chart opened instruments and # strategy for each them
- The first row in the table 1 shows some of the main choosen script settings, in attached example: initial capital 20$, leverage 50L, 20 backtest days, 3$ is invest in one deal, 60m - is chart timeframe, next 60m is higher timeframe 1 and last 90m is higher timeframe 2. In first column you see shortened to 5 characters ticker names
- The exchange name in the second row determines the alert messages format
I've attached another example of trading with setting "All strategies" off in the image below. In this example, trading 10 standard symbols on an hourly timeframe, 2 coins from 10: 1000SATS and DOGE have generated a profit of over $65 over the past 20 days using strategy #4
Can you browse a wide range of trading instruments and select the 10 best strategies and settings for future trading? Of course, trading is what this script is do!
The parameters in the table 1 mean the following:
TR - count of closed trading deals
WR - Winning Rate, PF - Profit Factor
MDD - Max Draw Down for all calculated time from initial capital
R$ - trading profit result in usd
The parameters in the table 2 is just more metrics for chart symbol:
PT - result in usd Per one Trade
PW - result Per Win, PL - result Per Lose
ROI - Rate of Investments
SR - Sharpe Ratio, MR - CalMAR ration
Tx - Commision Fee in Usd
R$ - trading profit result in usd again
Table 2 separate trade results of backtesting for longs and shorts. In first column you see how many USD were invested in one trade, taking into account possible position splitting (will be discussed in more detail in the risk management section)
Settings:
"All Strategies" on, "Check Last" off
When "All Strategies" is active, trading changed from 10 symbols and one strategy to all strategies and one chart symbol. If option "Check Last" is inactive you will see backtest results for each of strategy in backtest setting days. This is useful, for example, if you want to see backtest results under different settings over a long period of time for calibrating risk management or entry rules
"All Strategies" on, "Check Last" on
- If "All Strategies" and "Check Last" is active trading will occur on the chart symbol only for those strategies that meet the criteria of the settings block for the enabled "All Strategies" option. For example your criteria is: for last 5 trades for all strategies, open next trade only on strategy which reached ROI 25% and WinRate 50%. When strategy with this setting criteria receive Buy or Sell Signal this trade will be opened, and when trade will be close "check last" will repeat. This feature i called "Strategy switcher"
-In Table 1 if strategy meet criteria you will see "Ok" label, if strategy meet criteria and have maximum from other reached ROI they labeled "Best". Chart strategy labeled "Chart", Chart and Ok labels in one time is "Chart+", "Chart" and "Best" is labeled "Best+"
- The color in the first column of table 1 indicates that the strategy is currently in an open position: green means an open long position, red means an open short position.
In picture bellow you will see good example for trading with check results for last 10 trades, and make desicion for trading when criteries 0.25 ROI and WinRate 50% reached for Top 2 by ROI strategies from all list of them. This example of trading logic in last 20 days (include periods when strategy don't arise 10 trades) give a profit $30+. At the bottom of the screen, you can see Labels with the numbers of the strategies that opened the trades. In this example, trades were primarily opened using strategy number 2, and the second most effective strategy after the 20-day backtest was strategy number 9
Who can promise you'll make a profit of $30 in the next 20 days with a drawdown of no more than $8 from the initial $20 with invest in one trade just 2.7$? No one. But this script guarantees that in the future it will repeat the same logic of switching trading strategies that brought profit over the last 20 days
Risk management options
- When a buy or sell trade is opened, you'll see three lines on the chart: a red stop-loss line (SL), a green take-profit line (TP), and a blue line representing the entry price. The trade will be closed if the high price or low price reaches the line TP or SL (no wait for bar close) and alert will be triggered once per bar when script recalculates
- Several options are available to control the behavior of SL/TP lines, such as stop-loss by percentage, ATR, or Highest High (HH) and Lowest Low (LL). Take Profit can be in percent, ATR or in Risk Reward ratio. There some Trailing Stop with start trail trigger options, like ATR, percent or HH / LL
- Additionally, in risk managment settings a function has been implemented for adding a position when the breakeven level expressed in the current ROI is reached for opened trade (splitting position). The position is added within the bar.
- Webhook alerts in TTA format with message contained next info : Buy / Sell or adding Quantity, Leverage, SL price, TP price and close trade
Keep in mind if the stop-loss changed when adding a position, the stop-loss will not be able to be higher than the current bar's low price, regardless of your settings, as backtest trades do not use intra-bar data, in this situation SL will be correct at next bar (but alert message don't be sended twice). And please note that this script does not have an option to simultaneously open trades in different directions. Only 1 trade can be opened for 1 trading instrument at a time
Backtest Engine
Backtest is a very important part of this script. Here describe how its calculate:
- Profit or Loss is USD: close trade price * open trade quantity - open trade price * open trade quantity - open trade quantity * (open trade price + close trade price)/2 * commision fee
Possible slippage or alert sending delay needed to be include in commission % which you will set in risk managment settings block, default settings is 0.15% (0,06% for open, 0,06% for close and 0,03% for possible slippage or additional fees)
- Maximum Draw Down: Drawdown = (peak - current equity) / peak * 100 ;
Drawdown > maxDrawdown ? maxDrawdown = Drawdown
- ROI: profit result in USD / sum of all positions margin
- CalMAR Ratio: ROI / (-MaxDrawDown)
- Sharpe Ratio: ROI / standard deviation for (Sum of all Profits and Loses) / (Sum of all Position Margins)
This description was added because in metrics i don't use parameters like "The risk-free rate of return". Keep in mind how exactly this script calculate profit and perfomance when adjusting key criteria in the strategy switching parameters block of script settings
Strategies itself
For trading, you can enable or disable various Higher Timeframes Filters (ADX, volatility, technical rating).
With filters enabled, trades will only open when the setting parameters are reached
- Strategy number 1, 2 and 3: is Higher Timeframe TradingView Technical Ratings itself, 1 is summary total rating, 2 is oscillators and 3 is moving averages. When TR filter cross filter levels trade will be open at chart bar close. By Default on chart you see Summary Technical Rating oscillator, but here the options for change it to Oscillator TR or Moving Average TR
- Strategy number 4, 5 and 6: is Chart TimeFrame TR. Trades will open when its values (Summary, Oscillators and Moving Averages) reached setting buy sell level
- Strategy number 7, 8 and 9: is Alternative buy sell logic for Chart TimeFrame TR, trades will open when counting rising or falling values will be reached
- Strategies with number from 10 to 18: is chosen by user adaptive moving averages and oscillators indicators. There in settings you will see many different adaptive length algorithms for trading and different types of moving averages and oscillators. In tooltips in settings you will find very more information, and in settings you will see list of all indicators and algorithms (more than 30 variations). All adaptive strategies have their options in settings for calibrating and plotting
- Strategies with number from 19: its can't be chosen or calibarted, this is needed for avoid overfitting, i try to found mostly time worked strategies and use its with standard settings. In future it's possible to changing current or adding additional strategies. At the time of publication this script uses: Dynamic Swing HH LL (19), Composite indicator (20), %R Exhausting with different signals (21,22,23), Pivot Point SuperTrend (24), Ichimoku Cloud (25), TSI (26), Fib Level RSI (27). I don't plot classic strategies in this script
Let me explain, the value of this script is not in the strategies it includes, but in how exactly it collects the results of their work, how it filters the opening of trades, what risk management it applies and what strategy switching logic it performs. The system itself that you are now reading about represents the main value of this script
Finally if you get access for this script
- You will see many other not described options and possibilities like Kelly position or list of settings for adaptive strategies, also i added many usefull tooltips in script settings
Happy trading, and stay tuned for updates!
DISCLAIMER: No sharing, copying, reselling, modifying, or any other forms of use are authorized for this script, and the information published with them. This script is strictly for individual use. No one know future and Investments are always made at your own risk. I am not responsible for any losses you may incur. Please before investment make sure that chosen logic is enaugh profitable on virtual demo account.
Fair Value Gap / iVFG / Imbalance / MTF SuiteDescription
This indicator detects Fair Value Gaps (FVGs) and Imbalances across up to 10 user-selected timeframes and manages them with precise retest handling and clean visualization options.
What’s unique
3-candle FVG detection per timeframe (no lookahead).
Retest handling: on the first touch the touched edge snaps to the retest wick and the zone recolors (fresh → retested).
Right-side projection limits to avoid endless extensions.
Deterministic multi-TF overlay: HTF zones are computed independently (lookahead off) and drawn in a stable, priority-based order.
iFVG / parked zones: optionally convert a filled gap into an iFVG (parked/blue) instead of deleting/greying it.
Optional Imbalance Add-on (3-candle), with split halves + 50% midline.
How it works (technical)
FVG logic (3 candles):
Bullish when low > high (gap up); Bearish when high < low (gap down).
The created box spans the untraded range of candle B and starts at time .
Retest behavior:
On the first wick-touch, the nearest boundary adapts to the wick extreme. If enabled, the box recolors to a “retested” palette.
Projection:
Boxes extend to the right; optional bar limit constrains length.
Display limits:
FIFO pruning per direction keeps only the newest N boxes; iFVG/grey pools can share or use separate limits.
Imbalance Add-on (optional):
Classic 3-candle imbalance; draws upper/lower halves and an optional 50% midline.
No lookahead / confirmation:
Calculations run with barmerge.lookahead_off; detection finalizes on bar close (repaint-free on close).
How to use
Treat fresh gaps as potential reaction zones or confluence with liquidity / structure.
Use retested gaps for continuation or rejection logic.
Limit right-projection and visible count to keep charts readable on lower TFs.
Combine with your own execution rules (entries, stops, partials).
Key settings
General: adjust/recolor on retest, right-side limit (bars).
Display Limits: max visible per direction; separate iFVG cap if desired.
Visuals: filled vs. outline, transparency, TF labels (auto or custom), label alignment.
Theme: presets (Pegasus Classic, Icefire, Solarized, Heatmap, Pastel, Monochrome) or Custom colors.
Timeframes: enable up to 10 TF slots (e.g., M1/M5/M15/H1/H4/D1…).
Add-on — Imbalance: enable/disable, midline on/off, filled/outline, colors.
Alerts
New Bullish FVG
New Bearish FVG
Add-on: New Bullish Imbalance
Add-on: New Bearish Imbalance
Notes & limitations
FVG detection is confirmed on bar close; intrabar retest recolor can occur as price interacts.
Historical rendering depends on chart history & session settings.
Many TFs + large box counts can be heavy; use projection limits and display caps for performance.
This tool does not generate trade signals; it visualizes inefficiencies for discretionary or rules-based workflows.
Disclaimer
For educational and informational purposes only. Not financial advice.
Access / Support: Invite-only. For access or assistance, please DM.

Multi-Timeframe MACD with Color Mix (Nikko)Multi-Timeframe MACD with Color Mix (Nikko) Indicator
This documentation explains the benefits of the "Multi-Timeframe MACD with Color Mix (Nikko)" indicator for traders and provides easy-to-follow steps on how to use it. Written as of 05:06 AM +07 on Saturday, October 04, 2025, this guide focuses on helping you, as a trader, get the most out of this tool with clear, practical advice before diving into the technical details.
Benefits for Traders
1. Multi-Timeframe Insight
This indicator lets you see momentum trends across 15-minute, 1-hour, 1-day, and 1-week timeframes all on one chart. This big-picture view helps you catch both quick market moves and long-term trends without flipping between charts, saving you time and giving you a fuller understanding of the market.
2. Visual Momentum Representation
The background changes from red to green based on short-term (15m) momentum, giving you a quick, easy-to-see signal—red means bearish (prices might drop), and green means bullish (prices might rise). The histogram uses a mix of red, green, and blue colors to show the combined strength of the 1-hour, 1-day, and 1-week timeframes, helping you spot strong trends at a glance (e.g., a bright mix for strong momentum, darker for weaker).
3. Enhanced Decision-Making
The background and histogram colors work together to confirm trends across different timeframes, making it less likely you’ll act on a false signal. This helps you feel more confident when deciding when to buy, sell, or hold.
4. Proactive Alert System
You can set alerts to notify you when the percentage of bullish timeframes hits your chosen levels (e.g., below 10% for bearish, above 90% for bullish). This keeps you in the loop on big momentum shifts without needing to watch the chart all day—perfect for when you’re busy.
5. Flexibility and Efficiency
You can turn timeframes on or off, adjust settings like speed of the moving averages, and tweak transparency to fit your trading style—whether you’re a fast scalper or a patient swing trader. Everything is shown on one chart, saving you effort, and the colors make it simple to read, even if you’re new to trading.
How to Use It
Getting Started
Add the Indicator: Load the "Multi-Timeframe MACD with Color Mix (Nikko)" onto your TradingView chart using the Pine Script editor or indicator library.
Pick Your Timeframes: Turn on the timeframes that match your trading—use 15m and 1h for quick trades, or 1d and 1w for longer holds—using the enable_15m, enable_1h, enable_1d, enable_1w, and enable_background options.
Reading the Colors
Background Gradient: Watch for red to signal bearish 15m momentum and green for bullish momentum. Adjust the Background_transparency (default 75%, or 25% opacity) if the chart feels too busy—try lowering it to 50 for clearer candlesticks in fast markets.
Histogram and EMA Colors:
The histogram and its Exponential Moving Average (EMA) line show a mix of red (1-week), green (1-day), and blue (1-hour) based on how strong the momentum is in each timeframe.
Brighter colors mean stronger momentum—white (all bright) shows all timeframes are pushing up hard, while darker shades (like gray or black) mean weaker or mixed momentum.
Turn off a timeframe (e.g., enable_1h = false) to see how it changes the color mix and focus on what matters to you.
Setting Alerts
Set Your Levels: Choose a threshold_low (default 10%) and threshold_high (default 90%) based on your comfort zone or past market patterns to catch big turns.
Get Notifications: Use TradingView alerts to get pings when the market hits your set levels, so you can act without staring at the screen.
Practical Tips
Pair with Other Tools: Use it with support/resistance lines or the RSI to double-check your moves and build a solid plan.
Tweak Settings: Adjust fast_length, slow_length, and signal_smoothing to match your asset’s speed, and bump up the lookback (default 50) for steadier trends in wild markets.
Practice First: Test different timeframe combos on a demo account to find what works best for you.
Understanding the Colors (Simple Explanation)
How Colors Work
The histogram and its EMA line use a color mix based on a simple idea from color theory, like mixing paints with red, green, and blue (RGB):
Red comes from the 1-week timeframe, green from 1-day, and blue from 1-hour.
When all three timeframes show strong upward momentum, they blend into bright white—the brightest color, like a super-bright light telling you the market’s roaring up.
If some timeframes are weak or pulling down, the mix gets darker (like gray or black), warning you the momentum might not be solid.
Brighter is Better
Bright Colors = Strong Opportunity: The brighter the histogram and EMA (closer to white), the more all your chosen timeframes are in agreement that prices are rising. This is your signal to think about buying or holding, as it points to a powerful trend you can ride.
Dark Colors = Caution: A darker mix (toward black) means some timeframes are lagging or bearish, suggesting you might wait or consider selling. It’s like a dim light saying, “Hold on, check again.”
Benefit in Practice: Watching the brightness helps you jump on the best trades fast. For example, a bright white histogram on a green background is like a green traffic light—go for it! A dark gray on red is like a red light—pause and rethink. This quick color check can save you from bad moves and boost your profits when the trend is strong.
Why It Helps
These colors are your fast friend in trading. A bright histogram means all your timeframes are cheering for an uptrend, giving you the confidence to act. A dull one tells you to be careful, helping you avoid traps. It’s like having a color-coded guide to pick the hottest market moments!
Technical Details
Input Parameters
Fast Length (default: 12): Short-term moving average speed.
Slow Length (default: 26): Long-term moving average speed.
Source (default: close): Price data used.
Signal Smoothing (default: 9): Smooths the signal line.
MA Type (default: EMA): Choose EMA or SMA.
Timeframe and Scaling
Timeframes: 15m, 1h, 1d, 1w, with on/off switches.
Lookback Period (default: 50): Sets the data window for trends.
Background Transparency (default: 75%): Controls background see-through level.
MACD Calculation
Per Timeframe: Uses request.security():
MACD Line: ta.ema(src, fast_length) - ta.ema(src, slow_length).
Signal Line: ta.ema(MACD, signal_length).
Histogram: (macd - signal) / 3.0.
Background Gradient
15m Normalization: norm_value = (hist_15m - hist_15m_min) / max(hist_15m_range, 1e-10), limited to 0-1.
RGB Mix: Red drops from 255 to 0, green rises from 0 to 255, blue stays 0.
Apply: color.new(color.rgb(r_val, g_val, b_val), Background_transparency).
Histogram and EMA Colors
Color Assignment:
1h: Blue (#0000FF) if hist_1h >= 0, else black.
1d: Green (#00FF00) if hist_1d >= 0, else black.
1w: Red (#FF0000) if hist_1w >= 0, else black.
Final Color: final_color = color.rgb(min(r, 255), min(g, 255), min(b, 255)).
Plotting: Histogram and EMA use final_color; MACD (#2962FF), signal (#FF6D00).
Alerts
Bullish Percentage: bullish_pct = (bullish_count / bullish_total) * 100, counting hist >= 0.
Triggers: Below threshold_low or above threshold_high.
--------------------------------------------------------------------
Conclusion
The "Multi-Timeframe MACD with Color Mix (Nikko)" is your all-in-one tool to spot trends, confirm moves, and trade smarter with its bright, easy-to-read colors. By using it wisely, you can sharpen your market edge and trade with more confidence.
This README is tailored for traders and reflects the indicator's practical value as of 05:06 AM +07 on October 04, 2025.

JLine RZ+|SuperFundedJLINE with Resistance Zone+ — Quick Guide
What it is
This indicator generalizes the classic “JLINE” concept by letting you choose the MA type (SMA / EMA / WMA) and by converting mixed-order phases—when the fast/mid/slow MAs temporarily overlap—into forward-projected horizontal zones. It also shows a status label (current timeframe) and an optional higher-timeframe (HTF) status so you can align entries with broader trend context.
Why this is not a simple mashup
・Structure first: Instead of merely plotting MAs, the script detects mixed-order windows and tracks the max/min envelope formed by the 3 MAs during the overlap, then freezes and extends that range to the right as tradable zones (dynamic S/R derived from regime transitions).
・Context layering: You get a clear “Bullish/Bearish Perfect Order vs Mixed Zone” state, a color-coded MA band, and forward zones that persist beyond the regime change. This provides a workflow (identify structure → watch reactions at projected zones → confirm with status).
・Top-down alignment: The HTF status overlay makes it easy to avoid counter-trend trades or, if you prefer, time mean-reversion only when the current timeframe’s mixed zones line up with HTF conditions.
How it works (concise)
1. Compute fast/mid/slow MAs using your selected type (SMA/EMA/WMA).
2. Define states: Bullish Perfect Order (fast > mid > slow), Bearish Perfect Order (fast < mid < slow), or Mixed Zone (neither).
3. While Mixed, maintain an envelope using the highest/lowest of the three MAs. When the regime exits Mixed, save that envelope as a horizontal box and extend it into the future (older boxes auto-delete to keep the chart clean).
4. Paint an MA band between fast & slow with state-aware shading.
5. Show a corner label with the current state; optionally add the HTF state via request.security.
Parameters (UI mapping)
1. Moving Average Settings
・MA Type: SMA / EMA / WMA.
・Fast/Middle/Slow Period: Default 20/100/200, editable.
・Paint MA Band: Toggle the band fill between fast and slow MA.
2. Resistance Zone Settings
・Show Resistance Zone: Draw horizontal zones from mixed-order windows and extend to the right.
・Max Number of Zones: Cap the count; oldest zones are removed automatically.
・Zone Color: Set zone color/opacity.
3. Status Display Settings
・Show Status Label: On-chart label showing the current state.
・Label Position: Top/Bottom × Left/Right.
4. Multi-Timeframe Settings
・Show Higher Timeframe Status: Display the HTF state in the label.
・Higher Timeframe: Select the HTF (empty = disabled).
Practical usage
・Plan around zones: Treat zones as potential support/resistance derived from regime transitions. Observe how price reacts when it revisits/enters a zone.
・Align with trend: Prefer entries with the PO state (e.g., longs in Bullish PO) and use HTF status to filter. Mean-reversion is still possible, but require clear reaction (wick rejections, engulfings) at a zone.
・Manage clutter: If charts get busy, increase timeframe or lower “Max Number of Zones.”
・Risk first: SL beyond the opposite side of the zone; TPs can target adjacent zones or fixed R-multiples.
Notes & limitations
・Zones reflect MA-structure (mixed) envelopes, not price consolidations per se; they are structural guides, not guarantees.
・HTF readouts rely on request.security and your chosen timeframe; data quality and timing follow TradingView constraints.
Disclaimer
This tool suggests potential reaction areas; it cannot ensure outcomes. Volatility, news and liquidity conditions may invalidate any setup. Use appropriate position sizing and only risk capital you can afford to lose.
SuperFunded invite-only
To obtain access, please contact me via TradingView DM or the link in my profile.
JLINE with Resistance Zone (Advanced) — クイックガイド(日本語)
概要
本インジは、任意のMAタイプ(SMA / EMA / WMA)で高速・中速・低速の3本を描画し、順序が混在する期間(Mixed)で形成された3MAの最大値/最小値の包絡を水平ゾーンとして将来に延長して表示します。さらに、現在の状態ラベルと、任意で上位時間足(HTF)の状態も重ねて表示できます。
新規性(単なる寄せ集めではない点)
・構造を先に特定:MAを出すだけでなく、混在期間を検出→その間の3MA包絡を凍結して水平帯に変換→右に延長。レジーム転換由来のS/Rを作ります。
・文脈レイヤー:Bullish/BearishのパーフェクトオーダーとMixedを明示、MAバンドと将来に残るゾーンで、構造→反応→確認の手順が取りやすい構成。
・トップダウン整合:HTF状態をラベルに併記して、逆行を避けたり、逆張りでも根拠を強めたりできます。
使い方のヒント
ゾーン中心で計画:ゾーンはレジーム転換に基づく潜在的S/R。再訪時のローソク足の反応(ピンバー、包み足など)を確認してからエントリー。
トレンド整合:可能ならPO方向に合わせる。逆張りは明確な反応が条件。
視認性:時間軸を上げるか Max Number of Zones を下げて整理。
リスク管理:損切りは帯の反対側、利確は隣接ゾーンやR倍数で。
免責
ゾーンは反発を保証しません。ニュース・流動性の急変で機能しない場合があります。資金管理の徹底と自己責任でのご利用をお願いします。
SuperFunded招待専用スクリプト
このスクリプトはSuperFundedの参加者専用です。

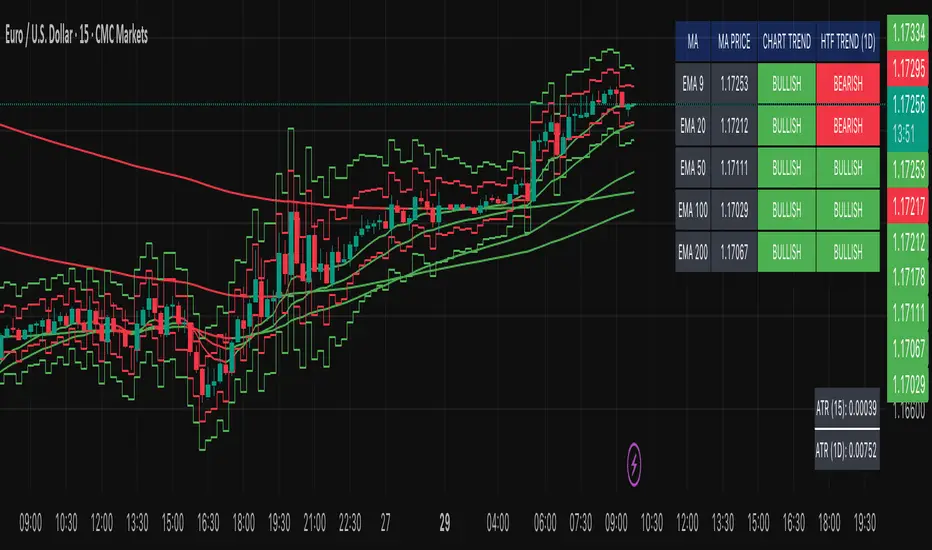
Multi-MA Trend Indicator with ATR by nkChartsThe MMA-ATR is a powerful all-in-one tool that combines multi-timeframe Moving Averages with ATR-based Stop Loss & Take Profit levels. It is designed to help traders quickly assess trend direction, volatility, and potential trade levels in one clean visual setup.
Key Features
Multi-MA Trend Detection
Plots 5 customizable moving averages (choose from EMA, SMA, RMA, WMA, VWMA).
Automatic color coding: Bullish (green), Bearish (red), Neutral (gray).
MA Trend Table with:
MA values
Current chart trend
Higher timeframe (Daily) trend confirmation
ATR-Based Trade Levels
Dynamic Stop Loss (SL) and Take Profit (TP) levels based on ATR multipliers.
Separate visual lines for long and short setups.
ATR Table with:
ATR value for the current chart timeframe
ATR value for the Daily timeframe
Customizations
Choose MA type, length, and price source.
Customize bullish, bearish, and neutral colors.
Adjustable table position and text size.
Fully configurable ATR length, multipliers, and colors.
How to Use
Add the indicator to your chart.
Use the MA Trend Table to identify short-term and higher timeframe trend direction.
Refer to ATR-based SL/TP levels to manage risk and potential profit targets.
Combine both to filter entries and improve trade timing.
Best For
Swing traders and intraday traders who rely on trend confirmation and volatility-based risk management.
Traders looking for a multi-timeframe confirmation system that reduces noise.
⚠️ Disclaimer: This indicator is for educational purposes only. It does not provide financial advice or guarantee profits. Always perform your own analysis before making trading decisions.
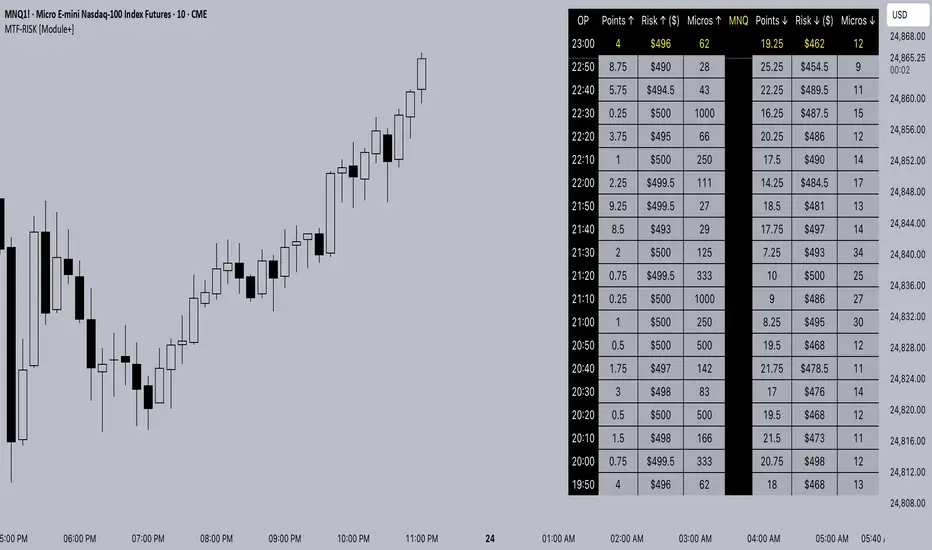
MTF-RISK [Module+]Description
MTF-RISK is a futures risk management tool that calculates standardized position sizing across multiple CME micro contracts, anchored to higher-timeframe structure. By combining multi-timeframe reference levels with a contract-based dollar-per-point model, it allows traders to maintain consistent risk across different futures markets.
Example:
User has selected the 1H timeframe for the risk table. Once an hourly candle closes, the high and low of that completed hour are locked as reference boundaries.
Lower timeframe candles (e.g., 1m, 5m, 15m) reference these established 1H boundaries to calculate:
Distance in points from the current close to the HTF high or low.
Corresponding dollar risk based on the user-defined Max Risk per Trade ($) setting.
The risk table updates in real-time, showing the current stop distance, calculated contract size, and resulting risk in dollars for both upward and downward directions.
Benefit: Traders always maintain a fixed dollar risk, regardless of intraday price movement, while using HTF structure as the anchor for accurate and consistent position sizing.
1. Higher Timeframe Anchor
Always uses the last fully closed candle from the selected higher timeframe (default: 60m).
Captures the prior HTF high and low as reference boundaries.
Lower timeframe closers (e.g., 1m, 5m, 15m bars) reference these established HTF boundaries to measure stop distances and calculate risk.
Use: Ensures all position sizing is tied to completed HTF structure, providing a consistent framework for intraday trades.
2. Risk Model Engine
Traders define maximum dollar risk per trade.
The system calculates allowable micro contracts based on stop distance (current close → HTF high/low).
Supported contracts and their point values:
MNQ (Micro Nasdaq 100): $2.00 per point
MES (Micro S&P 500): $5.00 per point
MYM (Micro Dow Jones): $0.50 per point
MGC (Micro Gold): $10.00 per point
Formula:
Contracts = Max Risk ÷ (Stop Distance × TSE:VALUE per Point)
Risk ↑: Based on distance to HTF high.
Risk ↓: Based on distance to HTF low.
Use: Provides consistent dollar risk sizing across different futures contracts and multiple intraday timeframes.
3. Risk Table Overlay
Compact, real-time on-chart table with customizable styling.
Columns:
OP: Operation time (adjusted by user’s timezone offset).
Points ↑ / ↓: Stop distances in points relative to HTF boundaries.
Risk ↑ / ↓ ($): Dollar exposure at those stops.
Micros ↑ / ↓: Allowable contract count.
Asset: Displays selected futures contract in the header.
Custom features:
Independent text/background colors per column.
Highlighted latest row for clarity.
Adjustable outline, row colors, and text size.
Use: Gives traders immediate insight into position sizing without leaving the chart.
Intended Use:
This is a risk visualization module, not a trade signal generator. Traders can use it to:
Standardize risk sizing across multiple CME micro futures.
Quickly evaluate trade setups relative to HTF structure.
Measure stop distances from lower timeframe closes while referencing HTF boundaries.
Maintain consistency in risk management regardless of the instrument traded.
Limitations & Disclaimers:
Calculations assume standard CME tick values for MNQ, MES, MYM, and MGC.
Other markets may not align with these dollar-per-point values.
This indicator does not predict direction, generate entries, or guarantee outcomes.
For educational and informational purposes only.
Trading involves risk; always use proper risk management.
Closed-source (Protected): Logic is visible on charts, but source code is hidden.
Trend Compass (Manual)## Trend Compass (Manual) - A Discretionary Trader's Dashboard
### Summary
Trend Compass is a simple yet powerful dashboard designed for discretionary traders who want a constant, visual reminder of their market analysis directly on their chart. Instead of relying on automated indicators, this tool gives you **full manual control** to define the market state across different timeframes or conditions.
It helps you stay aligned with your higher-level analysis (e.g., HTF bias, current market structure) and avoid making impulsive decisions that go against your plan.
### Key Features
- **Fully Manual Control:** You decide the trend. No lagging indicators, no confusing signals. Just your own analysis, displayed clearly.
- **Multiple Market States:** Define each row as an `Uptrend`, `Downtrend`, `Pullback`, or `Neutral` market.
- **Customizable Rows:** Display up to 8 rows. You can label each one however you like (e.g., "D1", "H4", "Market Structure", "Liquidity Bias").
- **Flexible Panel:** Change all colors, text sizes, and place the panel in any of the 9 positions on your chart.
- **Clean & Minimalist:** Designed to provide essential information at a glance without cluttering your chart.
### How to Use
1. **Add to Chart:** Add the indicator to your chart.
2. **Open Settings:** Go into the indicator settings.
3. **Configure Rows:**
- In the "Rows (Manual Control)" section, set the "Number of rows" you want to display.
- For each row, give it a custom **Label** (e.g., "m15").
- Select its current state from the dropdown menu (`Uptrend`, `Downtrend`, etc.).
- To remove a row, simply set its state to `Hidden`.
4. **Customize Style:**
- In the "Panel & Visual Style" section, adjust colors, text sizes, and the panel's position to match your chart's theme.
This tool is perfect for price action traders, ICT/SMC traders, or anyone who values a clean chart and a disciplined approach to their analysis.

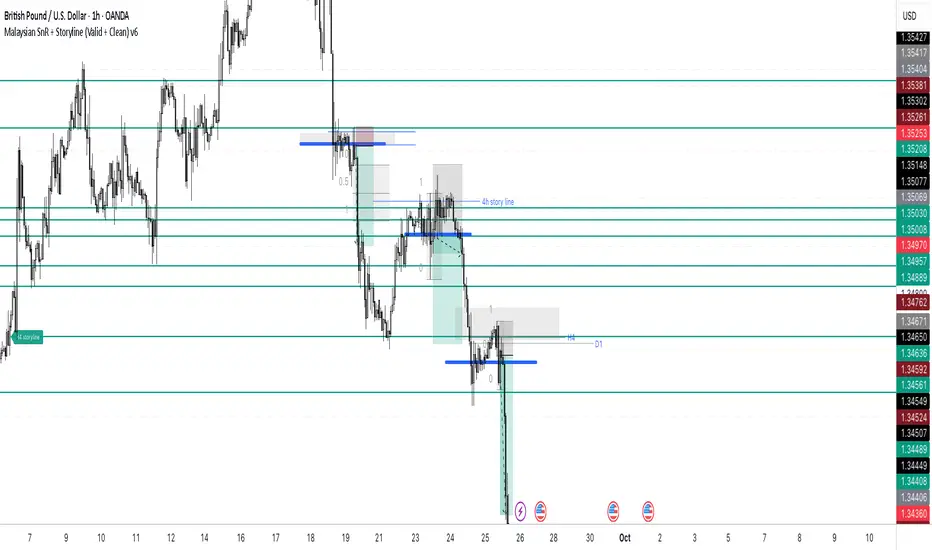
Malaysian SnR + Storyline This indicator combines the Malaysian Support & Resistance (SnR) method with a Multi-Timeframe Storyline view.
🔹 Malaysian SnR (A/V levels)
Plots Support & Resistance using candlestick bodies only (close → open).
“A” shape = Resistance (bullish close → bearish open).
“V” shape = Support (bearish close → bullish open).
Supports Fresh/Unfresh logic with wick-touch validation.
🔹 Storyline (W/D/H4/H1 bias lines)
Weekly = Big map / macro bias.
Daily = Medium trend / retracement.
H4 = Intraday bias confirmation.
H1 = Execution bias (entry filter).
Lines extend forward and only update when a new pivot confirms.
🔹 Extra Features
Alignment Rule: option to hide A/V levels when TF biases don’t align (e.g. W=D=H4=H1).
Story Labels: optional text labels describing each TF storyline.
History filter: show storyline for the last X days only, for cleaner charts.
This script is designed for price action traders who want to combine body-based SnR levels with a clear multi-timeframe bias storyline, making it easier to align intraday execution with higher timeframe context.
EMA 200 MultiTF G/R + Cross Alerts by LifeHack Trader1. Indicator Setup
The script starts by defining the version of Pine Script (v5) and creating an indicator called "EMA 200 MultiTF G/R + Cross Alerts by LifeHack Trader."
The overlay=true parameter ensures that the indicator is plotted directly on the price chart.
2. Function to Get EMA200
A custom function getEma200 is defined to retrieve the 200-period Exponential Moving Average (EMA) for a specified timeframe (tf).
This function uses the request.security function to fetch the close price's EMA from different timeframes.
3. Calculate EMA200 for Multiple Timeframes
The script calculates the EMA200 for four timeframes: 15 minutes ("15"), 1 hour ("60"), 4 hours ("240"), and 1 day ("D").
These values are stored in variables (ema15, ema1h, ema4h, ema1d) and represent the EMA for each timeframe.
4. Determine Price Above or Below EMA200 (G/R)
For each timeframe, the script checks whether the closing price is above or below the EMA200.
It uses boolean checks to determine if the price is above the EMA200, assigning the status "G" (Green) for above and "R" (Red) for below.
5. Cross Signal Detection (Up/Down)
The script detects crossovers and crossunders between the price and EMA200 for each timeframe.
A crossover signal is detected when the price crosses above the EMA200 (bullish), and a crossunder signal is detected when the price crosses below the EMA200 (bearish).
These signals are stored in separate variables (crossUp, crossDown).
6. Display a Table with G/R Status and Cross Alerts
A table is created and displayed in the top-right corner of the chart. The table shows the status (G or R) for each timeframe and the cross signal (▲ for crossover, ▼ for crossunder, or - for no cross event).
The table is updated with the respective values for each timeframe every time a new bar is formed.
7. Alert Conditions
The script defines alert conditions based on the crossovers and crossunders.
When a price crosses above the EMA200 (cross-up), an alert is triggered for a potential buy opportunity. When the price crosses below the EMA200 (cross-down), an alert is triggered for a potential sell opportunity.
Alerts are configured for each timeframe (15 minutes, 1 hour, 4 hours, and 1 day).
This script provides a comprehensive system for monitoring price action relative to the EMA200 on multiple timeframes, highlighting crossovers, and delivering visual feedback and alerts based on the price's relationship with the EMA.

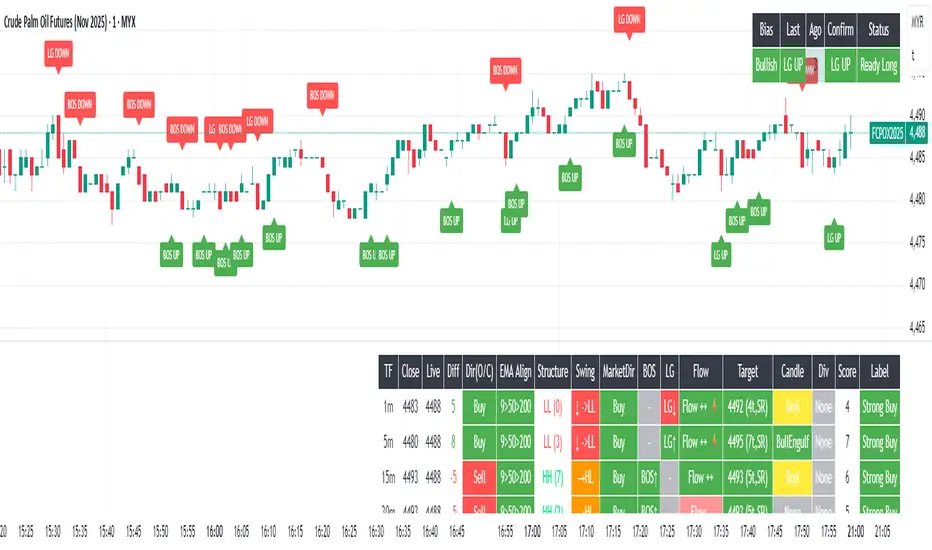
Multi-Timeframe Dashboard INDIpendence AAZ is a powerful Multi-Timeframe Dashboard that provides real-time readings of:
✔ Market Structure
✔ Market Direction
✔ Entry Signals
This tool is designed for Derivatives (Soy, FCPO, etc.), Forex, Crypto, and Global Markets.
Perfect for new traders and those who do not have the time to study charts in detail.
⚠️ Disclaimer: This indicator is for educational and analytical purposes only. All trading decisions and risks remain with the user.
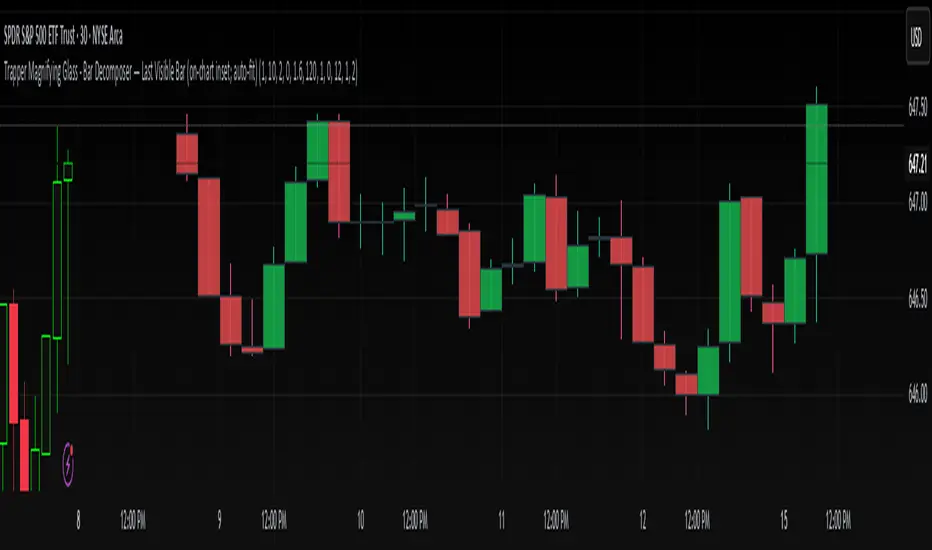
Trapper Magnifying Glass - Bar Decomposer — Last Visible BarHeadline
Decompose any higher-timeframe bar into lower-timeframe candles directly on the chart. Zoom/pan reactive, session-accurate, auto-fit inset, and compliant with TradingView placement limits.
Quick Start
Add the indicator and choose a Child TF (minutes) (e.g., 1, 5, 10, 15).
The inset follows the last visible bar on your screen. Adjust Right separation / Mini width / Gap / Vertical exaggeration as needed.
Leave Show HUD label OFF by default. Turn it on only if you want a compact readout.
Overview
This tool draws a miniature, on-chart inset of lower-timeframe candles that make up the currently viewed higher-timeframe bar. It stays on the main price chart (not in a separate pane), respects zoom/pan, compresses itself to fit available space, and adheres to TradingView’s 500-bar object placement limit.
The design goal is micro-structure inspection without changing the chart timeframe.
What Makes It Different
On-chart inset (not a separate indicator panel) for true visual context.
Zoom/Pan reactive to the last visible bar — works naturally as you navigate.
Auto-fit logic keeps the inset readable while staying inside TradingView’s future-bars limit.
Session-accurate decomposition: uses TradingView’s own lower-timeframe OHLC, exactly within the parent bar’s time window.
Strictly compliant: no synthetic bars, no repaint tricks, no lookahead.
How It Works
Child data is fetched with request.security_lower_tf(syminfo.tickerid, , open/high/low/close).
Only closed lower-TF bars inside the parent bar’s time window are returned by TradingView.
The script maps each child bar to an inset candle (body + wick) scaled to the parent bar’s price range and placed to the right of the parent’s position.
The inset tracks the last visible bar so it always stays relevant to what you’re inspecting.
Inputs (Defaults)
Timeframes
Child TF (minutes): 1 (min 1, max 1440)
Layout
Right separation (bars): 10
Mini candle width (bars): 2
Gap between mini candles (bars): 0
Vertical exaggeration ×: 1.6
Auto-Fit
Auto-fit inset width: ON
Max bars ahead to use: 120
Minimum mini width: 1
Minimum gap: 0
Style
Bull/Bear colors: ON
Body Bull / Body Bear / Wick Bull / Wick Bear: configurable
Body Fill Opacity (0–100): 12
Outline color: dark grey
Outline width: 1
Wick width: 2
HUD
Show HUD label: OFF (recommended default; enable only when you need a summary)
Session Behavior (Important)
TradingView constructs bars strictly by exchange sessions. For US equities (regular session 09:30–16:00, 390 minutes):
On a 1h chart you will see 7 bars per day:
09:30–10:00 (30 minutes)
10:00–11:00, 11:00–12:00, 12:00–13:00, 13:00–14:00, 14:00–15:00 (five full hours)
15:00–16:00 (full hour)
Decomposing the 09:30–10:00 bar into 1m returns 30 minis (not 60).
Decomposing 10:00–11:00 returns 60 minis, as expected.
The last hour (15:00–16:00) decomposes to 60 minis once they exist (i.e., immediately after each child bar closes). If you are mid-session, you will see only the minis that have closed so far.
This is by design and ensures the inset reflects the true lower-timeframe structure TradingView has for that exact bar window. Nothing is synthesized.
Live vs Confirmed Bars
Confirmed bars (historical) always decompose to a full, correct count of child minis for that parent window.
Live bars (currently forming) only return child minis that have already closed. Mid-hour on a 1h chart with 10m children, you might see 3, 4, or 5 minis depending on elapsed time.
This script’s default experience focuses on the last visible bar and displays whatever the platform provides at that moment. The HUD (when enabled) includes the parent bar duration in minutes to make short session bars explicit.
Auto-Fit and Placement Limits
TradingView prevents drawing objects beyond 500 bars into the future. The inset’s right edge is automatically clamped to stay within that boundary. If the requested number of minis would overflow the allowed space, the script proportionally compresses mini width/gap (down to your configured minimums). If necessary, it draws only as many minis as safely fit — favoring stability over clutter.
Styling Tips
For dense decompositions (e.g., 1m inside 1h), set:
Mini width = 1, Gap = 0, Auto-fit = ON, Right separation = 7–12.
Increase Vertical exaggeration to highlight wick-to-body differences when the parent bar is narrow.
Keep HUD OFF for publishing and screenshots unless you’re highlighting counts or session duration.
Notes & Limitations
Child arrays show closed bars only. No forming mini is displayed to avoid misleading totals.
If you reload a chart or switch symbols/timeframes, the most recent confirmed bar’s arrays may be empty on the very first calculation frame; the script guards against this and will draw on the next update.
The tool is an overlay visualization, not a signal generator; there are no alerts or trading advice.
Performance: heavy decompositions on very fast symbols/timeframes can add many objects. Auto-fit and minimal widths help.
Compliance
Uses only native TradingView data (request.security_lower_tf).
No repainting and no lookahead.
No external feeds, synthetic candles, or hidden calculations that would misrepresent the underlying data.
Fully respects TradingView’s object placement constraints.
Recommended Defaults (for broad usability)
Child TF: 5 or 15 (depending on your HTF).
Right separation: 7–12
Mini width / Gap: 2 / 0 for clarity, 1 / 0 for dense fits.
Auto-fit: ON
HUD: OFF
Troubleshooting
“Why aren’t there 60 one-minute minis in this 1h bar?”
Either the parent bar is a session-short bar (09:30–10:00 = 30 minutes) or you are viewing a live bar mid-hour; only closed minis appear.
Inset clipped or not visible to the right:
Increase Max bars ahead to use (Auto-Fit group), reduce Mini width/Gap, or reduce Right separation.
Nothing draws on first load:
Wait for the next bar update, or navigate the chart so the last visible bar changes; arrays refresh as data becomes available.
Change Log
v1.0 – Initial public release.
On-chart inset, zoom/pan reactive, auto-fit width.
Session-accurate lower-TF decomposition.
HUD label toggle (off by default) with child TF, bar count, and parent duration.
Hardened array handling for confirmed snapshots.
Disclaimer
This script is provided strictly for educational and informational purposes only.
It does not constitute financial advice, investment advice, trading signals, or a recommendation to buy or sell any security, asset, or instrument. Trading and investing involve risk; always do your own research and consult with a licensed financial professional before making decisions.
Trade Holding Time Background HighlighterTrade Holding Time Background Highlighter
This script visually highlights the chart background based on how old each bar is relative to the current time. It’s designed for crypto futures traders (and other active traders) who want to quickly see whether price action falls inside a day trading window, a swing trading window, or is considered older history.
⸻
🔑 Features
• Dynamic Background Highlighting
• Day Trader Zone (default = last 24 hours, light green).
• Swing Trader Zone (default = last 2 weeks, light yellow).
• Older Zone (beyond 2 weeks, light gray).
• Customizable Colors
• Choose your own background colors for each zone.
• Adjust opacity to make shading subtle or bold.
• Adjustable Timeframes
• Change day trading hours (default: 24 hours).
• Change swing trading window (default: 14 days).
• Simple, Intuitive Design
• Instantly see whether the current market structure is suitable for scalps/day trades, swing trades, or simply part of older price action.
⸻
🎯 Why Use This?
As a futures/perpetual trader, knowing the context of price action is crucial:
• Scalpers/Day Traders focus on the most recent 24h.
• Swing Traders look back 1–2 weeks.
• Anything older often has less weight for short-term setups.
This script highlights those zones automatically, saving you time and giving clarity on whether you’re trading inside a fresh opportunity window or old, less relevant price action.


Zone Cluster Confluence ProWhat it does
Zone Cluster Confluence Pro automatically finds price “zones” via equal-frequency clustering of HLC3 values and wraps each cluster center with an ATR-based band. Zones are color-coded by a 0–100 Strength % and can optionally highlight confluence with a higher timeframe (HTF) right on your chart.
Key features
• Adaptive Depth by Volatility (ATR regime): zone width scales down in calm markets and widens in volatile regimes.
• Strength % scoring with color mapping (Strong / Work / Mid / Weak). The score blends:
• number of touches (with tolerance),
• dwell time inside the zone (penalized),
• confirmed breakouts (penalized),
• average overshoot beyond the band (penalized),
• recency bonus,
• optional volume-boosted touches (volume > SMA × multiplier).
• HTF Confluence Overlay: computes zones on a higher TF (multiplier of the source TF or a specific TF) and highlights the intersection of LTF zones with the nearest HTF zone (white fill).
• Presets per TF: Aggressive / Stable / Anti-pierce profiles with hand-tuned params for 15/30/60/120/240m; or run fully Manual.
• Clean visuals: centers, borders, filled bands; strength labels with auto-contrast text.
How it works (high level)
• Clustering method: choose K-median or K-means (median/mean of equal-frequency buckets) to place zone centers.
• Zone width = ATR × Depth; Depth becomes Adaptive when the ATR regime deviates from its long SMA.
• Strength % is computed over a lookback window using the components listed above; touches can earn an extra bonus on elevated volume.
Inputs (most useful)
• Source TF: inherit from chart or pick a specific TF.
• Zones (k): 2–5 clusters.
• Presets: Aggressive / Stable / Anti-pierce, or Manual control of Candles Back, ATR length, Depth.
• Adaptive Depth: on/off, regime thresholds & multipliers.
• Strength %: profile (Conservative/Neutral/Optimistic), lookback, breakout/overshoot/touch tolerance.
• Volume boost: SMA length, spike multiplier, weight.
• HTF Confluence: on/off, TF multiplier, HTF preset/method/params, and whether HTF k mirrors LTF k.
Reading the chart
• Zone fills are colored by Strength %:
• 80–100 Strong, 60–80 Work, 40–60 Mid, <40 Weak.
• White fills mark LTF×HTF intersections (confluence areas).
• Strength labels (Z1…Z5) show the current score; label background matches the strength color.
Tips
• Use Stable for most markets, Aggressive for fast intraday, Anti-pierce to reduce whipsaw.
• Turn on HTF confluence to filter LTF zones down to areas aligned with the larger trend structure.
• If you scalp, keep volume boost on; for thin markets consider lowering the spike multiplier.
Notes
• No lookahead is used for HTF data (request.security with lookahead_off).
• Zones update as new bars arrive and as the lookback window rolls; this is not a fixed S/R drawing tool.
• Works on any symbol/timeframe; parameter tuning is encouraged.
Access
This script is Invite-Only.
Disclaimer
For educational purposes only. Not financial advice. Trading involves risk.

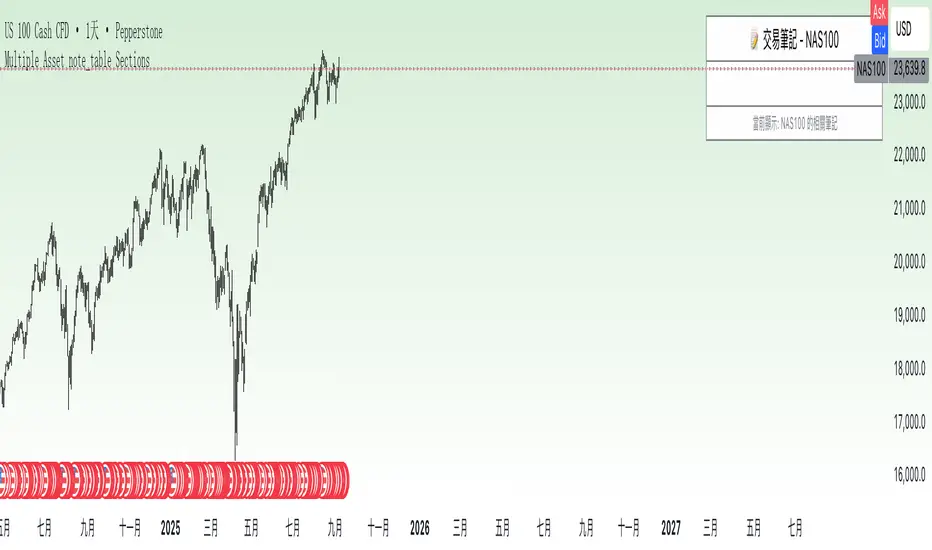
Multiple Asset note_table Sections### Features
- **Expanded to 10 independent Sections**: Each Section has a title, content, and associated asset
- **Asset-based filtering**: Section only displays when the Section's asset name is empty or matches the current chart asset
- **Empty asset setting retained**: If Section asset name is left blank, that Section will display across all assets
- **Automatic display of current asset**: Current asset name is automatically shown in the header and footer
### Usage Instructions
1. Each Section can be assigned a specific asset name, such as "BTCUSDT", "ETHUSDT", etc.
2. A Section will only display when the current chart asset matches the asset specified for that Section
3. If you want a Section to display across all assets, simply leave the asset name blank for that Section
4. Each Section has independent title and content that can be customized as needed
5. When switching to different trading instruments, the indicator automatically displays notes relevant to the current instrument
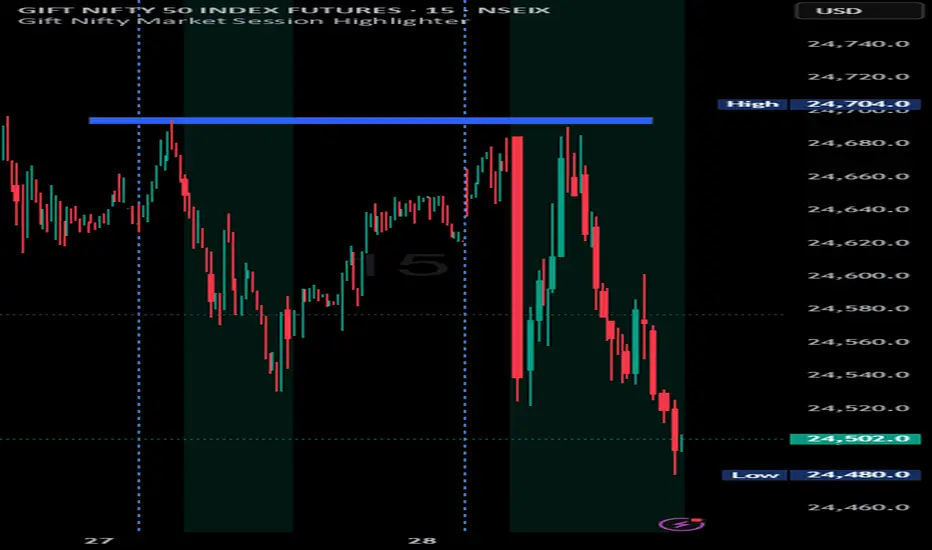
Indian market session on Gift Nifty chartsGift Nifty Market Session Highlighter
This indicator highlights the official Indian market session on Gift Nifty charts — from 9:15 AM to 3:30 PM IST. It shades the background during this time window so traders can instantly identify when the local market is open.
Features:
Marks 9:15 AM to 3:30 PM (IST) session on intraday charts.
Adjustable highlight color and transparency.
Works seamlessly across lower timeframes (1m, 5m, 15m, etc.).
Helps traders align Gift Nifty activity with NSE market hours.
Use Cases:
Quickly distinguish active market hours from overnight or global sessions.
Backtest trading strategies specific to Indian session volatility.
Improv
e focus on expiry-day setups and intraday opportunities.
Disclaimer:
This tool is provided for educational and informational purposes only. It is not financial advice, nor does it guarantee trading success. Always do your own research and consult a licensed financial professional before making investment decisions.
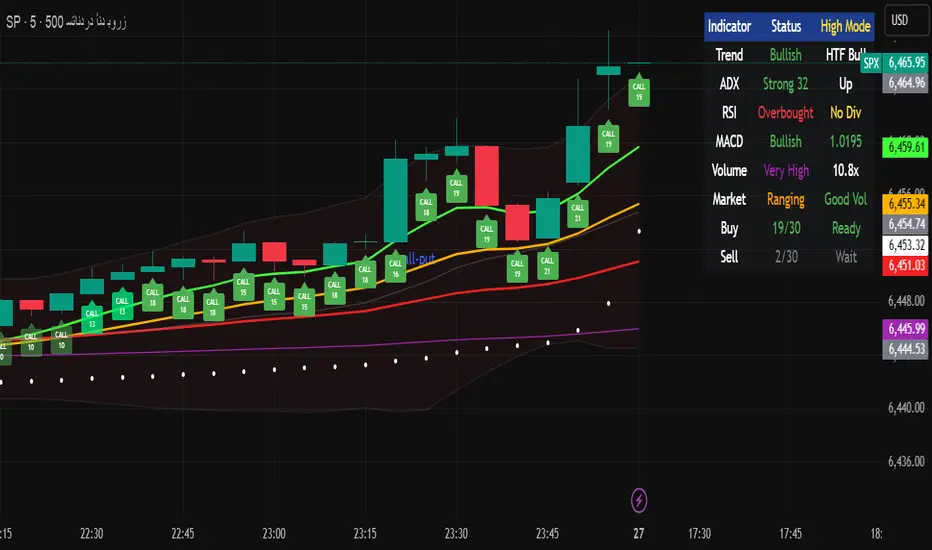
Multi-Timeframe Options Strategy with Dynamic Scoring System## Multi-Timeframe Options Strategy with Dynamic Scoring System
### Overview
This indicator combines 12 technical analysis tools using a proprietary 30-point scoring system to generate options trading signals (CALL/PUT). It's designed for traders seeking confluence-based entries with multiple confirmation layers.
### How the Scoring System Works
The indicator evaluates market conditions across three categories:
**Trend Analysis (9 points maximum):**
- EMA Alignment (9, 21, 50, 200): Checks if moving averages are properly stacked (3 points)
- ADX Trend Strength: Confirms trend momentum above 25 threshold (3 points)
- Higher Timeframe Confirmation: Validates signals against larger timeframe trend (3 points)
**Momentum Indicators (7 points maximum):**
- RSI Position & Direction: Optimal zones 40-65 for buys, 35-60 for sells (2 points)
- MACD Signal Line Cross: Momentum confirmation (2 points)
- Stochastic Oscillator: Overbought/oversold conditions (2 points)
- Bollinger Band Position: Price relative to middle band (1 point)
**Market Quality Filters (4 points maximum):**
- Volume Confirmation: 1.5x average volume requirement (2 points)
- VWAP Position: Trend alignment check (1 point)
- ATR Volatility: Ensures adequate price movement (1 point)
### Key Features
**1. Fair Value Gaps (FVG)**
- Identifies price inefficiencies between candles
- Bullish FVG: Current low > high (potential support)
- Bearish FVG: Current high < low (potential resistance)
- Visual representation with colored boxes on chart
**2. Three Operating Modes**
- Normal Mode: Minimum 10 points - balanced signal frequency
- High Mode: Minimum 15 points - fewer but stronger signals
- Ultra Mode: Minimum 20 points - only highest quality setups
**3. Protection Mechanisms**
- Bollinger Band squeeze detection avoids ranging markets
- Prevents conflicting signals (no simultaneous CALL/PUT)
- 5-bar minimum cooldown between signals
- Filters extreme RSI readings (>75 or <25)
**4. Risk Management**
- Three profit targets: 0.5%, 1%, 1.5%
- Stop loss: 0.5% or ATR-based
- Visual target lines with entry/exit levels
### How Components Work Together
The indicator creates a comprehensive market analysis by combining:
- **EMAs** provide the trend structure framework
- **Oscillators** (RSI, Stochastic) identify optimal entry timing
- **ADX** confirms trend strength to filter weak signals
- **Volume** validates institutional participation
- **Higher timeframe** acts as a directional filter
Each component contributes points to either bullish or bearish scoring. Signals only generate when one direction significantly outweighs the other and meets minimum thresholds.
### Usage Instructions
1. **Select Mode**: Choose Normal/High/Ultra based on your trading style
2. **Monitor Dashboard**: Check real-time scoring and market conditions
3. **Wait for Signals**: Main BUY/SELL labels appear when criteria met
4. **Follow Targets**: Use automated TP and SL levels for risk management
5. **Candle Labels**: Optional CALL/PUT labels show building momentum
### Dashboard Information
The dashboard displays:
- Current trend direction and HTF confirmation
- ADX strength and direction
- RSI status with divergence detection
- MACD momentum state
- Volume multiplier
- Market condition (trending/ranging)
- Live scoring for both directions
### Important Notes
- This is a technical analysis tool, not financial advice
- Past performance does not guarantee future results
- Always use proper risk management
- Test thoroughly on demo before live trading
### Originality
This indicator's unique value comes from:
1. The 30-point weighted scoring system that prioritizes different factors
2. Integration of Fair Value Gaps with traditional indicators
3. Multi-mode operation allowing traders to adjust signal frequency
4. Higher timeframe validation system
5. Comprehensive filtering to reduce false signals
The combination creates a systematic approach to options trading that goes beyond simple indicator mashups by providing clear, scored reasoning for each signal.
---
### Updates and Support
For questions or suggestions, please comment below. The indicator will be updated based on community feedback while maintaining compliance with all platform rules.
Multi HTF High/Low LevelsThis indicator plots the previous high and low from up to four user-defined higher timeframes (HTF), providing crucial levels of support and resistance. It's designed to be both powerful and clean, giving you a clear view of the market structure from multiple perspectives without cluttering your chart.
Key Features:
Four Customizable Timeframes: Configure up to four distinct higher timeframes (e.g., 1-hour, 4-hour, Daily, Weekly) to see the levels that matter most to your trading style.
Automatic Visibility: The indicator is smart. It automatically hides levels from any timeframe that is lower than your current chart's timeframe. For example, if you're viewing a Daily chart, the 4-hour levels won't be shown.
Clean On-Chart Lines: The high and low for each timeframe are displayed as clean, extended horizontal lines, but only for the duration of the current higher-timeframe period. This keeps your historical chart clean while still showing the most relevant current levels.
Persistent Price Scale Labels: For easy reference, the price of each high and low is always visible on the price scale and in the data window. This is achieved with an invisible plot, giving you the accessibility of a plot without the visual noise.
How to Use:
Go into the indicator settings.
Under each "Timeframe" group, check the "Show" box to enable that specific timeframe.
Select your desired timeframe from the dropdown menu.
The indicator will automatically calculate and display the previous high and low for each enabled timeframe.

Frozen 4H VWAP – Precision AnchoredFrozen 4H VWAP – Precision Anchored Like Ice
The Frozen 4H VWAP – Precision Anchored delivers a clean, stable, and reliable view of the 4-hour Volume Weighted Average Price, designed for traders who want higher timeframe insights without intrabar noise or repainting.
🔹 Key Features:
Non-Repainting: VWAP value is “frozen” at the close of each 4H candle — no mid-bar updates or flickering.
4H Timeframe Anchoring: Seamlessly pulls 4-hour VWAP values into any timeframe you’re trading on.
Clear Trend Reference: Updates only when a new 4H candle begins, acting as a trustworthy anchor for support/resistance.
Custom Source Option: Choose from different price sources (default: HLC3) to fit your strategy.
Whether you're scalping, day trading, or swing trading, this indicator gives you a powerful edge by grounding your decisions in higher timeframe VWAP data — clear, calm, and frozen in time.

Vantage-XVANTAGE-X – The Market. Decoded.
Your vantage point between bull & bear — clarity, precision, and high-probability trading signals.
VANTAGE-X is a high-probability trading system designed to cut through the noise and deliver clarity at a glance.
🔹 What It Does
• EMA 20 (1H), EMA 50 (4H), EMA 200 (chart timeframe) → Instant bullish/bearish signals
• VWAP → Bullish/Bearish/Neutral, based on last 5 candles for precision
• Daily Bias → Bullish or Bearish without switching charts
• Chop Filter → Detects if market is trending or choppy (last 10 candles)
• Works across all assets on TradingView — futures, forex, stocks, crypto, options
🔹 Why Traders Use It
• Eliminates chart clutter and analysis paralysis
• No more flipping timeframes — dashboard updates automatically
• Clear signals = faster decisions, cleaner trades
🚨 Subscription Access Only – Invite-Only Script
This indicator is available exclusively to subscribed members of VANTAGE-X. Access is tied to your TradingView username and managed manually by our team.
👉 Website coming soon

High Timeframe Candle Overlay (Configurable)HTF Candle Overlay — Read Higher Timeframe on Lower Timeframe Charts
What it does
This indicator draws each selected Higher-Timeframe (HTF) candle directly on your lower-timeframe (LTF) chart. It shows a translucent range box (HTF high–low) and an inner body box (HTF open–close), so you can track how the bigger candle is forming while you analyze lower-timeframe structure, liquidity sweeps, and intrabar reactions.
Why it’s helpful
• See where the current HTF candle opened, where price sits inside its body, and how far wicks extend—without leaving your LTF chart.
• Combine HTF context (e.g., 1H/4H) with LTF execution (e.g., 1m–15m) to spot confluence, S/R flips, and failed breaks faster.
• The overlay is locked to the price scale and anchored by bar index, so it pans/zooms exactly with your chart (no drifting while dragging).
⸻
How it works (under the hood)
• Fetches HTF OHLC via request.security.
• When a new HTF bar starts, the previous HTF boxes are frozen at the true close.
• The current HTF bar updates intrabar (so you see live formation) and is clamped to the correct span.
• Horizontal anchoring uses bar index, and a hidden price plot binds the script to the main price scale for stable zoom/pan behavior.
⸻
Inputs
• High Timeframe (HTF): Default 1H (set any TF you like).
• Show High–Low Box: On/off.
• Show Body Box (Open–Close): On/off.
• Opacity for range/body boxes.
• Bull/Bear Colors and Outline + Width.
• Max HTF Candles to Keep: Auto-deletes older boxes to maintain performance.
⸻
Usage tips
• Popular combos: view 1H or 4H candles while trading 1–15m charts.
• Turn off the range box if you only want a clean HTF body overlay.
• Pair with your session/structure tools; this indicator is visual context only (no signals or alerts).
⸻
Notes & limitations
• Non-repainting for closed HTF bars: once an HTF candle closes, its boxes are fixed. The current/in-progress HTF bar updates until it closes (expected live behavior).
• Data alignment depends on your symbol’s feed and session settings. Heikin Ashi/renko/etc. may not match classic OHLC.
• Heavy history + many boxes can affect performance; reduce “Max HTF Candles to Keep” if needed.
⸻
Disclaimer
This script is for education and charting visualization only. It does not provide financial advice, trade signals, or performance guarantees. Always do your own research and manage risk.
MTF Oscillator Stack [BigBeluga]🔵 OVERVIEW
The MTF Oscillator Stack brings powerful multi-timeframe momentum analysis directly into your price chart. You can select one oscillator— RSI , MFI , or Stochastic RSI —and display it across up to 4 different timeframes. Each panel is neatly stacked horizontally above price , offering quick insight into cross-timeframe conditions like trend direction, exhaustion zones, and momentum shifts.
🔵 CONCEPTS
Single Oscillator Mode: Select one oscillator type (RSI, MFI, or Stoch RSI) to analyze across all selected timeframes.
Top-Chart Horizontal Panels: Oscillator plots are aligned horizontally at the top of the chart for seamless top-down reading.
Signal Comparison Arrows: Arrows (🢁 / 🢃) indicate oscillator position relative to its signal line.
Overbought/Oversold Zones: Transparent 30–70 fill zones highlight key reversal areas.
Dynamic Display Logic: Only enabled panels are shown; spacing adjusts based on active timeframes.
Timeframe Tagging: Each oscillator panel is labeled with its corresponding timeframe (e.g., 1H, 2H, 4H).
🔵 FEATURES
Choose one oscillator (RSI, MFI, or Stoch RSI) and apply it across up to 4 timeframes.
Each oscillator panel includes: price-synced plot, signal line, and zone shading.
Scale alignment allows users to place charts at the bottom or top.
Clear arrow signals show whether oscillator is bullish or bearish.
Individual length and signal settings per timeframe.
Toggle for alignment mode: evenly spaced or floating layout.
All panels use a consistent layout for faster decision-making.
🔵 HOW TO USE
Select your preferred oscillator and activate 2–4 key timeframes (e.g., 1H, 4H, D1, W1).
Use signal crossovers as a bullish (🢁) or bearish (🢃) trend cue.
Look for aligned extremes (e.g., all timeframes overbought) to spot momentum exhaustion.
Ideal for momentum confluence strategies and top-down confirmation.
Use horizontal layout to stay focused on price while assessing broader structure.
🔵 CONCLUSION
MTF Oscillator Stack simplifies complex multi-timeframe momentum analysis into one clean, actionable visual. Whether you're tracking RSI, MFI, or Stoch RSI, this tool helps you stay aligned with the broader trend—without ever leaving your main chart.
