Credit Spreads Swing TradingCredit Spreads Swing Trading
Summary
Credit Spreads Swing Trading is a decision-support indicator designed to identify higher-probability put credit spread (PCS) and call credit spread (CCS) opportunities using trend alignment, momentum shifts, and volatility-aware structure.
The indicator works on any ticker and any timeframe, and includes multiple built-in ticker presets that automatically adjust internal parameters. While it will generate signals on all charts, the on-chart table displays a recommended context to indicate when the current symbol, timeframe, and session conditions match the optimized configuration.
Core Signal Logic
Signals are generated when multiple conditions align:
Momentum shift-
Identifies directional momentum changes that often precede short-term swing continuation.
Trend confirmation-
Ensures trades align with the prevailing trend and avoids counter-trend entries.
Higher-timeframe bias
Incorporates Daily and 4-Hour EMA structure to bias trades in the dominant market direction.
Relative volume filter-
Confirms participation to reduce low-quality signals during thin or inactive periods.
Cooldown logic
Enforces spacing between signals to prevent clustering and over-trading.
Credit Spread Direction & Structure
PCS (Put Credit Spread) signals are generated in neutral to bullish conditions
CCS (Call Credit Spread) signals are generated in neutral to bearish conditions
When a signal triggers, the script calculates a recommended short strike using recent pivot structure and displays it visually on the chart. This level is intended as a reference point for structuring a credit spread, not as an execution instruction.
On-Chart Table (Informational)
The indicator includes a compact table that displays:
Current signal type (PCS or CCS)
Recommended sell-leg strike
Average spacing between historical signals
How often prior sell-legs were crossed before the next signal (visual reference only)
Recommended context status
The recommended context row indicates whether the chart matches the optimized setup:
1-Hour timeframe
Extended hours enabled
Selected ticker preset matches the chart symbol (unless set to Auto)
This recommendation is informational only. Signals are not blocked when the chart does not match the recommended context.
Ticker Presets & Flexibility
Users can select from multiple built-in ticker presets (or Auto), which adjust internal parameters such as:
Momentum sensitivity
Volatility handling
Trend responsiveness
This allows the indicator to adapt to different instruments while maintaining a consistent signal framework.
Important Notes
This indicator does not place trades and does not include automated backtesting or performance reporting.
All statistics and visual markers are for manual review and contextual analysis only.
Signals are intended for experienced traders who understand options risk, assignment risk, and proper position sizing.
Intended Use
Credit Spreads Swing Trading is intended as a research and decision-support tool for traders who sell option premium and want structured, rules-based signals aligned with trend, momentum, and volume.
It should be used alongside independent analysis and disciplined risk management.
Swingtrader

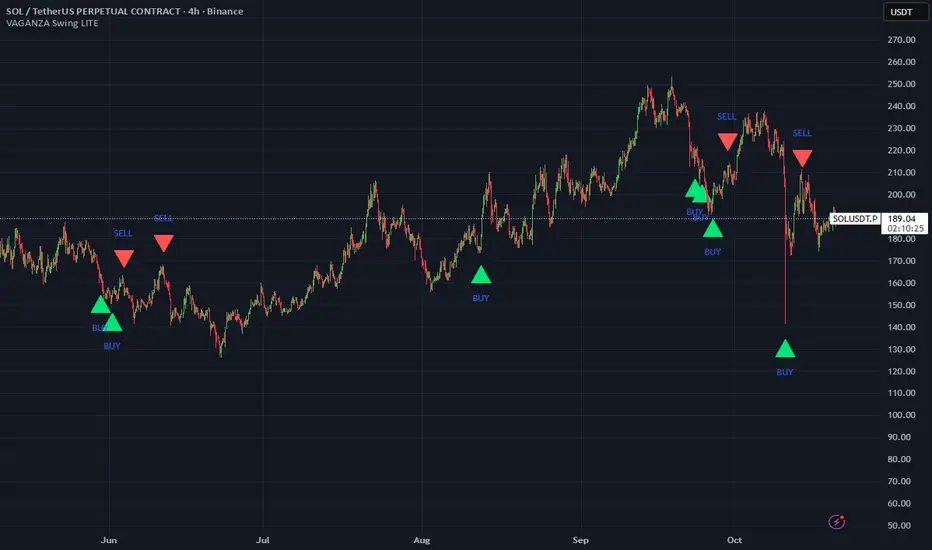
VAGANZA Swings V1 LITE1. Introduction: The Philosophy Behind VAGANZA Swings
The VAGANZA Swings V1 LITE was developed to solve a common problem faced by swing traders: getting caught in low-probability trades during choppy, sideways markets. Many indicators can identify a trend, but few can effectively measure its quality and pinpoint optimal, low-risk entry points within that trend.
This script is not merely a "mashup" of existing indicators. It is a structured, multi-layered filtering system where each component is specifically chosen to address the weaknesses of the others. The core philosophy is to trade only when there is a clear market consensus, confirmed by trend, strength, momentum, and volume. This results in fewer signals, but each signal is designed to be of significantly higher quality.
2. The VAGANZA Confirmation Engine: A Deeper Look at the Logic
A signal is only generated when four distinct market conditions align. This sequential confirmation process is what makes the script unique and robust.
Layer 1: The Trend Regime Filter
What it does: The indicator first establishes the dominant market bias using a dual-speed baseline system. A faster-reacting baseline is compared against a slower, more stable baseline to determine if the market is in a long-term bullish or bearish "regime."
Why it's important: This foundational step ensures we are never fighting the primary market current. BUY signals are disabled during a bearish regime, and SELL signals are disabled during a bullish regime, instantly eliminating 50% of potentially bad trades.
Layer 2: The Trend Strength & Conviction Qualifier
What it does: This is the script's core intelligence. After confirming the trend's direction, this layer uses a directional volatility engine to measure the trend's strength or conviction. It analyzes the expansion between bullish and bearish price movements.
Why it's important: A simple moving average crossover can occur in a weak, drifting market, leading to false signals. This filter requires the trend to be demonstrably powerful (above a predefined strength threshold of 25) before allowing the system to even look for an entry. It's the primary filter for avoiding sideways market traps.
Layer 3: The Dynamic Pullback & Entry Trigger
What it does: Instead of chasing price at its peak, the script waits for a natural "breather" or pullback. It employs a momentum cycle oscillator to identify when the price has become temporarily oversold within a strong uptrend, or overbought within a strong downtrend. The signal is triggered at the precise moment momentum appears to be rejoining the primary trend.
Why it's important: This ensures a more favorable risk-to-reward ratio. By entering on a pullback, traders can avoid buying the top or selling the bottom of a short-term swing, which is a common mistake.
Layer 4: The Volume Participation Check
What it does: As a final confirmation, the script checks the volume on the signal candle. It requires the volume to be higher than its recent average.
Why it's important: A price move without significant volume can be a trap. This final check confirms that there is genuine market participation and conviction behind the signal, suggesting that larger market players are supporting the move.
3. The Synergy of the System (Why This Combination is Original)
The originality of VAGANZA Swings lies not in its individual components, but in their synergistic interaction:
The Trend Regime Filter sets the stage.
The Trend Strength Qualifier prevents signals when the stage is poorly lit (i.e., a weak trend).
The Pullback & Entry Trigger tells the actor exactly when to enter the stage for maximum impact.
The Volume Check ensures the audience is actually watching.
Without the strength filter, the trend filter would fail in ranging markets. Without the pullback trigger, entries would have poor risk-reward. This interdependent, sequential logic provides a unique and useful tool that goes beyond what a single indicator can offer.
4. How to Use This Script
Timeframe: Optimized for the 4-Hour (H4) chart, as this provides a balance between meaningful swings and actionable signals. It can also be used on the Daily (D1) chart for longer-term analysis.
BUY Signal (Green "BUY" Arrow): Appears only when a strong, confirmed uptrend experiences a temporary, oversold pullback and volume confirms renewed buying interest. This is a high-probability signal to consider a long position.
SELL Signal (Red "SELL" Arrow): Appears only when a strong, confirmed downtrend experiences a temporary, overbought rally and volume confirms renewed selling pressure. This is a high-probability signal to consider a short position.
Risk Management: This indicator provides entry signals only. It is crucial that you apply your own risk management rules. Always use a stop-loss and have a clear take-profit strategy for every trade.
Disclaimer: This tool is for decision-support and does not constitute financial advice. All trading involves risk. Past performance is not indicative of future results. Please backtest thoroughly before using this script with real capital.
Swing H1 + M15 ComboThis indicator only use to H1 & M15 timeframe
✅ Entry Guidelines
Identify the Trend (H1 Swing Call)
A confirmed Swing Buy on H1 sets the trend to bullish.
A confirmed Swing Sell on H1 sets the trend to bearish.
The trend only changes when a new confirmed swing signal closes on H1.
Confirm with M15
On M15, wait for a buy signal if the H1 trend is bullish.
On M15, wait for a sell signal if the H1 trend is bearish.
✅ How It Works
H1 Swing Calls define the overall trend direction (bullish or bearish).
M15 CE Signals confirm short-term entries in line with the H1 trend.
A trade setup is only valid when both timeframes agree.
📈 Entry Strategy
Buy Setup:
H1 confirms a Swing Buy trend
M15 prints a CE Buy signal
Stop loss: below nearest swing low / structure
Sell Setup:
H1 confirms a Swing Sell trend
M15 prints a CE Sell signal
Stop loss: above nearest swing high / structure
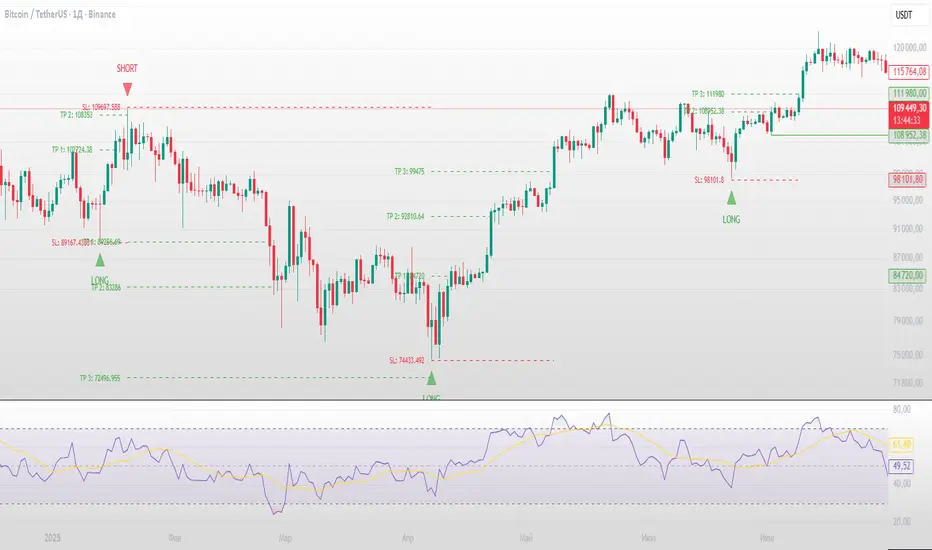
Swing Failure Pattern SuvorovIndicator: Logic-based Swing Failure Pattern (SFP)
What is the logic of my indicator based on and what makes it unique:
1. The indicator can calculate extreme candles that close with huge shadows and a small body and it works on any timeframe.
2. The indicator analyzes the volumes on which the desired bar was closed. This function is customizable. That is, you can build a search for signals according to your trading strategy, based on the number of volumes. What does this mean - you select the number of previous bars where the indicator calculates the average value and based on these numbers, you can set up: how many times the desired candle should be larger than the previous average volume.
3. Since SFP is based on the removal of important liquidity, the search for such situations occurs from swing structures (swing high/low). When these parameters are found on the chart (on history), the indicator draws the situation and shows where important liquidity was removed and why the trading situation appeared right now.
4. The indicator gives recommendations on possible takes and stops.
The structure of takes has a built-in logic for searching for previous swings to remove liquidity, as well as searching for imbalances to cover them (50 and 100%).
5. For TP (Take Profit): there are 3 TPthat can be adjusted to your trading strategy (Risk/Profit). For example: you always trade from 2 to 1 on the 1st Take, 3 to 1 on the second, 5 to 1 on the third: you can set all this in the indicator and all your targets will be detected by the indicator, taking into account the logic of searching for important ranges. If, for example, in your 3 to 1 range there are no important zones for TP, then the indicator writes that NaN (not found).
6. The indicator works on any timeframe.
7. The indicator has a built-in RSI logic, which comes as an additional function to the indicator. If this function is enabled, then trading situations are detected only when there is a divergence (from the swing point to the extreme bar that has formed).
AI Trading Alerts v6 — SL/TP + Confidence + Panel (Fixed)Overview
This Pine Script is designed to identify high-probability trading opportunities in Forex, commodities, and crypto markets. It combines EMA trend filters, RSI, and Stochastic RSI, with automatic stop-loss (SL) & take-profit (TP) suggestions, and provides a confidence panel to quickly assess the trade setup strength.
It also includes TradingView alert conditions so you can set up notifications for Long/Short setups and EMA crosses.
⚙️ Features
EMA Trend Filter
Uses EMA 50, 100, 200 for trend confirmation.
Bull trend = EMA50 > EMA100 > EMA200
Bear trend = EMA50 < EMA100 < EMA200
RSI Filter
Bullish trades require RSI > 50
Bearish trades require RSI < 50
Stochastic RSI Filter
Prevents entries during overbought/oversold extremes.
Bullish entry only if %K and %D < 80
Bearish entry only if %K and %D > 20
EMA Proximity Check
Price must be near EMA50 (within ATR × adjustable multiplier).
Signals
Continuation Signals:
Long if all bullish conditions align.
Short if all bearish conditions align.
Cross Events:
Long Cross when price crosses above EMA50 in bull trend.
Short Cross when price crosses below EMA50 in bear trend.
Automatic SL/TP Suggestions
SL size adjusts depending on asset:
Gold/Silver (XAU/XAG): 5 pts
Bitcoin/Ethereum: 100 pts
FX pairs (default): 20 pts
TP = SL × Risk:Reward ratio (default 1:2).
Confidence Score (0–4)
Based on conditions met (trend, RSI, Stoch, EMA proximity).
Labels:
Strongest (4/4)
Strong (3/4)
Medium (2/4)
Low (1/4)
Visual Panel on Chart
Shows ✅/❌ for each condition (trend, RSI, Stoch, EMA proximity, signal now).
Confidence row with color-coded strength.
Alerts
Long Setup
Short Setup
Long Cross
Short Cross
🖥️ How to Use
1. Add the Script
Open TradingView → Pine Editor.
Paste the full script.
Click Add to chart.
Save as "AI Trading Alerts v6 — SL/TP + Confidence + Panel".
2. Configure Inputs
EMA Lengths: Default 50/100/200 (works well for swing trading).
RSI Length: 14 (standard).
Stochastic Length/K/D: Default 14/3/3.
Risk:Reward Ratio: Default 2.0 (can change to 1.5, 3.0, etc.).
EMA Proximity Threshold: Default 0.20 × ATR (adjust to be stricter/looser).
3. Read the Panel
Top-right of chart, you’ll see ✅ or ❌ for:
Trend → Are EMAs aligned?
RSI → Above 50 (bull) or below 50 (bear)?
Stoch OK → Not extreme?
Near EMA50 → Close enough to EMA50?
Above/Below OK → Price position vs. EMA50 matches trend?
Signal Now → Entry triggered?
Confidence row:
🟢 Green = Strongest
🟩 Light green = Strong
🟧 Orange = Medium
🟨 Yellow = Low
⬜ Gray = None
4. Alerts Setup
Go to TradingView Alerts (⏰ icon).
Choose the script under “Condition”.
Select alert type:
Long Setup
Short Setup
Long Cross
Short Cross
Set notification method (popup, sound, email, mobile).
Click Create.
Now TradingView will notify you automatically when signals appear.
5. Example Workflow
Wait for Confidence = Strong/Strongest.
Check if market session supports volatility (e.g., XAU in London/NY).
Review SL/TP suggestions:
Long → Entry: current price, SL: close - risk_pts, TP: close + risk_pts × RR.
Short → Entry: current price, SL: close + risk_pts, TP: close - risk_pts × RR.
Adjust based on your own price action analysis.
📊 Best Practices
Use on H1 + D1 combo → align higher timeframe bias with intraday entries.
Risk only 1–2% of account per trade (position sizing required).
Filter with market sessions (Asia, Europe, US).
Strongest signals work best with trending pairs (e.g., XAUUSD, USDJPY, BTCUSD).

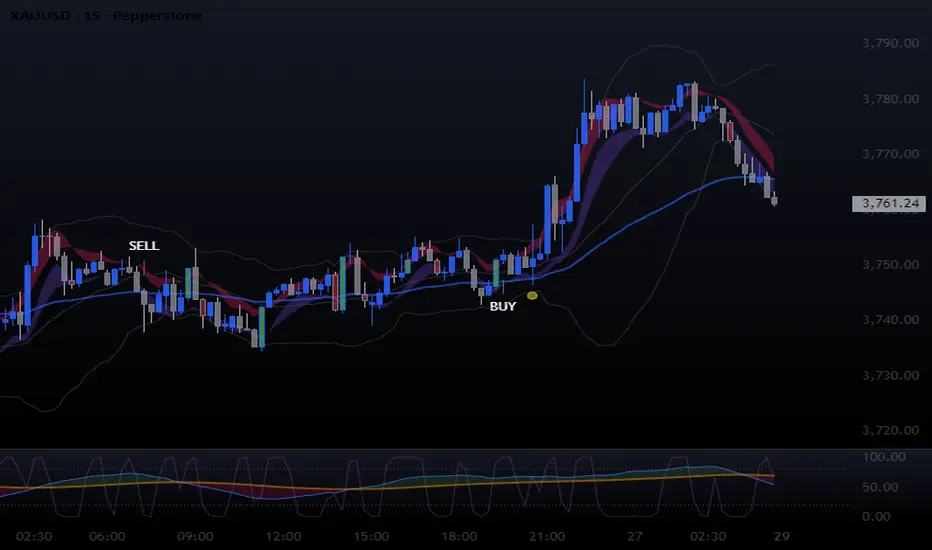
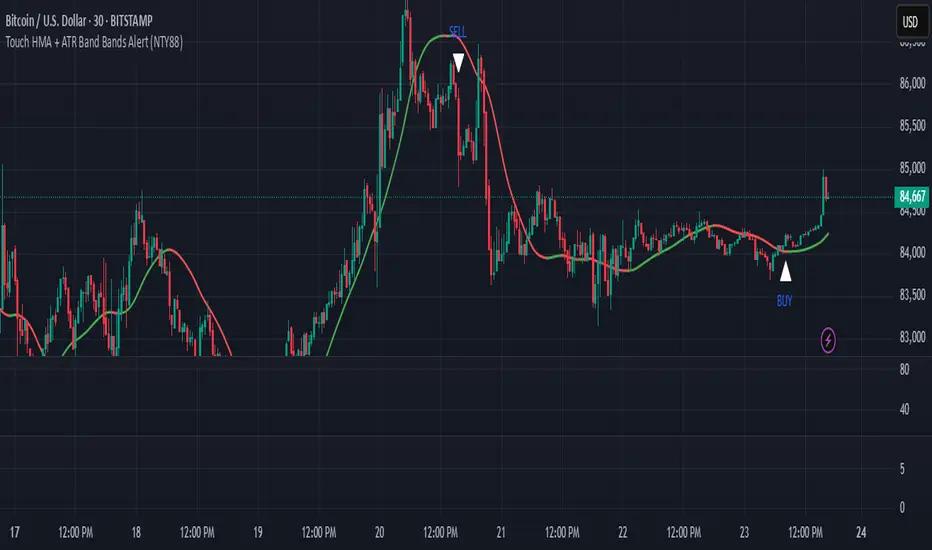
Touch HMA + ATR Band Bands Alert (NTY88)🔔 Precision Alerts | No Repainting | ATR-Based Touch Detection | HMA Trend Coloring
This script is a clean and powerful tool designed to help you catch precise market reversals using ATR Band touches combined with trend-following logic.
📌 How It Works
A custom Hull Moving Average (HMA) is used to track the trend.
Two dynamic ATR-based bands are drawn above and below the HMA.
A signal is generated when the closing price touches the upper or lower ATR band within a small tolerance zone.
✅ Key Features
🔁 Alternating Signals: Only one Buy → then one Sell → then Buy again. No signal spam.
🟢🔴 Color-Changing HMA Line: Green = HMA rising | Red = HMA falling
📏 Price Tolerance Input: Define how close the candle must be to the ATR band to trigger a signal.
🔔 Real-Time Alerts: Easily set alerts for Buy and Sell signals — works in live markets.
🚫 No Repainting: All signals are confirmed at candle close and will not change afterward.
🎯 When to Use
Great for trend reversals, scalping zones, or identifying potential exhaustion points.
Works well on any timeframe or market (crypto, stocks, forex).
💬 Pro Tip:
Combine this with RSI, Volume, or ADX filters to build a complete confluence system.
📈 Built for traders who love clean logic, precision entries, and visual clarity.
Smallest Swing [Truth Indie]This indicator is designed to test the smallest swing draw using the swing capture concept of the Pivot Points High Low indicator, setting the length to 1 for all periods, and combining it with price action that I think makes sense.
Example of a valid swing high.
Example of a valid swing low.

Intraday 5 Day Moving Average for Swing TraderThis indicator helps swing trader to quickly see if a stock or an index is in a short term up- or downtrend.
The 5 Day Moving Average line is shown on all intraday timeframes like 5, 10, 15, 30, 60, 65 and so on.
When an index like SPY or QQQ shows a green 5 DMA line, the index is in a short term uptrend and you can buy stocks for a swing trade,
when the line turns red be careful and stop buying stocks, instead watch out to short stocks.
In addition to the 5 DMA line you can show the percent distance to the 5 DMA and have multiple options to customize the indicator.
Features
■ Use SMA or EMA for the 5 DMA
■ Use different intraday timeframes or show on daily
■ Show the distance in percent
■ Different color modes
■ Multiple customize options

StockBee 4% BreakoutThe Stockbee 4% Breakout script is a study tool for users who wants to do a deep dive on StockBee's 4% Breakout momentum burst method. This script will assist a specific group of traders who trade this method easily find historical momentum bursts. This script finds and colors red any candle body that meets the following criteria:
1. Volume of the candle is greater than the previous candle volume.
2. The percent change of candle's price is greater than 4% from the previous candle close.
3. Current candle close is less than 30% from candle's high.
This script also filters out any candle that gaps up and breaks down with a close above 4% the previous candle (Eliminates gap-ups that fade). This tool is meant to find and filter possible candidates. Not every marked candle is a great momentum burst trade.
This is very helpful for Trading View users trading this specific setup.

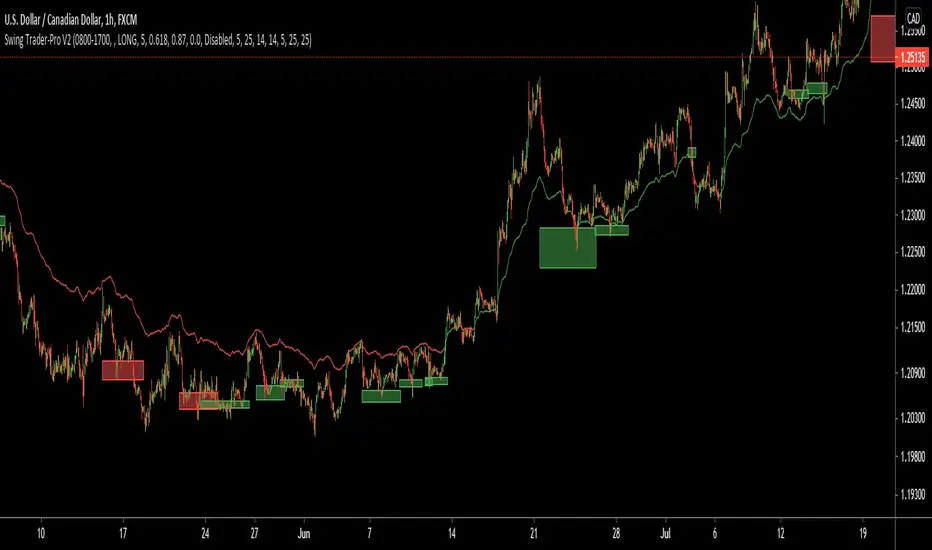
Swing Trader-Pro V2The strategy- what is it?
This indicator is designed from a theory created by myself in order to distinguish a correction from an impulse. This comes down to the ability to compare "x" range of candles to "y" range of candles and highlight key differences to then correctly portray that the most recent move in price will be (or is) a correction.
Following this theory, we all understand that corrections don't go with the trend right? So this means at some point, there is a high probability of a rejection somewhere in this most recent move, that will ultimately push price higher or lower as it continues back with the trend. Therefore, through extensive quantitative research and back-testing, we are able to highlight areas of high-probability rejections within these supposed corrections.
How does it work?
Firstly, we need to establish a high and low point (using pivots ) that help us decide what the state is of the recent move between the high and low (we call this "point A" and "point B"). So we can only consider whether the recent move in price was an impulse or a correction until the move from "point B" to "point C" is made. But before that, once we have identified "Point A" and "point B", we use 2 (supposedly) strong levels which help integrate a box onscreen and thus, indicate this area of high liquidity. This box will continue to adjust according to the change of pivots (if price keeps creating HH's & HL's or LH's & LL's depending on market trend). But if we establish a strong high and low and price stays within this range, then the box will remain in place.
The default color of the box is red; the only time the color of the box will change is when:
- Price retraces from the high/low back to the box (price has to touch the box)
AND
-If any of our confirmations indicate a successful correction based on our theory.
So the box color varies:
- Red = very weak (or) no entry = no confirmations were made
- Yellow = weak entry = some but not all confirmations were made
- Green = strong entry = all confirmations have indicated that the move from "point B" to "point C" (remember that "point C" is where the box is) is a correction when compared with the move from "point A" to "point B"
These confirmations are all validated on the same candle during live candle activity (not when the candle has closed on the box). As this happens, the confirmations will determine the state of entry quality as soon as price touches the box.
In this time, we will see a new orange label highlighting what indicators have confirmed a successful correction and what haven't.
The label shows the different confirmation indicators in which we have provided different names (as this is the secret we intend to keep). So we have:
- "CC"
- "B1/B2"
- "B3"
Usually, we will see either an "OK" or "NOT OK" next to each confirmation indicator. This just tells us whether they have confirmed or not. Please note that this "point C" label does not stay permanently, regardless of the state of entry quality. The label will in fact stay on the screen until the next box has been generated, which is usually a few candles after the entry has been triggered.
Entries, SL's and TP's
This indicator shows the user an area of high-probability rejection. So in terms of specifying a precise entry, you're completely free to enter on the following:
- the moment price touches the box (depending on what color it is of course)
- the other end of the box (if you would like to catch a "sniper entry")
- or if price pierces the entire box and is still green, you can wait to see if price comes back through the box (which indicates a false breakout).
As for Stop-losses, i would recommend:
- Long entries: set your SL at the recent low (this should be "point A")
- Short entries: set your SL to the recent high (this should be "point A" as well, because if you're switching from the "long entry" setting to the "short entry" setting, the indicator labels flip around and are the opposite of what they are for long entries).
For Take profits, this is entirely up to the user. Because some entries will allow you to have great RR ratios depending on how you manage the active trades. Some recommendations below:
- Set TP to "point B" pivot
- Use trailing stop function or something similar if available
- Add other indicators such as the RSI and close when price reaches key levels
- When price shows signs of exhaustion or early stages of reversal then just close
Additional information and recommendations
- This works on any time frame and on any financial market, whether you prefer Forex, stocks, crypto, commodities , etc.
- In regards to trade direction, you can change in the settings to look for either long or short positions in the market. I would recommend using it in favor of the overall trend of the markets because you will find a lot better entries. Although, this does work against the trend at times as well. Additionally, this tool also works in consolidating markets which is beneficial.
- After becoming used to the script, i would say to apply it twice to your screen and have one looking for Long entries and the other looking for Short entries.
- As the user, you have the ability to remove the labels in the parameter settings (because it does look quite messy onscreen, especially if you have both long and short entries on at the same time). I would only personally show the labels when price hits the current box to see what confirmations have been identified.
- I will also provide the best parameters to use. You will only need one set of parameters for each long and short setting, as these parameters are universal for any time frame and any financial market.
FIRST UPDATE
After extensive back testing using our first version, we found that in fact, there are some great opportunities being wasted as the entry box stays red. This is due to some series of market structure that don't always fit our theory of continuations within the market. We found that although our theory is accurate, the amount of times the market fits this is more rare than times when price follows sequences. When we look for sequences in the market instead of specifying differences between impulses and corrections, we actually see areas of serious repetitiveness, thanks to how our indicator initially generates. Not how it confirms. So, understanding this new theory through one component of our previous indicator, we are still able to keep boxes at the same area yet accurately confirm more profitable entries external to our full previous strategy.
Moving towards the practical side of things:
-Make sure "add extra confirmation" parameter is selected, as this will allow the indicator to search for more valid entries rather than just our normal confirmations. (this is a tick box).
- Default parameters are already set for both C1 and C2
In a simple sense, this update is added to find more confirmations to turn more red boxes into green boxes based on other theories outside of our original one. How we do this exactly is part of the mystery.
SECOND UPDATE
- Fibonacci based moving average: using elements of the Fibonacci sequence and its relevance to being a hot-spot in price activity, we have integrated this into a moving average which is stronger than your usual MA. Here, you will notice it showing stronger signs of rejecting price, especially when trending. Hence, this is extremely useful to implement into your strategy as part of the trend identification. When price is consolidating, depending on how volatile or close-in the waves are during these periods, the FMA is similar to your typical MA, so therefore not so good. But the overall intention of this is to enhance your conclusion to whether price is trending and whether price is bullish or bearish.
- This is now a strategy, not just an indicator: So now we can choose from a huge variety of parameters in accordance to what ones work best with what pair, or time frame. The typical parameters to change would be the entry points, stop losses and take profits. We have also added in a "SL to entry" option. ALL PARAMETERS ARE FIBONACCI LEVELS AS THIS MAKES IT UNIVERSAL TO ANY PAIR/ TIME FRAME.
- Move the entry boxes : So this is very useful for certain pairs and mainly to help the user understand key sequences on a quantitative level. Sometimes we can notice that pairs spike higher than the typical entry (0.618) so we have allowed flexibility to the point where you can alter the box appearance to either the 0.618 level (default), 0.786 and the 0.9 level.
- Back-testing: Now the user can back-test the strategy and see the performance within any financial market you add this to! Please note that according to the strategy, once a trade is placed, it wont enter any more trades when the current one is still active. I have requested to change this, but it is out of our development team's reach. However, this doesn't discredit what the system can help you achieve, as you will still be able to find profitable parameters within the financial markets.
Strategy default properties
Backtest start: this date is when you would like to start the backtest, however, the indicator will go as far as the data can be read
Backtest end: choose your date to end the back test.
Trade session: choose the trading session you want this strategy to work on.
Filter by session: you can filter the backtested results depending on whether you want the strategy to take trades within the chosen trading session.
Filter by Fibonacci moving average: select this if you would like for the back tested results to consider whether the valid trade setups are in accordance to what the FMA displays (Bullish or Bearish). This is deselected.
Fibonacci Moving Average Timeframe: here you can select what timeframe you would like the FMA to work on, default is the “same as chart” button/ option.
TraderDirection: choose whether you would like LONG or SHORT entries for the indicator to find.
Max risk per trade: choose the risk setting per trade, i would suggest lowering this to 1% ((MODERATOR) This is the default setting!)
EntryFib: choose between the options as to where you would like the strategy to enter positions, the default is the 0.618 zone which is the closest side of the box to price. You will also see that when you choose to change this, the boxes on your screen will move accordingly. A very helpful function!
StopFib: choose your Stop Loss based on the same Fibonacci level as what you choose for your entry, remember that the higher the fib level, the higher (or safer) your Stop Loss is from price spiking. It all comes down to preference.
TakeProfitFib: choose your Take Profit based on the same Fibonacci level as what you choose for your entry, remember that the lower the fib level, the higher your Take Profit is again, It all comes down to preference.
BreakevenFib: the default setting is on “disabled” however when you select a certain Fibonacci level, once price reaches there during the active trade, your Stop Loss will be set to entry, this function is designed to stop volatile price fluctuations rendering your in-profit trade result to hitting your Stop Loss and losing when it closes out.
[blackcat] L2 Swing Oscillator Swing MeterLevel: 2
Background
Swing trading is a type of trading aimed at making short to medium term profits from a trading pair over a period of a few days to several weeks. Swing traders mainly use technical analysis to look for trading opportunities. In addition to analyzing price trends and patterns, these traders can also use fundamental analysis.
Function
L2 Swing Oscillator Swing Meter is an oscillator based on breakouts. Another important feature of it is the swing meter, which confirms the top or bottom's confidence level with different color candles. The higher of the candles stack up, the higher confidence level is indicated.
Key Signal
absolutebot ---> absolute bottom with very high confidence level
ltbot ---> long term bottom with high confidence level
mtbot ---> middle term bottom with moderate confidence level
stbot ---> short term bottom with low confidence level
absolutetop ---> absolute top with very high confidence level
lttop ---> long term top with high confidence level
mttop ---> middle term top with moderate confidence level
sttop ---> short term top with low confidence level
fastline ---> oscillator fast line
slowline ---> oscillator slow line
Pros and Cons
Pros:
1. reconfigurable swing oscillator based on breakouts
2. swing meter can confirm/validate the bottom and top signal
Cons:
1. not appliable with trading pairs without volume information
2. small time frame may not trigger swing meter function
Remarks
This is a simple but very comprehensive technical indicator
Readme
In real life, I am a prolific inventor. I have successfully applied for more than 60 international and regional patents in the past 12 years. But in the past two years or so, I have tried to transfer my creativity to the development of trading strategies. Tradingview is the ideal platform for me. I am selecting and contributing some of the hundreds of scripts to publish in Tradingview community. Welcome everyone to interact with me to discuss these interesting pine scripts.
The scripts posted are categorized into 5 levels according to my efforts or manhours put into these works.
Level 1 : interesting script snippets or distinctive improvement from classic indicators or strategy. Level 1 scripts can usually appear in more complex indicators as a function module or element.
Level 2 : composite indicator/strategy. By selecting or combining several independent or dependent functions or sub indicators in proper way, the composite script exhibits a resonance phenomenon which can filter out noise or fake trading signal to enhance trading confidence level.
Level 3 : comprehensive indicator/strategy. They are simple trading systems based on my strategies. They are commonly containing several or all of entry signal, close signal, stop loss, take profit, re-entry, risk management, and position sizing techniques. Even some interesting fundamental and mass psychological aspects are incorporated.
Level 4 : script snippets or functions that do not disclose source code. Interesting element that can reveal market laws and work as raw material for indicators and strategies. If you find Level 1~2 scripts are helpful, Level 4 is a private version that took me far more efforts to develop.
Level 5 : indicator/strategy that do not disclose source code. private version of Level 3 script with my accumulated script processing skills or a large number of custom functions. I had a private function library built in past two years. Level 5 scripts use many of them to achieve private trading strategy.

[blackcat] L1 Whale Jumping out of the OceanLevel: 1
Background
One of the biggest differences between cryptocurrency and traditional financial markets is that cryptocurrency is based on blockchain technology. Individual investors can discover the direction of the flow of large funds through on-chain transfers. These large funds are often referred to as Whale. Whale can have a significant impact on the price movements of cryptocurrencies, especially Bitcoin . Therefore, how to monitor Whale trends is of great significance both in terms of fundamentals and technical aspects.
We often see whales suddenly jump out of the ocean and then set off huge waves. What we need to do is to surf the wave according to the trend after the whale jumps out of the sea. This is really an exciting sport!
Function
By modeling the behavior of Whale and individuals (Surfers), L1 Whale Jumping out of the Ocean can not only simply describe the behavior trends of Whale and individuals, but also describe the shape of waves generated by the whale jump. Individual traders need to follow the wave trend to take profit.
NOTE: white line and yellow candles represent whale appears but it CANNOT indicate the direction as PUMP or DUMP. This indicator is one of the whale series. It is featured by vividness. A technical indicator is drawn as ocean (momentum in blue and aqua), whale (whale PUMP/DUMP in white,yellow, red, fuchsia and green), huge wave (mid-term trend or swing trend in aqua and blue).However, it does not accurately generate buying and selling points.
Key Signal
var01 --> huge wave caused by whale jump. it is used to confirm whale jump and describe the trend of wave for surfers.
var02 --> whale move signal
var12 --> whale move signal
var28 --> high confidence level of huge whale move
dynabot --> deep ocean (dynamic bottom)
Pros and Cons
Pros:
1. Detect Whale pump and dump and the strength of huge wave.
2. Vividly compare the market movement to a huge wave caused by a whale jumping out of the sea.
3. When it resonante with buy or sell signal from other independent indicators, it has higher confidence level.
Cons:
1. No exact long and short entries.
2. It is sensitive and may have noise inside and generate fake entry signal.
Remarks
Please do not think that this is just a technical indicator, this is a documentary about whales.
Readme
In real life, I am a prolific inventor. I have successfully applied for more than 60 international and regional patents in the past 12 years. But in the past two years or so, I have tried to transfer my creativity to the development of trading strategies. Tradingview is the ideal platform for me. I am selecting and contributing some of the hundreds of scripts to publish in Tradingview community. Welcome everyone to interact with me to discuss these interesting pine scripts.
The scripts posted are categorized into 5 levels according to my efforts or manhours put into these works.
Level 1 : interesting script snippets or distinctive improvement from classic indicators or strategy. Level 1 scripts can usually appear in more complex indicators as a function module or element.
Level 2 : composite indicator/strategy. By selecting or combining several independent or dependent functions or sub indicators in proper way, the composite script exhibits a resonance phenomenon which can filter out noise or fake trading signal to enhance trading confidence level.
Level 3 : comprehensive indicator/strategy. They are simple trading systems based on my strategies. They are commonly containing several or all of entry signal, close signal, stop loss, take profit, re-entry, risk management, and position sizing techniques. Even some interesting fundamental and mass psychological aspects are incorporated.
Level 4 : script snippets or functions that do not disclose source code. Interesting element that can reveal market laws and work as raw material for indicators and strategies. If you find Level 1~2 scripts are helpful, Level 4 is a private version that took me far more efforts to develop.
Level 5 : indicator/strategy that do not disclose source code. private version of Level 3 script with my accumulated script processing skills or a large number of custom functions. I had a private function library built in past two years. Level 5 scripts use many of them to achieve private trading strategy.

RocketScalper+ Long/Short IndicatorNOTE: To use together with RocketScalper Long/Short Indicator
About the Rocketscalper+ Indicator
Derives from the RocketScalper Long/Short indicator, was worked on by PM
Used by 180+ users as of today
Was first published on Sept 10, 2019
It had 1 iteration so far.
Will be updated as needed so it keeps giving good outputs (so far no update needed).
While the RocketScalper works by merging 3 oscillators and then checking the market balance between sells and buys to give you the final output, the RocketScalper+ uses MA Crossings and adds another layer to filter than final output. It IS NOT an upgrade, use both.
Main notes about the RocketScalper+:
Wavetrend ignored
Took weight off of Godmode for the final output
Added weight to Price Oscillator for the final output
Added TakeProfit and StopLoss conditions editable for users
Turned the scalper more neutral with a slight long bias for the upcoming trend
Has several outputs on the chart that you can activate/deactivate
Long / Short Signals
Self Explanatory / It suggests you should long or short the asset.
Show Price Oscillator signals
It'll output long/short signals based on the Price Oscillator.
Show Stop/Support/Resistance warning
Not working as of now, will need to update it soon.
No Text inputs on this indicator.
Should I use it on all timeframes and all pairs?
Yes, works very well with HTF and for all pairs. As you can see above on BTCUSDT (as an example), on the 6h use it as a confirmation to get in a trade, specially if you also use the TMA.
For access, please DM us or visit the link below in our Signature.

SWING DELTAThis will show the price change between the high/low of each candlestick as an oscillator with configurable options to show Long/Short or both.

Stock Analysis SoftwareStock Analysis Software is a full trading setup and style that is meant for swing trading stocks, but can also be used for Forex, cryptocurrencies, indices and commodities. Whatever your choice of trading style (Intraday, Scalping, Swing trading, Investing) or trading instrument is (FX, Futures, Cryptos, Stocks) I can tailor it for you specifically. For example if you want to use it for trading Forex intraday I will show you how to use it for that.
The software consists of 11 indicators, 7 are custom and 4 are common and well known indicators available on Tradingview. The system itself is part software and part learning my specific pattern finding techniques. There is no one without the other. This is a complete system
This trading system is something I have developed over the last 10 years through extensive research and development and is now available on this platform.
The indicators used are mostly screening for trend breakouts, support and resistance, specific candle patterns, overextended, volume spikes and more.
This is a system that can be taught easily if one is motivated to learn.
The setup includes a video guide and a live one-on-one full breakdown on how to use it to your benefit.

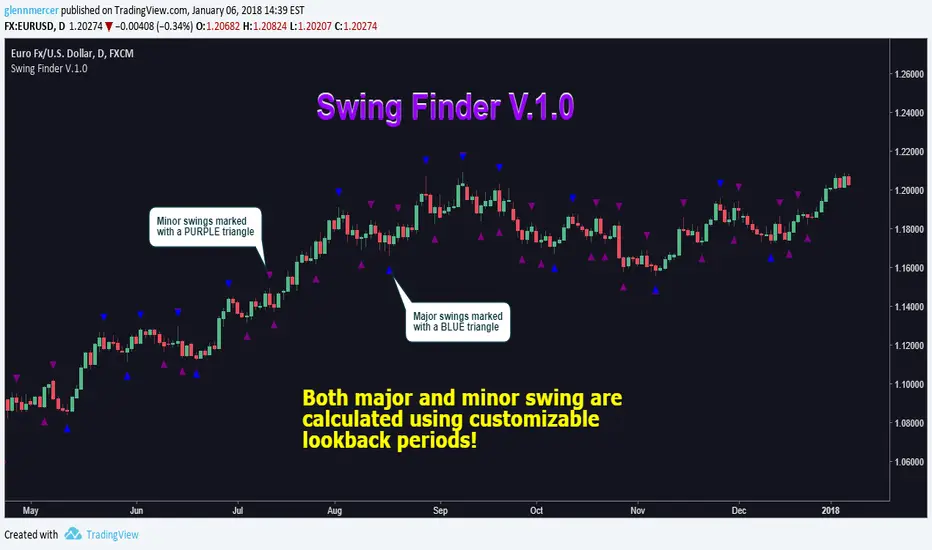
Swing Finder V.1.0Swing Finder V.1.0
Find major and minor swings
Customizable lookback periods
Great for drawing Fibonacci levels
Filter out minor retracements determined by your own parameters!!
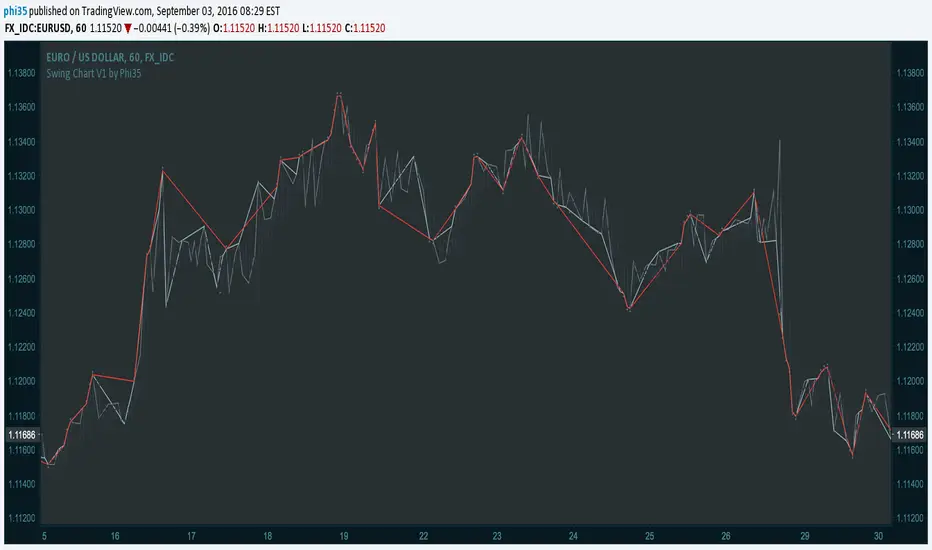
Swing Chart V1 by Phi35 © With this indicator, which plots the swing chart of the 3 degrees, swing traders can automate their work of tracking the right bars.
How it works:
Minor Degree (one bar) (gray)= If the current high is higher than the previous high or the current low is lower than the previous low.
Intermediate Degree (two bar) (baby blue)= If the current high is higher than previous and the penultimate high etc.
Main Degree (three bar) (red)= If the current high is higher than the previous, the penultimate and the high before penultimate high etc.
Alert:
On crossover there will be an alert (popup with a message) and in addition you will see "diamonds" on the place where the crossover took place
If there is an issue or any suggestions, feel free to contact me. Do not modify the code without permission.
Swing Chart V1 by Phi35 ©
JPY GBP ROCsRate of change of most volatile JPY and GBP pairs. All pairs ending in JPY are red except GBPJPY (colored yellow --currently most volatile 7/2016). GBPNZD is blue, the other GBP pairs are green, lime and teal. GBPJPY and GBPNZD are my favorite day trading / swing trading pairs. This script allows me to see the action of the most volatile and liquid pairs on one screen. JPY pairs (ex-GBPJPY) are all red so that I see the flow of JPY not so much each pair and its name. Global movement of JPY is what I am after. Same for the coloring of GBP pairs as green expect GBPNZD as blue. ***** EURGBP is plotted as an opposite (with a negative in front of its sma. EURGBP is extremely correlated to GBPNZD, I decided to plot it also.

MAGNUS® CyclesThis indicator will help you if you struggle making any profit in bitcoin.
It generates very few signals with very nice profit potential ( around 100% this year ! ).
Perfect tool for longterm swing traders and new traders that need help figuring out the midterm trend.
Use it with these parameters only:
weekly: 13, 5, 12
daily: 92, 21, 96
