Dynamic Support and Resistance Pivot Strategy The Dynamic Support and Resistance Pivot Strategy is a flexible and adaptive tool designed to identify short-term support and resistance levels using the concept of price pivots.
### Key Elements of the Strategy
1. Pivot points as support and resistance levels
Pivots are significant turning points on the price chart, often marking local highs and lows where the price has reversed direction. A pivot high occurs when the price forms a local peak, while a pivot low occurs when the price forms a local trough. When a new pivot high is formed, it creates a resistance level. Conversely, when a new pivot low is formed, it creates a support level.
The strategy continuously updates these levels as new pivots are detected, ensuring they remain relevant to the current market conditions. By identifying these price levels, the strategy dynamically adjusts to market conditions, allowing it to adapt to both trending and ranging markets, since it has a long target and can perform reversal operations.
2. Entry Criteria
- Buy (Long): A long position is triggered when the price is near the support level and then crosses it from below to above. This suggests that the price has found support and may start moving upwards.
- Sell (Short): A short position is triggered when the price is near the resistance level and then crosses it from above to below. This indicates that the price may be reversing and moving downward.
3. Support/Resistance distance (%)
- This parameter establishes a percentage range around the identified support and resistance level. For example, if the Support Resistance Distance is 0.4% (default), the closing price must be within a range of 0.4% above support or below the resistance to be considered "close" and trigger a trade.
4. Exit criteria
- Take profit = 27 %
- Stop loss = 10 %
- Reversal if a new entry point is identified in the opposite direction
5. No Repainting
- The Dynamic Support and Resistance Pivot Strategy is not subject to repainting.
6. Position Sizing by Equity and risk management
- This strategy has a default configuration to operate with 35% of the equity. The stop loss is set to 10% from the entry price. This way, the strategy is putting at risk about 10% of 35% of equity, that is, around 3.5% of equity for each trade. The percentage of equity and stop loss can be adjusted by the user according to their risk management.
7. Backtest results
- This strategy was subjected to backtest and operations in replay mode on **1000000MOGUSDT.P**, with the inclusion of transaction fees at 0.12% and slipagge of 5 ticks, and the past results have shown consistent profitability. Past results are no guarantee of future results. The strategy's backtest results may even be due to overfitting with past data.
8. Chart Visualization
- Support and resistance levels are displayed as green (support) and red (resistance) lines.
- Pivot prices are displayed as green (pivot low) and red (pivot high) labels.
In this image above, the Support/Resistance distance (%) parameter was set to 0.8.
9. Default Configuration
Chart Timeframe: 1h
Pivot Lengh: 2
Support/Resistance distance (%): 0.4*
Stop Loss: 10 %
Take Profit: 27 %
* This parameter can alternatively be set to 0.8.
10. Alternative Configuration
Chart Timeframe: 20 min
Pivot Lengh: 4
Support/Resistance distance (%): 0.1
Stop Loss: 10 %
Take Profit: 25 %
BYBIT:1000000MOGUSDT.P
서포트 앤 리지스턴스

Breaks and Retests - Free990Strategy Description: "Breaks and Retests - Free990"
The "Breaks and Retests - Free990" strategy is based on identifying breakout and retest opportunities for potential entries in both long and short trades. The idea is to detect price breakouts above resistance levels or below support levels, and subsequently identify retests that confirm the breakout levels. The strategy offers an automated approach to enter trades after a breakout followed by a retest, which serves as a confirmation of trend continuation.
Key Components:
Support and Resistance Detection:
The strategy calculates pivot levels based on historical price movements to define support and resistance areas. A lookback range is used to determine these key levels.
Breakouts and Retests:
The system identifies when a breakout occurs above a resistance level or below a support level.
It then waits for a retest of the previously broken level as confirmation, which is often a better entry opportunity.
Trade Direction Selection:
Users can choose between "Long Only," "Short Only," or "Both" directions for trading based on their market view.
Stop Loss and Trailing Stop:
An initial stop loss is placed at a defined percentage away from the entry.
The trailing stop loss is activated after the position gains a specified percentage in profit.
Long Entry:
A long entry is triggered if the price breaks above a resistance level and subsequently retests that level successfully.
The entry condition checks if the breakout was confirmed and if a retest was valid.
The long entry is only executed if the user-selected direction is either "Long Only" or "Both."
Short Entry:
A short entry is triggered if the price breaks below a support level and subsequently retests that level.
The short entry is only executed if the user-selected direction is either "Short Only" or "Both."
sell_condition checks whether the support has been broken and whether the retest condition is valid.
An initial stop loss is placed when the trade is opened to limit the risk if the trade moves against the position.
The stop loss is calculated based on a user-defined percentage (stop_loss_percent) of the entry price.
pinescript
Copy code
stop_loss_price := strategy.position_avg_price * (1 - stop_loss_percent / 100)
For long positions, the stop loss is placed below the entry price.
For short positions, the stop loss is placed above the entry price.
Trailing Stop:
When a position achieves a certain profit threshold (profit_threshold_percent), the trailing stop mechanism is activated.
For long positions, the trailing stop follows the highest price reached, ensuring that some profit is locked in if the price reverses.
For short positions, the trailing stop follows the lowest price reached.
Code Logic for Trailing Stop:
Exit Execution:
The strategy exits the position when the price hits the calculated stop loss level.
This includes both the initial stop loss and the trailing stop that adjusts as the trade progresses.
Code Logic for Exit:
Summary:
Breaks and Retests - Free990 uses support and resistance levels to identify breakouts, followed by retests for confirmation.
Entry Points: Triggered when a breakout is confirmed and a retest occurs, for both long and short trades.
Exit Points:
Initial Stop Loss: Limits risk for both long and short trades.
Trailing Stop Loss: Locks in profits as the price moves in favor of the position.
This strategy aims to capture the momentum after breakouts and minimize losses through effective use of stop loss and trailing stops. It gives the flexibility of selecting trade direction and ensures trades are taken with confirmation through the retest, which helps to reduce false breakouts.
Original Code by @HoanGhetti

16. SMC Strategy with SL - low TimeframeOverview
The "SMC Strategy with SL - low Timeframe" is a comprehensive trading strategy that uses key concepts from Smart Money Theory to identify favorable areas in the market for buying or selling. This strategy takes advantage of price imbalances, support and resistance zones, and swing highs/lows to generate high-probability trade signals.
The key features of this strategy include:
Swing High/Low Analysis: Used to determine the Premium, Equilibrium, and Discount Zones.
Order Block Integration: An added layer of confluence to identify valid buy and sell signals.
Trend Direction Confirmation: Using a Simple Moving Average (SMA) to determine the overall trend.
Entry and Exit Rules: Based on price position relative to key zones and moving average, along with optional stop-loss and take-profit levels.
Detailed Description
Swing High and Swing Low Analysis
The script calculates Swing High and Swing Low based on the most recent price highs and lows over a specified look-back period (swingHighLength and swingLowLength, set to 8 by default).
It then derives the Premium, Equilibrium, and Discount Zones:
Premium Zone: Represents potential resistance, calculated based on recent swing highs.
Discount Zone: Represents potential support, calculated based on recent swing lows.
Equilibrium: The midpoint between Swing High and Swing Low, dividing the price range into Premium (above equilibrium) and Discount (below equilibrium) areas.
Zone Visualization
The strategy plots the Premium Zone (resistance) in red, the Discount Zone (support) in green, and the Equilibrium level in blue on the chart. This helps visually assess the current price relative to these important areas.
Simple Moving Average (SMA)
A 50-period Simple Moving Average (SMA) is added to help identify the trend direction.
Buy signals are valid only if the price is above the SMA, indicating an uptrend.
Sell signals are valid only if the price is below the SMA, indicating a downtrend.
Entry Rules
The script generates buy or sell signals when certain conditions are met:
A buy signal is triggered when:
Price is below the Equilibrium and within the Discount Zone.
Price is above the SMA.
The buy signal is further confirmed by the presence of an Order Block (recent lowest price area).
A sell signal is triggered when:
Price is above the Equilibrium and within the Premium Zone.
Price is below the SMA.
The sell signal is further confirmed by the presence of an Order Block (recent highest price area).
Order Block
The strategy defines Order Blocks as recent highs and lows within a look-back period (orderBlockLength set to 20 by default).
These blocks represent areas where large players (smart money) have historically been active, increasing the probability of the price reacting in these areas again.
Trade Management and Trade Direction
The user can set Trade Direction to either "Long Only," "Short Only," or "Both." This allows the strategy to adapt based on market conditions or trading preferences.
Based on the Trade Direction, the strategy either:
Closes open trades that are against new signals.
Allows only specific directional trades (either long or short).
Stop-loss levels are defined based on a fixed percentage (stop_loss_percent), which helps to manage risk and minimize losses.
Exit Rules
The strategy uses stop-loss levels for risk management.
A stop-loss price is set at a fixed percentage below the entry price for long positions or above the entry price for short positions.
When the price hits the defined stop-loss level, the trade is closed.
Liquidity Zones
The script identifies recent Swing Highs and Lows as potential liquidity zones. These are levels where price could react strongly, as they represent areas of interest for large traders.
The liquidity zones are plotted as crosses on the chart, marking areas where price may encounter significant buying or selling pressure.
Visual Feedback
The script uses visual markers (green for buy signals and red for sell signals) to indicate potential entries on the chart.
It also plots liquidity zones to help traders identify areas where stop hunts and liquidity grabs might occur.
Monthly Performance Dashboard
The script includes a performance tracking feature that displays monthly profit and loss metrics on the chart.
This dashboard allows the trader to see a visual representation of trading performance over time, providing insights into profitability and consistency.
The table shows profit or loss for each month and year, allowing the user to track the overall success of the strategy.
Key Benefits
Smart Money Concepts (SMC): This strategy incorporates SMC principles like order blocks and liquidity zones, which are used by institutional traders to determine potential market moves.
Zone Analysis: The use of Premium, Discount, and Equilibrium zones provides a solid framework for determining where to enter and exit trades based on price discounts or premiums.
Confluence: Signals are not taken in isolation. They are confirmed by factors like trend direction (SMA) and order blocks, providing greater trade accuracy.
Risk Management: By integrating stop-loss functionality, traders can manage their risks effectively.
Visual Performance Metrics: The monthly and yearly performance dashboard gives valuable feedback on how well the strategy has performed historically.
Practical Use
Buy in Discount Zone: Traders would be looking to buy when the price is discounted relative to its recent range and is above the SMA, indicating an overall uptrend.
Sell in Premium Zone: Conversely, traders would be looking to sell when the price is at a premium relative to its recent range and below the SMA, indicating an overall downtrend.
Order Block Confirmation: Ensures that buying or selling is supported by historical price behavior at significant levels, providing confidence that the market is likely to react at these areas.
This strategy is designed to help traders take advantage of price inefficiencies and areas where institutional traders are likely to be active, increasing the odds of successful trades. By leveraging Smart Money concepts and strong technical confluence, it aims to provide high-probability trade setups.

Price Action StrategyThe **Price Action Strategy** is a tool designed to capture potential market reversals by utilizing classic reversal candlestick patterns such as Hammer, Shooting Star, Doji, and Pin Bar near dinamic support and resistance levels.
***Note to moderators
- The moving average was removed from the strategy because it was not suitable for the strategy and not participating in the entry or exit criteria.
- The moving average length has been replaced/renamed by the support/resistance lenght.
- The bullish engulfing and bearish engulfing patterns were also removed because in practice they were not working as entry criteria, since the candle price invariably closes far from the support/resistance level even considering the sensitivity range. There was no change in the backtest results after removing these patterns.
### Key Elements of the Strategy
1. Support and Resistance Levels
- Support and resistance are pivotal price levels where the asset has previously struggled to move lower (support) or higher (resistance). These levels act as psychological barriers where buying interest (at support) or selling interest (at resistance) often increases, potentially causing price reversals.
- In this strategy, support is calculated as the lowest low and resistance as the highest high over a 16-period length. When the price nears these levels, it indicates possible zones for a reversal, and the strategy looks for specific candlestick patterns to confirm an entry.
2. Candlestick Patterns
- This strategy uses classic reversal patterns, including:
- **Hammer**: Indicates a buy signal, suggesting rejection of lower prices.
- **Shooting Star**: Suggests a sell signal, showing rejection of higher prices.
- **Doji**: Reflects indecision and potential reversal.
- **Pin Bar**: Represents price rejection with a long shadow, often signaling a reversal.
By combining these reversal patterns with the proximity to dinamic support or resistance levels, the strategy aims to capture potential reversal movements.
3. Sensitivity Level
- The sensitivity parameter adjusts the acceptable range (Default 0.018 = 1.8%) around support and resistance levels within which reversal patterns can trigger trades (i.e. the closing price of the candle must occur within the specified range defined by the sensitivity parameter). A higher sensitivity value expands this range, potentially leading to less accurate signals, as it may allow for more false positives.
4. Entry Criteria
- **Buy (Long)**: A Hammer, Doji, or Pin Bar pattern near support.
- **Sell (Short)**: A Shooting Star, Doji, or Pin Bar near resistance.
5. Exit criteria
- Take profit = 9.5%
- Stop loss = 16%
6. No Repainting
- The Price Action Strategy is not subject to repainting.
7. Position Sizing by Equity and risk management
- This strategy has a default configuration to operate with 35% of the equity. The stop loss is set to 16% from the entry price. This way, the strategy is putting at risk about 16% of 35% of equity, that is, around 5.6% of equity for each trade. The percentage of equity and stop loss can be adjusted by the user according to their risk management.
8. Backtest results
- This strategy was subjected to deep backtest and operations in replay mode on **1000000MOGUSDT.P**, with the inclusion of transaction fees at 0.12% and slipagge of 5 ticks, and the past results have shown consistent profitability. Past results are no guarantee of future results. The strategy's backtest results may even be due to overfitting with past data.
9. Chart Visualization
- Support and resistance levels are displayed as green (support) and red (resistance) lines.
- Only the candlestick pattern that generated the entry signal to triger the trade is identified and labeled on the chart. During the operation, the occurrence of new Doji, Pin Bar, Hammer and Shooting Star patterns will not be demonstrated on the chart, since the exit criteria are based on percentage take profit and stop loss.
Doji:
Pin Bar and Doji
Shooting Star and Doji
Hammer
10. Default settings
Chart timeframe: 20 min
Moving average lenght: 16
Sensitivity: 0.018
Stop loss (%): 16
Take Profit (%): 9.5
BYBIT:1000000MOGUSDT.P

Fibonacci Swing Trading BotStrategy Overview for "Fibonacci Swing Trading Bot"
Strategy Name: Fibonacci Swing Trading Bot
Version: Pine Script v5
Purpose: This strategy is designed for swing traders who want to leverage Fibonacci retracement levels and candlestick patterns to enter and exit trades on higher time frames.
Key Components:
1. Multiple Timeframe Analysis:
The strategy uses a customizable timeframe for analysis. You can choose between 4hour, daily, weekly, or monthly time frames to fit your preferred trading horizon. The high and low-price data is retrieved from the selected timeframe to identify swing points.
2. Fibonacci Retracement Levels:
The script calculates two key Fibonacci retracement levels:
0.618: A common level where price often retraces before resuming its trend.
0.786: A deeper retracement level, often used to identify stronger support/resistance areas.
These levels are dynamically plotted on the chart based on the highest high and lowest low over the last 50 bars of the selected timeframe.
3. Candlestick Based Entry Signals:
The strategy uses candlestick patterns as the only indicator for trade entries:
Bullish Candle: A green candle (close > open) that forms between the 0.618 retracement level and the swing high.
Bearish Candle: A red candle (close < open) that forms between the 0.786 retracement level and the swing low.
When these candlestick patterns align with the Fibonacci levels, the script triggers buy or sell signals.
4. Risk Management:
Stop Loss: The stop loss is set at 1% below the entry price for long trades and 1% above the entry price for short trades. This tight risk management ensures controlled losses.
Take Profit: The strategy uses a 2:1 risk-to-reward ratio. The take profit is automatically calculated based on this ratio relative to the stop loss.
5. Buy/Sell Logic:
Buy Signal: Triggered when a bullish candle forms above the 0.618 retracement level and below the swing high. The bot then places a long position.
Sell Signal: Triggered when a bearish candle forms below the 0.786 retracement level and above the swing low. The bot then places a short position.
The stop loss and take profit levels are automatically managed once the trade is placed.
Strengths of This Strategy:
Swing Trading Focus: The strategy is ideal for swing traders, targeting longer-term price moves that can take days or weeks to play out.
Simple Yet Effective Indicators: By only relying on Fibonacci retracement levels and basic candlestick patterns, the strategy avoids complexity while capitalizing on well-known support and resistance zones.
Automated Risk Management: The built-in stop loss and take profit mechanism ensures trades are protected, adhering to a strict 2:1 risk/reward ratio.
Multiple Timeframe Analysis: The script adapts to various market conditions by allowing users to switch between different timeframes (4hour, daily, weekly, monthly), giving traders flexibility.
Strategy Use Cases:
Retracement Traders: Traders who focus on entering the market at key retracement levels (0.618 and 0.786) will find this strategy especially useful.
Trend Reversal Traders: The strategy’s reliance on candlestick formations at Fibonacci levels helps traders spot potential reversals in price trends.
Risk Conscious Traders: With its 1% risk per trade and 2:1 risk/reward ratio, the strategy is ideal for traders who prioritize risk management in their trades.

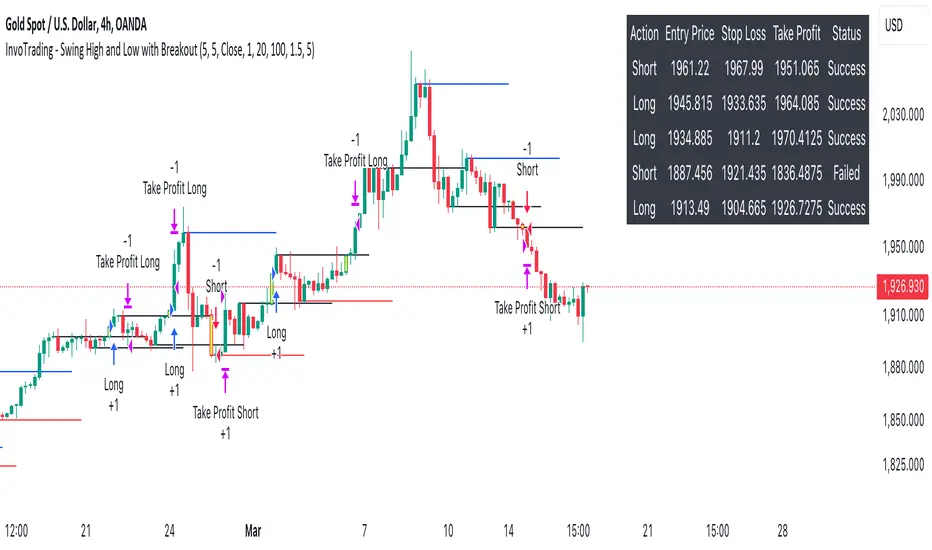
InvoTrading - Swing High and Low with BreakoutInvoTrading - Swing High and Low with Breakout Strategy
This strategy is designed to identify trading opportunities based on swing highs and lows, combined with breakout confirmations. It utilizes pivot points to detect potential reversal levels and initiates trades when the price breaks out of these levels under specific conditions.
Key Features:
- Pivot Points: The strategy calculates pivot highs and lows using customizable left and right bars. These pivots represent potential swing points in the market.
- Breakout Detection: It monitors for breakouts above pivot highs (Bullish Break of Structure - BOS) and below pivot lows (Bearish Break of Structure).
- Strong Swings (Optional): You can enable "Strong Swing" detection, which considers only those pivots where the price attempted but failed to break the pivot level, indicating stronger support or resistance.
- Trade Management: The strategy sets entry points, stop losses, and take profits based on a customizable risk-reward ratio.
- Trade Table: An optional table displays recent trades, including their status (Pending, Success, or Failed).
- Visual Aids: Customizable colors and line settings help visualize pivot points, strong swings, and breakout candles on the chart.
---
Settings:
1. Pivot Settings:
- Left Bars: Number of bars to the left of the pivot point (default: 5).
- Right Bars: Number of bars to the right of the pivot point (default: 5).
- Pivot Based On: Choose between "High/Low" or "Close" prices for pivot calculations.
2. Color Settings:
- Pivot High Color: Color for Pivot High markers (default: Blue).
- Pivot Low Color: Color for Pivot Low markers (default: Red).
- Strong Swing High Color: Color for Strong Swing High markers (default: Black).
- Strong Swing Low Color: Color for Strong Swing Low markers (default: Black).
- Breakout Candle Color (BOS): Color for the breakout candle (default: Yellow).
3. Line Settings:
- Line Width: Width of the pivot lines (default: 1).
- Line Length (Bars): Length of the pivot lines in bars (default: 20).
- Maximum Number of Lines to Keep: Limits the number of pivot lines displayed to avoid clutter (default: 100).
4. Trade Settings:
- Enable Buy and Sell Signals: Activates trade entries and exits on the chart (default: False).
- Show Trades Table: Displays a table summarizing recent trades (default: False).
- Risk-Reward Ratio: Sets the desired risk-reward ratio for trades (default: 1.5).
- Number of Trades to Display: Maximum number of recent trades shown in the table (default: 5).
- Enable Strong Trade: Only triggers trades when a "Strong Swing" is detected (default: False).
---
How It Works:
- Pivot Detection: The script identifies pivot highs and lows based on the specified number of left and right bars.
- Strong Swings: If enabled, the strategy marks a pivot as a strong swing if the price attempts to break it but closes back within the pivot level.
- Breakout Confirmation:
- Long Entry: Occurs when the price closes above a pivot high, signaling a bullish breakout. If "Strong Trade" is enabled, it must be a strong swing high.
- Short Entry: Occurs when the price closes below a pivot low, signaling a bearish breakout. If "Strong Trade" is enabled, it must be a strong swing low.
- Trade Execution: Upon a valid breakout, the strategy places a trade with a stop loss set at the previous candle's low (for longs) or high (for shorts). The take profit is calculated based on the specified risk-reward ratio.
- Trade Monitoring: The strategy updates the status of each trade (Pending, Success, Failed) based on whether the take profit or stop loss is hit.
- Visualization: Breakout candles are highlighted, and pivot lines are drawn with customizable colors and widths. Strong swings are marked distinctly.
---
Usage Tips:
- Backtesting: Before using this strategy live, backtest it on different time frames and instruments to assess its performance.
- Customization: Adjust the pivot settings and risk-reward ratio to match your trading style and the volatility of the instrument you're trading.
- Risk Management: Always use proper risk management techniques, even though the strategy calculates stop losses and take profits.
Price and Volume Breakout Buy Strategy [TradeDots]The "Price and Volume Breakout Buy Strategy" is a trading strategy designed to identify buying opportunities by detecting concurrent price and volume breakouts over a specified range of candlesticks.
This strategy is optimized for assets demonstrating high volatility and significant momentum spikes.
HOW IT WORKS
The strategy first takes the specific number of candlesticks as the examination window for both price and volume.
These values are used as benchmarks to identify breakout conditions.
A trade is initiated when both the closing price and the trading volume surpass the maximum values observed within the predetermined window.
Price must be above a designated moving average, serving as the trend indicator, ensuring that all trades align with the prevailing market trend.
APPLICATION
This strategy is particularly effective for highly volatile assets such as Bitcoin and Ethereum, capitalizing on the cues from sudden price and volume breakouts indicative of significant market movement, often driven by market smart money traders.
However, for broader markets like the S&P 500, this strategy may be less effective due to less pronounced volume and price shifts compared to the cryptocurrency markets.
DEFAULT SETUP
Commission: 0.01%
Initial Capital: $10,000
Equity per Trade: 70%
Backtest result sometimes gives fewer than 100 trades under certain higher timeframes, as most trades tend to have a long holding period. Entry conditions are also more stringent, which, combined with the relatively brief history of cryptocurrencies, results in fewer trades on longer timeframes.
Users are advised to adjust and personalize this trading strategy to better match their individual trading preferences and style.
RISK DISCLAIMER
Trading entails substantial risk, and most day traders incur losses. All content, tools, scripts, articles, and education provided by TradeDots serve purely informational and educational purposes. Past performances are not definitive predictors of future results.

Support and Resistance RoboTBINANCE:ETHUSDT
Algorithmic Trader
Coded by Pinescript V5
Best strategy you can find in trading cryptocurrencies
With the ability to adjust settings
Profitable each year
This strategy uses supports and resistances combined with ichimoku
This automated strategy trades on ETH/USD
(ranks second in cryptocurrency marketcap).
We have had real trade results for more than 10
months and backtesting for more than 8 years.
The results are for mid-risk
settings. If the settings are changed, you can
potentially achieve more profit or a lower
drawdown.
Default settings : EMA,EMA,14,1.5,1.5,23,0.5,31,10,W
“An investment in knowledge pays the best interest”
Benjamin Franklin
If you're interested, we can
provide you with access to
examine the strategy.
Thanks!

[Support and Resistance with Trend Lines] with Backtest (TSO) with Backtest (TSO)
===========================================================================
===========================================================================
This indicator serves as a comprehensive full-cycle trading system, providing alerts at each stage of the trade, from opening to closure. The algorithm uses most recent and historical S&R (Support and Resistance) levels with most recent and historical Trend Lines, generating signals for trades when Breaks/Bounces occur (Trade Open Signal triggers can be configured via very customizable indicator Input "Signal Trigger Matrix" settings). With signal for trade open, TP (Take Profit and SL (Stop Loss) levels are calculated as well and marked on the chart including alerts for each action of the trade. The indicator offers a variety of automated approaches for TP (Take-Profit) and SL (Stop-Loss) settings. These include static current/historical S&R (Support and Resistance) levels or S&R/Trend Lines dynamic breaks for TP (Take-Profit) and various SL (Stop-Loss) approaches, including ATR Trailing SL, opposite S&R (Support and Resistance) levels SL, opposite Trend Lines SL and more. This diverse set of tools ensure flexibility in tailoring TP (Take-Profit) and SL (Stop-Loss) parameters to different market conditions, contributing to a more adaptive and robust trading system. Additionally, a series of signal analysis tools, including market sentiment, candle bar analysis, divergence, and volume, enhance the precision of trading signals.
* Works with popular timeframes: 1M, 3M, 5M, 15M, 30M, 45M, 1H.
* Works well with Futures and Indices, can be used to trade Stocks, Crypto and FOREX.
* Includes LIVE alert/labels Breakouts and Bounces signal trigger feature, which can be used for scalping (NOTE: This approach cannot be backtested).
* Every action of the trade is calculated on a confirmed closed candle bar state (barstate.isconfirmed), so the indicator will never repaint.
==============================================================
Indicator examples:
---------------------------------------------------------------------------
Strategy Config: SRTL_MES_15M3Y_EODoff_ALL
Here is a nice example of MES (Micro E-Mini S&P 500 Index Futures) configuration, which uses S&R (Support and Resistance) breakouts as signal trigger with Elliot Wave confirmation and previous S&R historical levels for TP (Take-Profit).
---------------------------------------------------------------------------
An example of an intraday Tesla trade. Also the green arrows will be displayed IMMEDIATELY when Breakout/Reverse Bounce occurs (same an Alert will be triggered immediately).
===========================================================================
Trading open/close/TP/SL labels, plots and colors explanations:
---------------------------------------------------------------------------
>>> S&R (Support and Resistance) levels/lines: orange - support, blue - resistance (can be hidden).
>>> Trend Lines: yellow - support, green - resistance (can be hidden).
>>> Blue labels show resistance breakouts and bounces, light-blue - bullish, dark-blue - bearish
>>> Yellow labels show resistance breakouts and bounces, light-yellow - bullish, dark-yellow - bearish
>>> Green/Red arrows on top/bottom of candle bar will show LIVE breakouts (if turned on)
>>>>> LONG open: green "house" looking arrow below candle bar.
>>>>> SHORT open: red "house" looking arrow above candle bar.
>>>>> LONG/SHORT take-profit target: green/red circles (multi-profit > TP2/3/4/5 smaller circles).
>>>>> LONG/SHORT stop-loss target: green/red + crosses.
>>>>> LONG/SHORT take-profit hits: green/red diamonds.
>>>>> LONG/SHORT stop-loss hits: green/red X-crosses.
>>>>> LONG/SHORT EOD (End of Day | Intraday style) close (profitable trade): green/red squares.
>>>>> LONG/SHORT EOD (End of Day | Intraday style) close (loss trade): green/red PLUS(+)-crosses.
===========================================================================
STATS TABLE ///////////////////////////////////////////////////////////////
---------------------------------------------------------------------------
>>> Trading STATS table on the chart showing current trade direction, Last TP (Take-Profit) Taken, Current Trade PL (profit/loss in price difference from trade open to the very current state).
---------------------------------------------------------------------------
CUSTOM TRADING DATE RANGE /////////////////////////////////////////////////
---------------------------------------------------------------------------
>>>>> This feature can be used to manually set indicator trading range from and to a specific date and time. NOTE: This is not intended for a very long date range backtesting, utilize TradingView Strategy Tester for that.
* Use TradingView “Strategy Tester” to see Backtesting results
NOTE: If Strategy Tester does not show any results with Date Ranged fully unchecked, there may be an issue where a script opens a trade, but there is not enough TradingView power to set the Take-Profit and Stop-Loss and somehow an open trade gets stuck and never closes, so there are “no trades present”. In such case - manually check “Start”/“End” dates or use “Deep Backtesting” feature!
---------------------------------------------------------------------------
INTRADAY ACTIVE TRADING SESSION CONFIGURATION /////////////////////////////
---------------------------------------------------------------------------
>>> Regional Active Trading Session Hours Schedule: If selected - trades will only open during regional active trading session, if 'OFF', there will be no trading schedule and trades will open 24/7.
>>> EOD(End of Day) Close - On/Off: Close the trade if it's still open at the end of active trading session (on the very last candle bar). NOTE: If no region is selected at 'Regional Active Trading Session Schedule' - there will be no EOD(End of Day) Close and trades will run overnight until either SL(Stop-Loss) or TP(Take-Profit) is hit!
>>>>> EOD(End of Day) Close - 1 candle bar before last: This is specifically for stocks as while usually indices can be closed 15minutes after the market closes, for stocks - the last candle bar closes at the same time with the market active trading session, which if closed - trades can't be closed until next day/session! Enable this setting for the trade to close/alert 1 candle bar before the last one, so there is still time to close the trade at the Broker (NOTE: depending on the timeframe, 1 candle bar can be: 15sec, 30sec, 1min, 3min, 5min, 15min, 30min, 45min, 1h).
---------------------------------------------------------------------------
SIGNAL TRIGGER MATRIX ////////////////////////////////////////////////
---------------------------------------------------------------------------
>>> Trading Engine: This setting turns on TradingView Strategy trading engine for backtesting.
>>> Market Session Only: With this setting turned on, all signal trigger Breaks/Bounces will be hidden during Pre/Post market time.
>>> Plot S&R Levels/Lines: Plot S&R (Support and Resistance) on chart. Note: historical levels/lines will only be plotted if hit (Break/Bounce).
>>> Plot Trend Lines Levels/Lines: Plot Trend Lines levels/lines on chart. Note: historical levels/lines will only be plotted if hit (Break/Bounce).
>>> Use S&R Current Levels | Use S&R Historical Levels | Use Trend Lines Current Levels | Use Trend Lines Historical Levels |: Choose which levels should be used for Breaks/Bounces to be captured on. If all triggers are turned on/checked - whatever happens 1st wins the trigger.
>>> Breaks | Bounces: 'Breaks': Turn on Breaks through levels/lines signal trigger. | 'Bounces': Turn on Bounces off levels/lines signal trigger.
>>> Signal: Regular | Signal: S&R Combo | Signal: TL Combo | Signal: S&R + TL Combo | Signal: Repeat Action |: Trade open signal trigger execution approach MATRIX (If 1 or more turned on at the same time - whatever comes first will be the trade signal trigger). 'Regular': A single Break/Bounce must occur on a closed bar for signal trigger. 'S&R Combo': A combination of 2 Current + Historical S&R (Support and Resistance) Break/Bounce must happen in the same direction on same bar for signal trigger. 'TL Combo': A combination of 2 Current + Historical Trend Lines Break/Bounce must happen in the same direction on same bar for signal trigger. 'S&R + TL Combo': a combination of ANY S&R and Trend Line Break/Bounce must happen in the same direction on same bar for signal trigger. 'Repeat Action': Initial and then confirmation (2nd/3rd/etc. consecutive occurence) Break/Bounce must occur on same level/line for signal trigger.
>>> Historical - Look Back (# of days): How far back (in # of days) will historical S&R/Trend Lines will be used for Trade Open signals/TP/SL/etc.
>>> Historical - Look Back Invalidation (# of days): IF THERE IS TOO MUCH HISTORICAL LEVELS/LINES ON CHART - LOWER THIS SETTING + MAKE SURE IT'S SMALLER THAN 'Historical - Look Back (# of days)'. With big Look back period (5+ days) - it can become very messy with too many historical levels/lines. To clear oldest historical levels/lines - set Look Back Invalidation # of days to less than Historical Look Back # of days. (After X # of Look Back Invalidation days - older levels/lines will become invalidated and no longer used for opening trades/TP (Take-Profit)/SL (Stop-Loss), while newer levels/lines will still be discovered.
>>> S&R/Trend Lines - Support/Resistance combined into 1 entity: Every level or a line becomes simply a level or a line, regardless if it originally was a support or resistance. By default, depending on the level/line originally being support or resistance - the signal direction will be such as: Resistance is broken > LONG / bounced > SHORT; Support is broken > SHORT / bounced > LONG; with this setting on, either level or line can be both broken or bounced off in ANY direction, trade open direction will depend on current market sentiment only.
---------------------------------------------------------------------------
S&R CONFIGURATION ////////////////////////////////////////////////
---------------------------------------------------------------------------
>>> S&R Search - Left Bars (current): This setting is for calculating optimal S&R (Support and Resistance) levels (in combination with below - Right Bars).
>>> S&R Search - Right Bars (current): This setting is for calculating optimal S&R (Support and Resistance) levels (in combination with above - Left Bars).
>>> S&R Search - Custom Resolution (current): This is a custom timeframe setting specifically for S&R Search, it disregards current chart timeframe. This is great to use for scalping, for example: with main chart set to 1min and the custom timeframe set to 3min or 5min - there will be stronger support/resistance levels with more detailed price action.
>>> S&R Search - Left Bars (historical): This setting is for calculating optimal S&R (Support and Resistance) levels (in combination with below - Right Bars).
>>> S&R Search - Right Bars (historical): This setting is for calculating optimal S&R (Support and Resistance) levels (in combination with above - Left Bars).
>>> S&R Search - Custom Resolution (historical): This is a custom timeframe setting specifically for S&R Search, it disregards current chart timeframe. This is great to use for scalping, for example: with main chart set to 1min and the custom timeframe set to 3min or 5min - there will be stronger support/resistance levels with more detailed price action.
>>> S&R - Historical S&R Levels - Extend to the right: Extend all S&R lines to the right.
>>> S&R (Current/Historical) - Live Breakout/Bounce - ALERT/SHOW: NOTE: Alert wlil trigger immediately at price Breaking thru or Bouncing off level/line and an arrow above /below the bar will show the direction of breakout/bounce. If on that same live bar - price comes back causing the Breakout/Bounce become no longer valid - the arrow will disappear as the condition of the Break/Bounce will no longer be valid.
---------------------------------------------------------------------------
TREND LINES CONFIGURATION ////////////////////////////////////////////////
---------------------------------------------------------------------------
>>> Show: Trend Line development (where it 'did not exist' yet): It takes 2 pivots to develop a trend line, pivot is established at least 3 candle bars later from where the pivot is. With this setting turned on - it will plot dashed lines where trend lines originated connecting the 1st and 2nd pivot point up to where the trend line became established (where in reality you would now be able to draw a certain trend line). Established already generated trend line are plotted with a solid line.
>>> Trend Lines - Line Slope Confirmation: LONG breakout will only be shown if trend line is goind downslope \. SHORT breakout will only be shown if trend line is goind upslope /.
>>> Trend Lines - Search - Left Bars (current): This setting is for calculating optimal Trend Lines.
>>> Trend Lines - Search - Right Bars (current): This setting is for calculating optimal Trend Lines.
>>> Trend Lines - Custom Resolution (current): This is a custom timeframe setting specifically for S&R Search, it disregards current chart timeframe. This is great to use for scalping, for example: with main chart set to 1min and the custom timeframe set to 3min or 5min - there will be stronger support/resistance levels with more detailed price action.
>>> Trend Lines - Search - Left Bars (historical): This setting is for calculating optimal Trend Lines.
>>> Trend Lines - Search - Right Bars (historical): This setting is for calculating optimal Trend Lines.
>>> Trend Lines - Custom Resolution (historical): This is a custom timeframe setting specifically for S&R Search, it disregards current chart timeframe. This is great to use for scalping, for example: with main chart set to 1min and the custom timeframe set to 3min or 5min - there will be stronger support/resistance levels with more detailed price action.
>>> Trend Lines - Historical Trend Lines - Extend to the right: Extend all Trend Lines to the right.
>>> Trend Lines (Current/Historical) - Live Breakout/Bounce - ALERT/SHOW: NOTE: Alert will trigger immediately at price Breaking thru or Bouncing off level/line and an arrow above /below the bar will show the direction of breakout/bounce. If on that same live bar - price comes back causing the Breakout/Bounce become no longer valid - the arrow will disappear as the condition of the Break/Bounce will no longer be valid.
---------------------------------------------------------------------------
TAKE-PROFIT/STOP-LOSS CONFIGURATION ///////////////////////////////////////
---------------------------------------------------------------------------
>>> TP (Take-Profit) System: 'S&R Static Current/Historical': TP (Take-Profit) is calculated using current/historical S&R (Support & Resistance) levels at trade open and remains static. 'S&R/Trend Lines Dynamic Breaks': TP (Take-Profit) is fully dynamic and will be trigger at price above trade open price and with Breakout occurence (S&R or Trend Line current/historical breakout).
>>> TP (Take-Profit) # of targets: It is wise to divide the trade into several profit targets. With this setting - up to 5 TP (Take-Profit) targets can be approached. The trade will be equally divided up by the selected # of TP (Take-Profit) targets.
>>> SL (Stop-Loss) System: 'ATR-Trailing-SL': SL (Stop-Loss) is trail-following the ATR (Average True Range) line, NOTE: If at signal trigger, ATR will be against the trade direction - trade open signal will be skipped; 'S&R-Static-SL': SL (Stop-Loss) is set at trade open per optimal most recent S&R level and remains there until trade closes; 'TrendLines-Static-SL': SL (Stop-Loss) is set at trade open per optimal most recent trend line and remains there until trade closes; 'TrendLines-Dynamic-SL': SL (Stop-Loss) will be set per current opposite trend line and follow it until trade is open.; 'Oppos-Sig-Trd-in-Loss': SL (Stop-Loss) will trigger at opposite signal with trade currently at loss.
>>> SL (Stop-Loss) - On/Off: Without SL (Stop-Loss), unless EOD (End of Day) Close is turned on - there will be no SL (Stop-Loss) at all!
---------------------------------------------------------------------------
MARKET SENTIMENT CONFIRMATION ///////////////////////////////////////
---------------------------------------------------------------------------
>>> Market Sentiment: Signal is confirmed per Market Sentiment direction. If Market Sentiment is turned off - whatever signal comes 1st will be the trade open trigger.
---------------------------------------------------------------------------
SIGNAL ANALYSIS AND CLEANUP ///////////////////////////////////////////////
---------------------------------------------------------------------------
>>> Signal Cleanup - Bar Color: Include Bar Color (bullish/bearish) confirmation, LONG signal will only be opened if signal bar is green/bullish, SHORT if red/bearish.
>>> Signal Cleanup - Bar Directional Structure: Skip opposite bar structure types signals (For example: bearish green hammer).
>>> Signal Cleanup - Bar Doji Skip: Skip doji (indecisive) candles signals.
>>> Signal Cleanup - EWO (Elliott Wave Oscillator): Include EWO (Elliott Wave Oscillator), LONG will only be opened if EWO is bullish / SHORT if EWO is bearish.
>>> Signal Cleanup - VWAP (Volume-Weighted Average Price): Include VWAP (Volume-Weighted Average Price), LONG will only be opened if price is above VWAP / SHORT if price is below VWAP.
>>> Signal Cleanup - MA (Moving Average) Confirmation: Include MA (Moving Average), LONG will only be opened if MA is bullish / SHORT if MA is bearish.
>>> Signal Cleanup - ATR (Average True Range): Include ATR (Average True Range) confirmation, LONG will only be opened if ATR is bullish / SHORT if ATR is bearish.
>>> Signal Cleanup - Divergence(RSI + MACD): Include Divergence (RSI + MACD ) confirmation, LONG will only be opened if Divergence is bullish / SHORT if Divergence is bearish.
>>> Signal Cleanup - Volume % Strength: Include Volume strength/percentage confirmation, LONG/SHORT will only be opened with strong Volume matching the signal direction | By default, strong Volume percentage is set to 150% and weak to 50%.
>>> Signal Cleanup - Volume Above Average: Include Volume Above Moving Average (Volume closing bar closes above volume moving average) confirmation, LONG/SHORT will only be opened with Volume above average - Volume closed bar color must match the closed price color (bullish/bearish direction) + Volume bar must be closed above volume MA line).
---------------------------------------------------------------------------
===========================================================================
||||||||||||||||||||||||||||||||||| *** ||||||||||||||||||||||||||||||||||| *** |||||||||||||||||||||||||||||||||||
||||||||||||||||||||||||||||||||||| *** ||||||||||||||||||||||||||||||||||| *** |||||||||||||||||||||||||||||||||||
TP System - VERY IMPORTANT INFO!
-------------------------------------------------------------------------------------------------------------------
"TP PERCENTAGE" - amount by which current trade/position needs to be reduced/partially closed/sold.
-------------------------------------------------------------------------------------------------------------------
TP System: Dynamic
"TP PERCENTAGE" - will always be the same amount (trade/position size divided by the # of take-profit(TP) targets) and percentage to be closed will always be of the ORIGINAL trade/position.
-------------------------------------------------------------------------------------------------------------------
TP System: Static
"TP PERCENTAGE" - will always be the same amount IF take-profit(TP) targets are hit 1-by-1 (TP1 > TP2 > TP3 > TP4 > TP5), otherwise it will vary and unless it is a 1st take-profit(TP1), the REMAINING trade/position size will always be smaller than original and therefore the percentage to be closed will always be of the REMAINING trade/position and NOT the original one!
-------------------------------------------------------------------------------------------------------------------
"TP PERCENTAGE" CheatSheet (these are the only percentages you may see)
-----------------------------------------------------------------------
TP PERCENTAGE---Close/Sell Amount-------------Example (trade size: 50 stocks)
20%-------------trade size * 0.2--------------50 * 0.2 = 10 stocks
25%-------------trade size * 0.25-------------50 * 0.25 = 12.5(~13) stocks
34%-------------trade size * 0.34-------------50 * 0.34 = 17 stocks
40%-------------trade size * 0.4--------------50 * 0.4 = 20 stocks
50%-------------trade size * 0.5--------------50 * 0.5 = 25 stocks
60%-------------trade size * 0.6--------------50 * 0.6 = 30 stocks
66%-------------trade size * 0.66-------------50 * 0.66 = 33 stocks
75%-------------trade size * 0.75-------------50 * 0.75 = 37.5(~38) stocks
80%-------------trade size * 0.8--------------50 * 0.8 = 40 stocks
100%------------trade size--------------------50 = 50 stocks
-----------------------------------------------------------------------
If for any reason a portion of the current/remaining trade closed at such occurrence was slightly wrong, it is not an issue. Such occurrences are rare and with slight difference in partial TP closed is not significant to overall performance of our algorithms.
||||||||||||||||||||||||||||||||||| *** ||||||||||||||||||||||||||||||||||| *** |||||||||||||||||||||||||||||||||||
||||||||||||||||||||||||||||||||||| *** ||||||||||||||||||||||||||||||||||| *** |||||||||||||||||||||||||||||||||||
===========================================================================
Alert Settings (you don’t have to touch this section unless you will be using TradingView alerts through a Webhook to use with trading bot)
---------------------------------------------------------------------------
Here is how a LONG OPEN alert looks like.
NOTE: Each label , , etc. is customizable, you can change the text of it within indicator Input settings.
ALERT >>>>>>>>>>>>>>>>>>>>>>>>>>>>>>>>>>>>>>>>>>>>>>>
COIN: BTCUSD
TIMEFRAME: 15M
LONG: OPEN
ENTRY: 20000
TP1: 20500
TP2: 21000
TP3: 21500
TP4: 22500
TP5: 23500
SL: 19000
Leverage: 0
---------------------------------------------------------------------------
Here is how a TP1 alert will look with 5 TPs breakdown of the trade.
NOTE1: Next to TP1 taken it will show at which price it was triggered.
NOTE2: Next to "TP Percentage" it shows how much of the CURRENT/ACTIVE/REMAINING trade needs to be closed.
NOTE2: If TP2/3/4/5 comes before TP1 - the alert will tell you exactly how many percent of the trade needs to be closed!
ALERT >>>>>>>>>>>>>>>>>>>>>>>>>>>>>>>>>>>>>>>>>>>>>>>
COIN: BTCUSD
TIMEFRAME: 15M
LONG: TP1
TP1: 20500
TP Percentage: 20%
---------------------------------------------------------------------------
Here is how an alert will look for LONG - STOP-LOSS.
ALERT >>>>>>>>>>>>>>>>>>>>>>>>>>>>>>>>>>>>>>>>>>>>>>>
COIN: BTCUSD
TIMEFRAME: 15M
ENTRY: 20000
LONG: SL
SL: 19000
---------------------------------------------------------------------------
Here is how an alert will look for LONG - EOD (End of Day) In Profit close.
ALERT >>>>>>>>>>>>>>>>>>>>>>>>>>>>>>>>>>>>>>>>>>>>>>>
COIN: BTCUSD
TIMEFRAME: 15M
LONG: EOD-Close (profit)
ENTRY: 20000
EOD-Close: 21900
===========================================================================
Adding Alerts in TradngView
---------------------------------------------------------------------------
-Add indicator to chart and make sure the correct strategy is configured (check Backtesting results)
-Right-click anywhere on the TradingView chart
-Click on Add alert
-Condition: Select this indicator by it’s name
-Immediately below, change it to "alert() function calls only", as other wise there will be 2 alerts for every alert!
-Expiration: Open-ended (that may require higher tier TradingView account, otherwise the alert will need to be occasionally re-triggered)
-Alert name: Whatever you desire
-Hit “Create”
-Note: If you change ANY Settings within the indicator – you must DELETE the current alert and create a new one per steps above, otherwise it will continue triggering alerts per old Settings!
===========================================================================
Good Luck! (NOTE: Trading is very risky, past performance is not necessarily indicative of future results, so please trade responsibly!)
---------------------------------------------------------------------------
NOTE: There seems to be a strange glitch when strategy is running live, it will show "double-take" take-profits labels on the chart. This is not affecting the script logic and backtesting results, if you simply change the timeframe real quick to something else then back - it will no longer show the duplicate orders... this must be some sort of a glitch as every alert was thoroughly tested to make sure everything is working!

Pivot Percentile Trend - Strategy [presentTrading]
█ Introduction and How it is Different
The "Pivot Percentile Trend - Strategy" from PresentTrading represents a paradigm shift in technical trading strategies. What sets this strategy apart is its innovative use of pivot percentiles, a method that goes beyond traditional indicator-based analyses. Unlike standard strategies that might depend on single-dimensional signals, this approach takes a multi-layered view of market movements, blending percentile calculations with SuperTrend indicators for a more nuanced and dynamic market analysis.
This strategy stands out for its ability to process multiple data points across various timeframes and pivot lengths, thereby capturing a broader and more detailed picture of market trends. It's not just about following the price; it's about understanding its position in the context of recent historical highs and lows, offering a more profound insight into potential market movements.
BTC 6h L/S
Where traditional methods might react to market changes, the Pivot Percentile Trend strategy anticipates them, using a calculated approach to identify trend strengths and weaknesses. This foresight gives traders a significant advantage, allowing for more strategic decision-making and potentially increasing the chances of successful trades.
In essence, this strategy introduces a more comprehensive and proactive approach to trading, harnessing the power of advanced percentile calculations combined with the robustness of SuperTrend indicators. It's a strategy designed for traders who seek a deeper understanding of market dynamics and a more calculated approach to their trading decisions.
Local picture
█ Strategy, How It Works: Detailed Explanation
🔶 Percentile Calculations
- The strategy employs percentile calculations to assess the relative position of current market prices against historical data.
- For a set of lengths (e.g., `length * 1`, `length * 2`, up to `length * 7`), it calculates the 75th percentile for high values (`percentilesHigh`) and the 25th percentile for low values (`percentilesLow`).
- These percentiles provide a sense of where the current price stands compared to recent price ranges.
Length - 10
Length - 15
🔶 SuperTrend Indicator
- The SuperTrend indicator is a key component, providing trend direction signals.
- It uses the `currentTrendValue`, derived from the difference between bull and bear strengths calculated from the percentile data.
* used the Supertrend toolkit by @EliCobra
🔶 Trend Strength Counts
- The strategy calculates counts of bullish and bearish indicators based on comparisons between the current high and low against high and low percentiles.
- `countBull` and `countBear` track the number of times the current high is above the high percentiles and the current low is below the low percentiles, respectively.
- Weak bullish (`weakBullCount`) and bearish (`weakBearCount`) counts are also determined by how often the current lows and highs fall within the percentile range.
*The idea of this strength counts mainly comes from 'Trend Strength Over Time' @federalTacos5392b
🔶 Trend Value Calculation
- The `currentTrendValue` is a crucial metric, computed as `bullStrength - bearStrength`.
- It indicates the market's trend direction, where a positive value suggests a bullish trend and a negative value indicates a bearish trend.
🔶 Trade Entry and Exit Logic
- The entry points for trades are determined by the combination of the trend value and the direction indicated by the SuperTrend indicator.
- For a long entry (`shouldEnterLong`), the `currentTrendValue` must be positive and the SuperTrend indicator should show a downtrend.
- Conversely, for a short entry (`shouldEnterShort`), the `currentTrendValue` should be negative with the SuperTrend indicating an uptrend.
- The strategy closes positions when these conditions reverse.
█ Trade Direction
The strategy is versatile, allowing traders to choose their preferred trading direction: long, short, or both. This flexibility enables traders to tailor their strategies to their market outlook and risk appetite.
█ Default Settings and Customization
1. Trade Direction: Selectable as Long, Short, or Both, affecting the type of trades executed.
2. Indicator Source: Pivot Percentile Calculations, key for identifying market trends and reversals.
3. Lengths for Percentile Calculation: Various configurable lengths, influencing the scope of trend analysis.
4. SuperTrend Settings: ATR Length 20, Multiplier 18, affecting indicator sensitivity and trend detection.
5. Style Options: Custom colors for bullish (green) and bearish (red) trends, aiding visual interpretation.
6. Additional Settings: Includes contrarian signals and UI enhancements, offering strategic and visual flexibility.

Nifty 50 5mint Strategy
The script defines a specific trading session based on user inputs. This session is specified by a time range (e.g., "1000-1510") and selected days of the week (e.g., Monday to Friday). This session definition is crucial for trading only during specific times.
Lookback and Breakout Conditions:
The script uses a lookback period and the highest high and lowest low values to determine potential breakout points. The lookback period is user-defined (default is 10 periods).
The script also uses Bollinger Bands (BB) to identify potential breakout conditions. Users can enable or disable BB crossover conditions. BB consists of an upper and lower band, with the basis.
Additionally, the script uses Dema (Double Exponential Moving Average) and VWAP (Volume Weighted Average Price) . Users can enable or disable this condition.
Buy and Sell Conditions:
Buy conditions are met when the close price exceeds the highest high within the specified lookback period, Bollinger Bands conditions are satisfied, Dema-VWAP conditions are met, and the script is within the defined trading session.
Sell conditions are met when the close price falls below the lowest low within the lookback period, Bollinger Bands conditions are satisfied, Dema-VWAP conditions are met, and the script is within the defined trading session.
When either condition is met, it triggers a "long" or "short" position entry.
Trailing Stop Loss (TSL):
Users can choose between fixed points ( SL by points ) or trailing stop (Profit Trail).
For fixed points, users specify the number of points for the stop loss. A fixed stop loss is set at a certain distance from the entry price if a position is opened.
For Profit Trail, users can enable or disable this feature. If enabled, the script uses a "trail factor" (lookback period) to determine when to adjust the stop loss.
If the price moves in the direction of the trade and reaches a certain level (determined by the trail factor), the stop loss is adjusted, trailing behind the price to lock in profits.
If the close price falls below a certain level (lowest low within the trail factor(lookback)), and a position is open, the "long" position is closed (strategy.close("long")).
If the close price exceeds a certain level (highest high within the specified trail factor(lookback)), and a position is open, the "short" position is closed (strategy.close("short")).
Positions are also closed if they are open outside of the defined trading session.
Background Color:
The script changes the background color of the chart to indicate buy (green) and sell (red) signals, making it visually clear when the strategy conditions are met.
In summary, this script implements a breakout trading strategy with various customizable conditions, including Bollinger Bands, Dema-VWAP crossovers, and session-specific rules. It also includes options for setting stop losses and trailing stop losses to manage risk and lock in profits. The "trail factor" helps adjust trailing stops dynamically based on recent price movements. Positions are closed under certain conditions to manage risk and ensure compliance with the defined trading session.
CE=Buy, CE_SL=stoploss_buy, tCsl=Trailing Stop_buy.
PE=sell, PE_SL= stoploss_sell, tpsl=Trailing Stop_sell.
Remember that trading involves inherent risks, and past performance is not indicative of future results. Exercise caution, manage risk diligently, and consider the advice of financial experts when using this script or any trading strategy.

Price Action - Support & Resistance + MACD LONG StrategyUsing "Price Action - Support & Resistance by DGT" and the MACD (Moving Average Convergence Divergence) indicator in TradingView can help develop a trade strategy. Here's a step-by-step approach you can follow:
1. Identifying Support and Resistance Levels: Apply the "Price Action - Support & Resistance by DGT" indicator to your chart. This indicator helps you identify key support and resistance levels based on price action. These levels act as potential areas where the price may reverse or consolidate.
2. Confirming Support and Resistance Levels: Once the indicator has plotted support and resistance levels on your chart, analyze the historical price action around these levels. Look for multiple touches or bounces from the same level, which adds strength to the support or resistance zone.
3. Analyzing the MACD Indicator: Add the MACD indicator to your chart. The MACD consists of two lines: the MACD line and the signal line, along with a histogram representing the difference between the two lines. The MACD helps identify momentum and potential trend reversals.
When the MACD line crosses above the signal line and the histogram turns positive, it suggests bullish momentum.
4. Identifying Trade Opportunities:
Bullish Trade: Look for a bullish setup when the price approaches a strong support level identified by the "Price Action - Support & Resistance by DGT" indicator. Wait for the MACD lines to cross above the signal line and the histogram to turn positive, indicating bullish momentum. Enter a long position with a stop loss below the
support level.
Managing the Trade: Once you enter a trade, consider setting a target based on the distance between your entry point and the nearest significant support or resistance level. You can also use trailing stop losses or other risk management techniques to protect your profits and limit potential losses.
Remember that no trading strategy is guaranteed to be successful, and it's important to practice proper risk management and conduct thorough analysis before making any trading decisions. Additionally, it's recommended to backtest and demo trade this strategy before using it with real money.

Wunder Breakout botWunder Breakout bot
1. Wunder Breakout bot is based on the breakout of the trend line. Breakout is a technical trading strategy that is used to determine the moment of a trend line breakout on the price chart. It is based on the assumption that when price crosses a trend line, it signals a change in trend direction and the possible start of a new price movement.
2. The entry points for the trendline breakout strategy are based on the principle of breaking through a set trendline. This means that we look for the moment when the price of the asset crosses the trend line that we have established in order to enter a sell or buy position.
3. We use fixed take-profit and stop-loss, but you can use other risk management systems, based on the suggested settings.
4. Wunder Breakout bot script has added a function to calculate the risk per portfolio (your deposit). When this option is enabled, you get the calculation of the entry amount in dollars relative to your Stop Loss. You can chooseselect the percentage of risk per your portfolio in the settings. the percentage of risk per your portfolio in the settings. The loss will be calculated from the amount that will be displayed on the chart.
For example, if your deposit is $1000 and you set your risk at 1%, with a Stop Loss of 5%, your entry volume would be $200. The SL loss would be $10. $10 is your 1% risk or 1% of your deposit.
*Important! ** The risk per trade must be less than the Stop Loss value. If the risk is more than SL, you should use leverage.
The amount of funds included in the deal is calculated in dollars. This option was created if you want to send a dollar amount from Tradingview to the exchange. However, by specifying the volume in dollars, you will get the net profit and drawdown displayed incorrectly in the backtest results because TradingView calculates the backtest volume in contracts.
To display the correct net profit and drawdown values in Tradingview backtest results, use the "Volume in Contracts" option.

Bitcoin 30m Swing Trader Long/Short StrategyIntro
I want to share the results of my passionate hobby and the unstoppable chase for a profitable automated trading strategy. It has been created with the intention of trading only Bitcoin. Altcoins are not interesting for me, as I have discovered lots of issues with finding the right parameter values for experiencing a good performance. As altcoins typically follow the trend of bitcoin and characteristically have a high volatility that may cause stop-hunts, I decided to not over complicate this project. I was just aiming for a profitable trading strategy with an acceptable drawdown and enough confidence by a statistically significant number of trades beside a wide backtesting timespan (credits going out to TradingView: Deep Backtesting).
Total time spent on this is approximately 2 years.
Indicators used
RSI: Used for entries and trend reversal spots
MACD: Used for entry and exit optimiziation
ATR: Used for dynamic offsets in trend definition indicator
Custom trend indicator: Self-made indicator, based on simple price action of higher timeframes using pivot points to find support and resistance zones that have formerly been created
Strategy parameters
I have reduced the total parameters used to just a few. It took lots of working hours to find appropriate values along the trading algorithm and I don’t want to overcomplicate it to you.
This strategy is for those, who have been looking for a working strategy. No DIY kit.
Feel free to adapt Take profit or stop loss targets. But it’s not recommended to do so.
How it works
Entries:
I started with a kind of template that I have been using for strategies for a long time. This includes how to find the right Entries during a trend as well as spotting trend reverse opportunities. Here I combine simple indicators like RSI and MACD beside necessary trend conditions. If a target RSI Value is hit, it will enter a trade, after MACD histogram has stopped to fall/rise. Depends on long/short. While we are in a trade and trend reversed, it waits for a specific RSI target level to be hit, to reverse the trade. As simple as it is, it closes the open one and starts a trade in other direction.
Micro trend:
It starts to get more interesting when it comes to trend recognition, as it forms the core of the strategy and discovering appropriate values for it has been very hard. The final trend variable is defined by the responses over higher timeframes of my self-made trend indicator. Executed on the current timeframe, the trend indicator is quite interesting. But for a automated trading strategy it is necessary to deviate trading instructions from higher timeframes trends.
Macro trend:
The same process that happens for micro trend is also applied with much higher timeframes, like 3D or weekly. The basic assumption is, that if we are in a bull or bear run, where retail investors are flooding the markets, we are increasing our take profit targets respectively. This way we can catch bigger moves in bigger trends.
Exits:
Closing a trade generally happens when a TP target (in %) is hit, or the SL (in %) is hit. The strategy has a special treatment with SL’s. After it happens, the strategy is more careful about market conditions and typically waits for a countertrade. The third way of closing a trade has already been mentioned: the reverse trades. They happen during choppy market conditions. The strategy has also special awareness here and tracks, if reverse trades start to happen more often. After a while, it starts to be more restrictive in opening new reverse trades.
Performance
Capabilities and limitations:
As I have already mentioned the strategy is only optimized for bitcoin (Perpetual Futures). This does not mean, it can not be used on other markets, because the algorithm itself is universal appliable. A very hard task was about finding the right parameter values for the strategy performing like this. If you have a special wish to configure this strategy for a specific market, DM me. The strategy has been tested with different configurations on the following timeframes: 30, 15, 10, 5, 1. I have decided to publish the one for 30m TF, because its performance simply convinced me.
Repainting:
It has been tested lots of times against repainting.
Confidence:
The total backtesting performance reaches out to 2019-09-08. So the strategy has been managing to be successful since then, but this does not guarantee that the logic, this strategy follows, is going to continue this level in future.
Commission:
The algorithm is configured with 0.04% commission per trade, as it is on Binance (for Future Market orders).
Ordersize:
Its totally up to you, how much of your total equity should be traded. Nevertheless, I would personally recommend to not exceed 50% ordersize of your equity with this strategy. In the past, you would have had great performance beside a drawdown, that was from psychological point of view good to handle with. This strategy additionally uses STOP LOSSES, so you can never loose you whole ordersize at one trade.
Slippage:
You also must consider about getting slipped when trading this strategy on live markets. Statistically one could assume, that the slippage could be neutral, as it can be both positive or negative. It depends on your execution time, the exchange, on which you are executing trades and market conditions. But keep it in mind, as if you have too much slippage, this strategy would be unprofitable.

APIBridge support and resistance strategy for NSE OptionsStrategy Premise:
The strategy works on the Support and Resistance . The user specifies the trigger price and the strategy will open trades as soon as the market closes after crossing the trigger price. The stoploss and target is compulsory and the trades will close if either the target or stoploss is hit or Intraday end session is reached in case of MIS (Intraday settings) or expiry is reached .
If the positional settings (NRML) has been chosen then the trades will close when either stoploss or target hits or expiry is reached
==========Consecutive trades==========
The strategy takes a long entry on call long put short setting and a short position on put long and call short settings so call long and put short entries can be taken one after another without the need of closing the one of them. Similarly put long and call short can be taken one after another.
But put long and call short can not be taken one after another with both the trades open because on tradingview closes the previous long or short when we take short or long respectively. Similarly call long and put short can not be taken one after another with both the trades open
Create Alert
Simply copy the text written in Alert Message field on the top of input section and replace everything in the message box of the alert with this text
Strategy Parameters
1. Alert Message : Copy the string in the input field and replace with the text in the message box of the alert to get the automated trades
2. Use Backtesting : Check this box to use the backtesting parameters . The backtesting parameters will only show trades between the specified intervals
3. Starting Date and Time : The strategy will only place trades after this time according to logic
4. Ending Date and Time : The strategy willonly place trades before this time according to logic
5. Segment Type : Choose the segment type . MIS is Intraday and NRML is normal cash and carry/Positional
6. Start Session : This is the session in which the strategy will take entry according to logic every day . This parameter works only with MIS and not NRML
7. Ending Session : This is the session which will square off all the open trades . This parameter works only with MIS and not NRML
8. Long : Check this box for Long/Buy Positions
9. Long Price : This is the trigger price , the strategy will Long/Buy when the price closes after crossing this line.
10. Call or Put on Long : Choose whether you want to Long/Buy Call or Put
11. Stoploss and Target type for Long : Choose from the given types
12. Long Target : specify the target
13. Stoploss Value for Long : Specify the stoploss value
14. Use TSL : Check this to use trailing stoploss
15. ATR settings : Set the atr settings to use atr based stoploss
16. Short : Check this to Short/Sell
17. Short Price : This is the trigger price , the strategy will Long/Buy when the price closes after crossing this line.
18. Call or Put on Short: Choose whether you want to Long/Buy Call or Put
19. Stoploss and Target type for Short: Choose from the given types
20. Short Target : specify the target
21. Stoploss Value for Short: Specify the stoploss value
22. Use TSL : Check this to use trailing stoploss
23. ATR settings : Set the atr settings to use atr based stoploss
24. Instrument Type : Choose the option type
25. Expiry Settings : Configure the expiry date . the strategy will not take entry after expiry
26. Symbol : Specify Symbol name if want to trade in symbol other than current chart symbol
27. Strike Type/Money Type : select the money type
28. Strike Difference : Enter the difference between the two consecutive strikes of the choosen asset
29. Strike Distance from ATM : Enter the distance of strike from ATM which you want to buy in any strike type/money type . If zero has been choosen in case of OTM/ ITM then the strike dif will used as default
30. Quantity : Specify the number of lots you want to trade
31. Strategy Tag : Specify the strategy tag you wan to use with APIBRIDGE . If left blank it will trade in the strategy tag fed in the APIBRIDGE

[Strategy]Turtle's 20day High Low Break StrategyJapanese below / 日本語説明は下記
Overview
I have made this strategy mimicking the legendary traders group, Turtle’s 20days high low break strategy with more options available for take profit(TP) and stop loss(SL) conditions.
The main component of the strategy is same as my indicator, Previous N days/weeks/months high/low(see the link below) and with this strategy, you can backtest previous N days high/low break strategy.
Unlike the indicator, you can specify another previous N days high/low as TP condition. This is because Turtle used 10days low as TP condition for 20days high break buy strategy, according to articles/books about them.
ATR and other factors which is said to be used in their original strategy are not included in this strategy.
Previous N Days/Weeks/Months High Low
What is Turtle?
Turtle is the group of traders founded by Richard Dennis and William Eckhardt to prove their theory that good traders can be trained or not.
It is said that Turtle had made more than 175 million dollars over 5 years and some of the traders has become fund managers or successful individual traders even after the experiment.
What is this strategy like?
The strategy generates long entries once prices break previous N days highs and short entries when previous N days lows broken.
N is user input so you can adjust it for your own strategy.
As mentioned above, you can also specify another set of different previous N days high/low for TP conditions.
e.g. 55 days high(low) break for entry and 20days low(high) break for take profit condition.
How to use it?
What this strategy shows is almost same as the indicator, Previous N days/weeks/months high/low.
It displays previous N days/weeks/months highs and lows and you can set up entry condition based on previous N days high/low.
Previous N weeks/months highs/lows can be used as take profit points when you develop your own strategy based on this.
See the parameters below for the rest of the details.
Parameters
TP condition:
You can select from “Pips”, “When opposite entries” or “Previous high low break”.
When “When opposite entries” selected, the strategy exits the open positions when opposite directional entries happened. e.g. Long positions will be closed when short entries made.
If you would like to exit positions with specific previous N days highs/lows, you can enter N in Previous N days High/Low for TP field with “Previous high low break” selected.
SL condition:
You can select from “Pips” or “Swing High/Low”.
If “Swing High/Low” selected, left bars and right bars need input to determine swing high/low.
Note: If you select “pips” in TP/SL conditions, it currently works only for forex pairs.
What timeframe is the best for this strategy?
As this strategy is for swing trading, longer timeframes are the best.
Base on my quick check upon strategy’s performance over USD pairs in forex, daily timeframe works best, however, it could fit in with lower timeframes such as 4H and 1H by adjusting TP/SL conditions.
Look at the sample result below. The result shows the strategy’s performance for USDJPY for over 40 years on Daily timeframe and it performs fairly good with more than 2 profit factor over long period of time with up-trending equity curve.
It is just a simulation but the data shows Turtle’s strategy still works.
=================
概要
伝説のトレーダー集団タートルの20日高値・安値ブレイク手法を模倣して作成したストラテジーです。
利益確定や損切り条件を設定可能なようにして、より柔軟性を持たせています。
ストラテジーの主要な構造は過去にリリースしたインジケーターPrevious N days/weeks/months high/lowと同じです(下記リンク参照)。
このストラテジーを使うと、過去N日高値・安値のブレイク手法のバックテストを行うことが可能です。
また、前述のインジケーターとは異なり、このストラテジーでは利益確定条件のために、もう一つ別の過去N日高値・安値を設定することができます。これはタートルが20日高値のブレイクで買いエントリーを行う場合、10日安値ブレイクを手仕舞いの基準として使っていたことからです。
タートルのオリジナル手法ではATRやその他の要素も用いられていたようですが、このストラテジーには含まれていません。
Previous N Days/Weeks/Months High Low
タートルとは何か?
タートルとは、「優れたトレーダーは育成可能か?」の問いを証明するために、投資家リチャード・デニス氏とウィリアム・エックハート氏によって組織されたトレーダー集団です。
タートルは5年間に渡って1億7千5百万ドル以上を稼ぎ出したと言われており、この実験終了後にはヘッジファンドを運営する者や個人投資家として成功したトレーダーを輩出したことで知られています。
このストラテジーの特徴
このストラテジーは、価格が過去N日高値をブレイクした時にロングエントリーを、過去N日安値をブレイクした時にショートエントリーを実行します。
Nはパラメーターで指定可能なので、皆さんの独自の手法開発のために調整することができます。
また、前述の通り、利益確定条件としてエントリー条件とは別の過去N日高値・安値を指定することが可能です。
例:エントリーには55日の高値・安値のブレイクを用い、決済には20日高値・安値のブレイクを用いるなど。
使い方
このストラテジーは前述のインジケーターとほぼ同じ内容のラインを表示します。
過去N日、N週間、Nヶ月の高値・安値を表示でき、エントリーの条件として過去N日高値・安値を指定することができます。
過去N週・Nヶ月高値・安値ラインは利益確定の目安に用いるなど、皆さんが独自の手法を構築するときの参考として使ってください。
その他のパラメーターについては以下の詳細を参照ください。
パラメーター:
TP condition(利益確定条件):
“Pips(Pips指定)”, “When opposite entries(逆方向エントリー時)” or “Previous N days high low break(過去N日高値・安値)”から選択することができます。
“When opposite entries” を選択した場合、現在のポジションは、現在ポジションとは逆方向のエントリー条件が満たされた時に、決済されます。
例: ロングポジションはショートのエントリーが実行されると同時に決済される。
特定の過去N日高値・安値ブレイクを決済条件としたい場合は、“Previous N days high low break”を選択の上、該当するN日を”Previous N days High/Low for TP”の項目に入力してください。
SL condition(損切り基準):
“Pips(Pips指定)”、“Swing High/Low(スウィングハイ・ロー)”から選択することができます。
“Swing High/Low”選択時は、高値・安値決定に必要な左右のバーの本数を指定します。
注:TP、SL条件でPipsを選択した場合は、現時点では為替通貨ペアのみに機能します。
このストラテジーに最適の時間軸は?
当ストラテジーはスウィングトレードの手法となっているため、長期の時間軸が適しています。
為替のドルストレートペアでの結果を見てみると日足が最も適していますが、利益確定や損切り条件を調整することで、4時間足や1時間足向きにもアレンジできると思います。
上に示したストラテジーの例は、ドル円の日足における過去40年間以上でのバックテストの結果ですが、これだけの長期に渡って右上がりのエクイティカーブとともにプロフィットファクター2近くを維持するなど、かなり良い結果と言えるのではないでしょうか。
これは一つのシミュレーション結果に過ぎませんが、データを見る限りタートルの手法は現在でも機能すると言えるでしょう。

Donchian Trendline - Support Resistance Slope [UhoKang]// This is a strategy that draws a trend line in the form of a slope whenever the high point and low point are updated.
// The upper slope serves as a resistance line, and the lower slope serves as a support line.
// Buy when the of the candle crosses the slope

ATR Trend Run - Signals Alerts SL and TP by Tech Store OnThe script uses several ATR formulas for entering/exiting trades, support/resistance lines to take TP1 (take profit 1) and another ATR formula for TP2 (take profit 2). Everything is fully configurable to your preference, and you can back-test it via TradingView. You can also configure the indicator for signals during US trading sessions (with or without power hour), as well as taking profits/stop-loss session time(s), as well as to close a position at the end of the trading session no matter what. Also, you can turn all of that off, so there are no trading session/end of day limits and each trade will run until it either hits SL, TP1, TP1 > back to entry, TP2. Note: indicator is set to skip consecutive/opposite signals, while you currently have a trade open > if you hit a trend – ride it to the end!
For example: If you will be day trading SPY and you wish to close your positions no matter what right before the market closes (3:45PM ET > 15min before closes): Make sure to checkbox “Intraday – Close Position Before Market Closes” in the strategy/indicator Settings, so that you are alerted soon before the market closes, if you wish to continue holding the position – leave this checkbox unchecked.
SL: SL is set to be slightly above/below the signal candle, which is best suited for this strategy.
Strategy Take Profit Approach
While the initial position open and SL hit is always based on a closed candle bar (can’t do otherwise, as otherwise you will have 10s of fake signal alerts), there are 2 ways on trading this strategy in terms of TP1 and TP1 taken > back to Entry, which is based off Alert type.
You can switch this as you like within the indicator settings, “Checked: TP1 taken > back to Entry per Price Touch | Unchecked: per Candle Close”.
Candle Close vs Price Touch: with the Default method - Candle Close for an alert for TP1 or if price comes back to Entry after TP1 is taken will only be triggered once candle bar fully closes crossing the area, while Price Touch will alert when price touches the area before candle bar closes.
For example: your trade is running well, you grab TP1 and the price reverses and hits your trade Entry area. With Price Touch – you are immediately alerted to close your trade with no loss and with TP1 profit. With Candle Close - you will receive an alert only once candle bar fully closes on top of the Entry crossing it backwards, meaning it may lower your TP1 profit or even completely reverse the trade into loss in case it will be a huge candle bar for any reason. However, it may touch the Entry area, looking like the price is reversing, but then continue per initial trade direction, sometimes becoming a trend. So, while Price Touch seem like a more conservative approach, Candle Close can give you much bigger profits if you catch a trend, but you can always change it via the Settings.
Note: TradingView back-testing engine does not have a feature to open/close orders IMMEDIATELY via Price Touch trigger, but only when the candle closes after price touches the scripted area/line/etc., so you for the most accurate results, test your strategy out via Candle Close setting. Otherwise, decide yourself. I personally like more Candle Close since I can test it out via back-testing with the most accurate results.
TP2 is set per Candle Close as often the ATR trailing stop line will be hit and bounced off, so it’s best to wait until candle actually breaks it/closes through it.
Note: If you will be observing the strategy LIVE, during LIVE candle bar movement – it will look weird, like it’s placing an order after order during any trigger – this seem like a TradingView bug, but is only observational, once the candle bar is closed and you refresh TradingView it will all look correct.
Back-Testing
If you wish to do some back-testing, just modify the strategy/indicator Settings:
-----1) STRATEGY: This is for back-testing/experimenting with the script inputs.
----------a. You can setup a start date (date, month, year) from which it will start opening back-test trades, select a position size and select TP1 size, the idea here is to close half (or whatever you choose) portion of the trade once you hit your TP1, then to either close at small profit or to catch a trend and close the second portion of the position long way ahead from Entry, otherwise it will alert you to close the position at TP2, if price comes back to Entry, at reversal signal or at the end of US trading session if the option for it is checked. If you wish to close the whole position at TP1, just enter the same amount for TP1 to match backtest position size. Otherwise you can experiment with TP1 sizing – try it out!
-----2) Feel free to experiment with ATR settings and with S&R Left/Right bars, you may be amazed how results will differ and find some really cool combinations!
-----3) Make sure you select/de-select “Intraday – Close Position Before Market Closes” setting depending on what you are back-testing and on which conditions
-----4) Note: If you wish to do some deep back-testing (1+ years), use the “Deep Backtesting” feature within Strategy Tester on the TradingView as otherwise it may show wrong results or even fail to compute the results
Add the alerts
-----Right-click anywhere on the TradingView chart
-----Click on Add alert
-----Condition: ATR Trend Run - Signals Alerts SL and TP, by Tech Store On
----------o Right underneath the condition click on the drop-down menu and select “alert() function calls only”
-----Expiration time: Whatever you wish
-----Alert actions: Whatever notifications you wish
-----Alert name: DO NOT TOUCH THIS
-----Hit “Create”
-----Note: If you change ANY Settings within the indicator – you must DELETE the current alert and create a new one per steps above, otherwise it will continue triggering alerts per old Settings!
- Note: If you add the alert while the script is currently “In Position” it will not know that. So either wait when there will be no position open at all or close your position partially if the bot opens it twice bigger or so in case per script the bot will think it is already in position.
Note: Because of the slippage and the order processing time between TradingView, AutoView and the Broker (it’s usually about a second or so), it is suggested to not use a timeframe lower than 1min. The script is working really well with 1M/3M/5M/H1/H4 timeframes per my back-testing, but feel free to explore via Strategy Back-testing what’s best for the instrument you wish to trade.
If you wish to try this out for a week or so – please reach out and I will give you access.

MACD with Support and Resistance - Signals, Alerts, TP and SLMACD with Support and Resistance - Signals Alerts SL and TP by Tech Store On
The script uses MACD for entering/exiting trades and support/resistance lines to take TP1 (take profit 1). Both MACD and support/resistance lines are fully configurable to your preference, and you can back-test it via TradingView. Once TP1 is taken, you can either set the indicator to close the trade at the end of the US trading session day (4PM ET) or you can continue taking partial profits where you wish or just wait until reversal signal alert.
For example: If you will be day trading SPY and you wish to close your positions no matter what right before the market closes (3:45PM ET > 15min before closes): Make sure to checkbox “Intraday – Close Position Before Market Closes” in the strategy/indicator Settings, so that you are alerted soon before the market closes, if you wish to continue holding the position – leave this checkbox unchecked.
SL: SL is set to be slightly above/below the MACD signal candle, which is best suited for this strategy from manual backtesting.
Strategy Take Profit Approach
While the initial position open and SL hit is always based on a closed candle bar (can’t do otherwise, as otherwise you will have 10s of fake signal alerts), there are 2 ways on trading this strategy in terms of TP1 / TP1 taken > back to Entry, which is based off Alert type.
You can switch this as you like within the indicator settings, “Checked: TP1/TP1 taken > back to Entry per Price Touch | Unchecked: per Candle Close”.
Candle Close vs Price Touch: with the Default method - Candle Close for an alert for TP1 or if price comes back to Entry after TP1 is taken will only be triggered once candle bar fully closes crossing the area, while Price Touch will alert when price touches the area before candle bar closes.
For example: your trade is running well, you grab TP1 and the price reverses and hits your trade Entry area. With Price Touch – you are immediately alerted to close your trade with no loss and with TP1 profit. With Candle Close - you will receive an alert only once candle bar fully closes on top of the Entry crossing it backwards, meaning it may lower your TP1 profit or even completely reverse the trade into loss in case it will be a huge candle bar for any reason. However, it may touch the Entry area, looking like the price is reversing, but then continue per initial trade direction, sometimes becoming a trend. So, while Price Touch seem like a more conservative approach, Candle Close can give you much bigger profits if you catch a trend, but you can always change it via the Settings.
Note: TradingView back-testing engine does not have a feature to open/close orders IMMEDIATELY via Price Touch trigger, but only when the candle closes after price touches the scripted area/line/etc., so you for the most accurate results, test your strategy out via Candle Close setting. Otherwise, decide yourself. I personally like more Candle Close since I can test it out via back-testing with the most accurate results.
Note: If you will be observing the strategy LIVE, during LIVE candle bar movement – it will look weird, like it’s placing an order after order during any trigger – this seem like a TradingView bug, but is only observational, once the candle bar is closed and you refresh TradingView it will all look correct.
Back-Testing
If you wish to do some back-testing, just modify the strategy/indicator Settings:
-----1) STRATEGY: This is for back-testing/experimenting with the script inputs.
----------a. You can setup a start date (date, month, year) from which it will start opening back-test trades, select a position size and select TP1 size, the idea here is to close half (or whatever you choose) portion of the trade once you hit your TP1, then to either close at small profit or to catch a trend and close the second portion of the position long way ahead from Entry, otherwise it will alert you to close the position if price comes back to Entry, at reversal signal or at the end of US trading session if the option for it is checked. If you wish to close the whole position at TP1, just enter the same amount for TP1 to match backtest position size. Otherwise you can experiment with TP1 sizing – try it out!
-----2) Feel free to experiment with MACD settings and with S&R Left/Right bars, you may be amazed how results will differ and find some really cool combinations!
-----3) Make sure you select/de-select “Intraday – Close Position Before Market Closes” setting depending on what you are back-testing and on which conditions
-----4) Note: If you wish to do some deep back-testing (1+ years), use the “Deep Backtesting” feature within Strategy Tester on the TradingView as otherwise it may show wrong results or even fail to compute the results
Add the alerts
-----Right-click anywhere on the TradingView chart
-----Click on Add alert
-----Condition: MACD with Support and Resistance - Signals
----------o Right underneath the condition click on the drop-down menu and select “alert() function calls only”
-----Expiration time: Whatever you wish
-----Alert actions: Whatever notifications you wish
-----Alert name: DO NOT TOUCH THIS
-----Hit “Create”
-----Note: If you change ANY Settings within the indicator – you must DELETE the current alert and create a new one per steps above, otherwise it will continue triggering alerts per old Settings!
- Note: If you add the alert while the script is currently “In Position” it will not know that. So either wait when there will be no position open at all or close your position partially if the bot opens it twice bigger or so in case per script the bot will think it is already in position.
Note: Because of the slippage and the order processing time between TradingView, AutoView and the Broker (it’s usually about a second or so), it is suggested to not use a timeframe lower than 1min. The script is working really well with 15M/H1 timeframes per my back-testing, but feel free to explore via Strategy Back-testing what’s best for the instrument you wish to trade.

WilliamTrendFollower StrategyThis strategy is based on signals from the WilliamTrendFollower indicator.
You can optimize the parameters of this strategy as you wish. I hope you get the most accurate result.
About WilliamTrendFollower:
With this indicator, we try to catch the trends in price. With continued use of this indicator, we expect it to eventually escape horizontal positions and catch up with continuous trends.
Combined with the WilliamsR indicator and the exponential moving average indicator.
The WilliamsR Fisher Transforms are combined with the ATR indicator to create a line that lags behind the moving average value.
Since it is a tracking indicator, we created a line that is more connected to the price and itself.
In this way, a curve close to the price line is obtained in uptrends and downtrends.
In this indicator, if you choose the parameters correctly, you can easily bypass the horizontal positions. This gives you a safe visualization of support and resistance points as well.
From the settings of these indicators, you can set the multiplier and the exponential moving average period.
It works in all time intervals.
But it was calculated without volume , instead it was created using fisher transforms, moving averages, and the average true range .
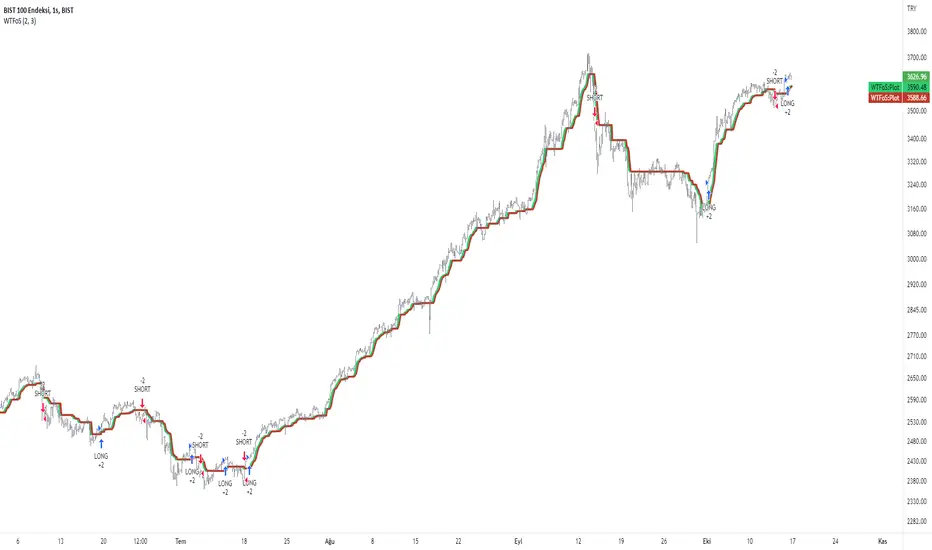
SUPPORT RESISTANCE STRATEGY [5MIN TF]A SUPPORT RESISTANCE BREAKOUT STRATEGY for 5 minute Time-Frame , that has the time condition for Indian Markets
The Timing can be changed to fit other markets, scroll down to "TIME CONDITION" to know more.
The commission is also included in the strategy .
The basic idea is when ,
1) Price crosses above Resistance Level ,indicated by Red Line, is a Long condition.
2) Price crosses below Support Level ,indicated by Green Line , is a Short condition.
3) Candle high crosses above ema1, is a part of the Long condition .
4) Candle low crosses below ema1, is a part of the Short condition .
5) Volume Threshold is an added confirmation for long/short positions.
6) Maximum Risk per trade for the intraday trade can be changed .
7) Default qty size is set to 50 contracts , which can be changed under settings → properties → order size.
8) ATR is used for trailing after entry, as mentioned in the inputs below.
// ═════════════════════════//
// ————————> INPUTS <————————— //
// ═════════════════════════//
→ L_Bars ———————————> Length of Resistance / Support Levels.
→ R_Bars ———————————> Length of Resistance / Support Levels.
→ Volume Break ———————> Volume Breakout from range to confirm Long/Short position.
→ Price Cross Ema —————> Added condition as explained above (3) and (4).
→ ATR LONG —————————> ATR stoploss trail for Long positions.
→ ATR SHORT ————————> ATR stoploss trail for Short positions.
→ RISK ————————————> Maximum Risk per trade intraday.
The strategy was back-tested on TCS ,the input values and the results are mentioned under "BACKTEST RESULTS" below.
// ═════════════════════════ //
// ————————> PROPERTIES<——————— //
// ═════════════════════════ //
Default_qty_size ————> 50 contracts , which can be changed under
Settings
↓
Properties
↓
Order size
// ═══════════════════════════════//
// ————————> TIME CONDITION <————————— //
// ═══════════════════════════════//
The time can be changed in the script , Add it → click on ' { } ' → Pine editor→ making it a copy [right top corner} → Edit the line 27.
The Indian Markets open at 9:15am and closes at 3:30pm.
The 'time_cond' specifies the time at which Entries should happen .
"Close All" function closes all the trades at 3pm , at the open of the next candle.
To change the time to close all trades , Go to Pine Editor → Edit the line 92 .
All open trades get closed at 3pm , because some brokers don't allow you to place fresh intraday orders after 3pm .
// ═══════════════════════════════════════════════ //
// ————————> BACKTEST RESULTS ( 100 CLOSED TRADES )<————————— //
// ═══════════════════════════════════════════════ //
INPUTS can be changed for better Back-Test results.
The strategy applied to NSE:TCS ( 5 min Time-Frame and contract size 50) gives us 60% profitability , as shown below
It was tested for a period a 6 months with a Profit Factor of 1.8 ,net Profit of 30,000 Rs profit .
Sharpe Ratio : 0.49
Sortino Ratio : 1.4
The graph has a Linear Curve with Consistent Profits.
The INPUTS are as follows,
1) L_Bars —————————> 4
2) R_Bars —————————> 4
3) Volume Break ————> 5
4) Price Cross Ema ——> 100
5) ATR LONG ——————> 2.4
6) ATR SHORT —————> 2.6
7) RISK —————————> 2000
8) Default qty size ——> 50
NSE:TCS
Save it to favorites.
Apply it to your charts Now !!
Thank You ☺ NSE:TCS

Range Strat - MACD/RSIThis strategy uses a trend based indicator (MACD) for entry/exit signals with a momentum oscillator (RSI) to act as confirmation. Although relying on a trend based indicator this has been created for range bound crypto markets, which have been in a period of chop since June 2022.
Long/Short signals are generated from MACD with the RSI oscillator thresholds suppressing entries at price extremes. This is not a mean reversion RSI strategy! As the indicators are contrary to each other you will need to be generous with the RSI settings in order for signals to trigger.
Strategy is designed for use on the 4h timeframe, it may work well on higher timeframes, but lower time frames will lead to false signals. Use fixed percentage of equity for order size to capture the compounding effect. As a reversal strategy bear in mind that should market trend strongly in either direction stops will be required.
The RSI thresholds can be tailored to provide higher frequency or safer signals. Similarly tweaking MACD settings will provide earlier/more frequent or safer signals. As this is intended to enter near range high / low you should check the visual cues to ensure a ping-pong effect is observed, so that peaks and troughs are captured. Once an observable range is established the strategy works well across a range of crypto markets,
The script is open source, so feel free to amend as you wish. Using a different momentum oscillator may provide better results. I have prior coding experience, but first time using PineScript was last night, so it's not very tidy. I will update this with some additional customisation and TP/SL in the near future.
Usage: Range bound markets
Markets: Cryptocurrency Alts/BTC/ETH
Timeframe: 4h

RSI Improved strategySet a Horizontal Ray at the price that relates highest / lowest RSI .
It 's more clear to decide when to open long / short position manually.
It's a scalping strategy that works in 15min chart(basically works in most of timeframe , if you don't look it as a scalping strategy), when RSI hits Highest / Lowest value , the strategy will open a Long / Short position.
The Default Risk Reward Ratio was 1 (1600 points : 1600 points) you can adjust it in settings
You guys can look it as a RSI alert indicator
Think before you do , use it wisely. Thanks a lot!
There is a lot of useless words in Pine if you wanna look it please ignore it.
