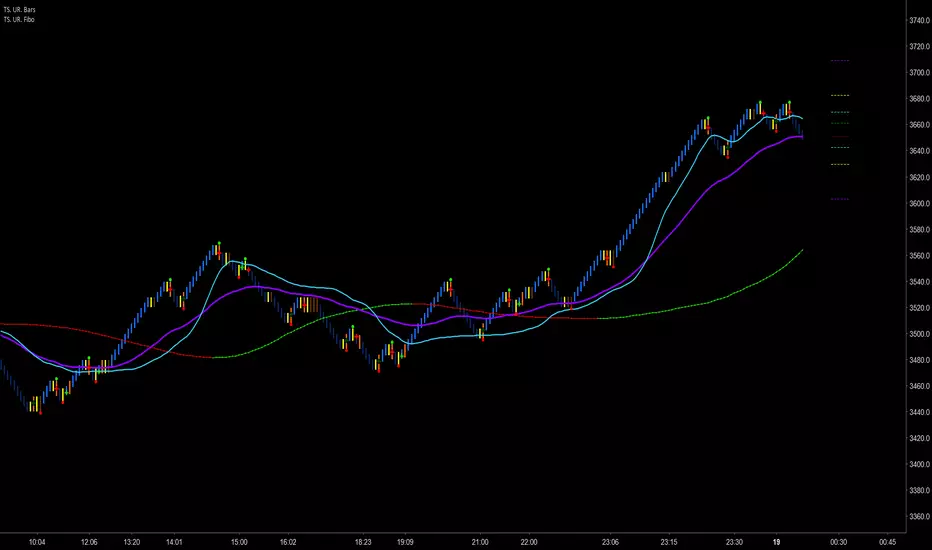
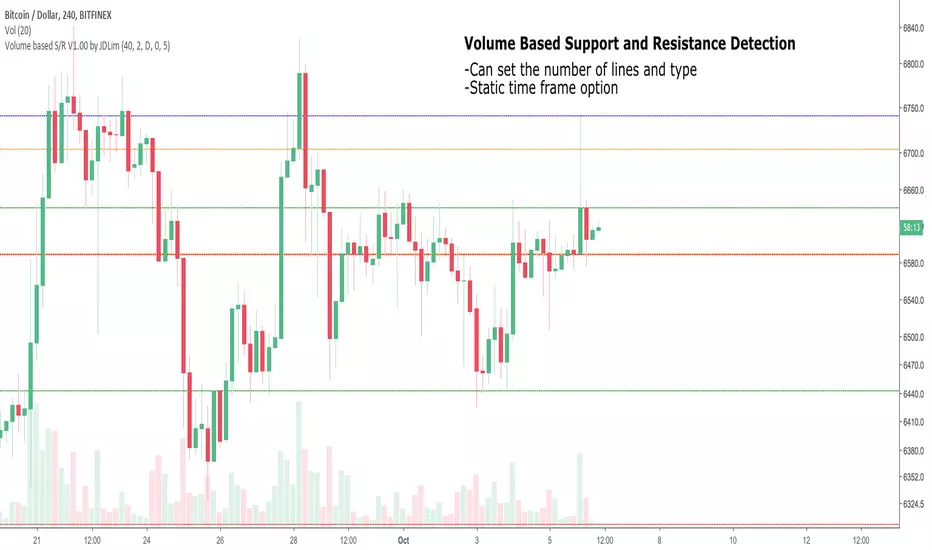
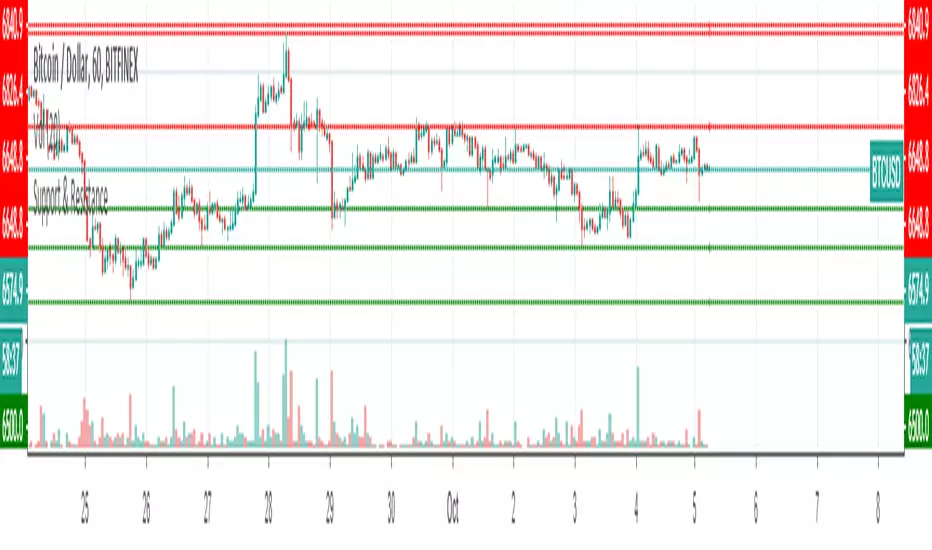
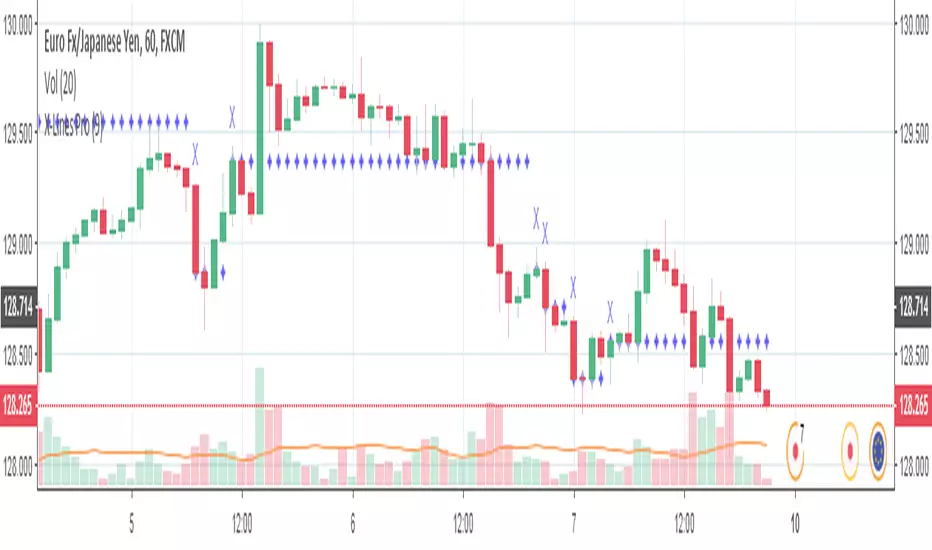
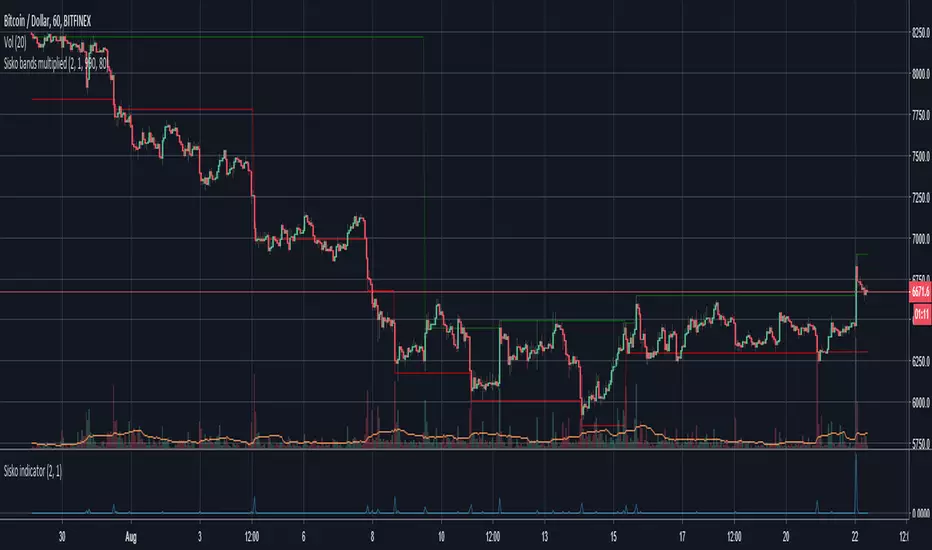
By request, some more of the levels that I like to see. I find that this works well on gold and crude oil the best. Stocks and ETF's sometimes have weird bars in after hours, and this sometimes destroys the week's levels. Any non liquid jump and back bars will likely not be tolerated by the study and ruin its data. The indexes sometimes work, but I find that...
The Swing indicator will plot dot lines that represent the swing points based on the swing length input(number of bars to the left and right of the swing point). Swing highs and lows can be used by traders to identify possible areas of support and resistance, which can then be used to determine optimal positions for stop-loss or profit target orders. If an...
For my second share, I give you some levels I look at everyday for the ES minis. HLC/3 of the MTF (multi-time-frame) inputs = mean and Fib-levels formed as support and resistance zones. There are some websites that will show you 20 ways to figure out a pivot for the day's intraday workings, and this one always rang true for me. I keep it set at Res=D and...
Same script as the previous version with a slight twist Have added (lines) "Transparency" to the settings to avoid having to edit every line individually ... Cheers
Fairly simple script that automatically draws highs and lows for the past X periods at various intervals. 3 Settings : "Sensitivity" which amounts to the horizontal separation from one high to the next high (default multiplicator : 10) Variable "b" which is the HEX color for resistances (default : red) Variable "c" which is the HEX color for supports (default :...
Description: High and Low Envelope channel with median line and 'sigma' offsets to try and encapsulate price flow and quickly locate likely areas of support and resistance on the fly.
Previous High low plotting. COPIED from Chris Moody's script and adjusted it for my needs.
EXPERIMENTAL: Request for oct15joe: SR lvls preliminary version
The base of the indicator is the breakout of historic High and lows. There are 3 basic configurations 1° The High length that measure the latest 10 bars and make the "higher high" 2° The Low length taht measure the latest 10 bars and make the "lower low" 3° The Breakout PIPs administrator that defines how much pips are needed from the latest higher high to be...
Uses daily average ranges of 5 and 10 (most used) as buy (support) and highs (resistance) areas - half ranges used in calculations for a more accurate "forecast" of the H and L . Uses open but not close, so it does not repaint - experimental
EXPERIMENTAL: Request for: MarxBabu changed gap detection method. added previous close line
Overlays the Average True Range high/low over Price. Shifts between support and resistance levels (based on ATR-21) according to price trend and breaks. Average true range: en.wikipedia.org @EmpoweredTrader
Moving average of High, Low & Close with Fibonacci bands calculated from the average high and low. Four upper levels are to the power of 1.618, 2.618, 3.618 & 4.618. Four lower levels are to the power of 0.618, 1.618, 2.618 & 3.618. Included are a choice of time frames either current, semi-custom or fully custom allowing freedom to set any period you like which...
Support and Resistance using donchian channels to validate tops/bottoms (note: while donchians follow price closely within look back window, this will only update new top/bottom when making new extremes in the donchian channel) combo with other systems:
this indicator is for use with the Rejection Spike Strategy I recently publish Have't had chance to test it yet so feel free to try. Details of the strategy are listed in the link below
Wave Channel 3D Built by Ricardo idea from JR & Aloakdutt from indieTrades Jan. 2010 This indicator is very easy to build. We utilize Moving Averages with a set multiplier and an offset. Specially we try to use Fibonacci sequence series numbers (1, 2, 3, 5, 8, 13, 21, 34, 55, 89, 144...) as time space and multiplier (default 89, 8). Also included is Donchian...
Decided to repost to get clean chart up. This gives you lines showing the current years highs and lows along with the previous years high and lows. Requested by "N"