Double Top/Bottom - UltimateHellow traders, this is my final script regarding double top/bottom pattern recognition. This script is built based on zig zag indicator whereas the previous ones are built based on pivot points.
Double Top:
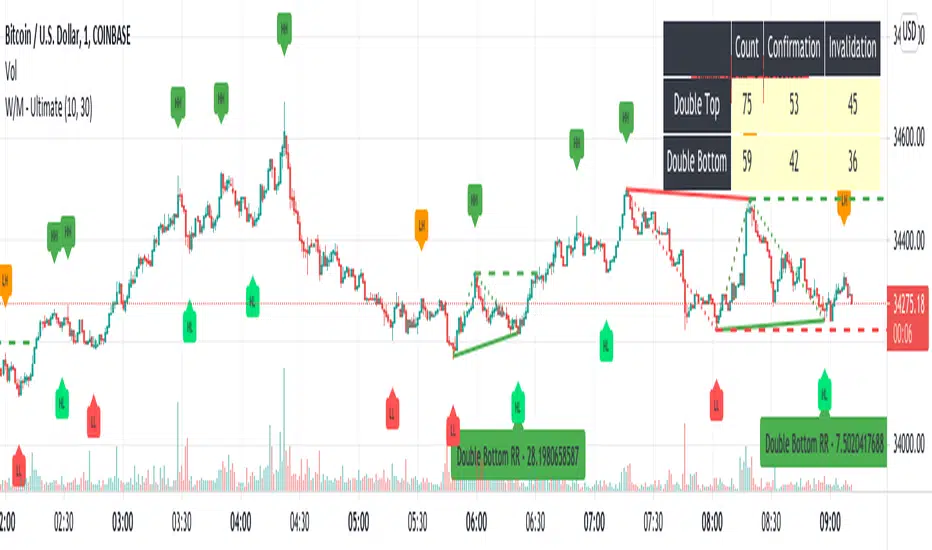
Recognition - Checks on Zigzag if LH is followed by HH
Confirmation - When low crosses under last lower pivot point on zigzag
Invalidation - When high crosses over HH
Double Bottom:
Recognition - Checks on Zigzag if HL is followed by LL
Confirmation - When high crosses over last higher pivot point on zigzag
Invalidation - When low crosses under LL
Few major changes in this version compared to previous ones:
Zigzag offers more simplicity in deriving the pattern and also enahnces accuracy. Things such as pivot distance, absolute peaks are removed as they are redundant.
Option to display risk per reward which defines how steep is the W-M triangle. This is simply the ratio of price difference between mid point to top most and bottom most points. In case of double top, downside is considered as reward and upside is considered as risk and with double bottom, downside is considered as risk and upside is considered as reward. Lower risk per reward signifies better trade.
Option to display stats which shows number of occurances of double top and bottom and how many times price crossed confirmation point and invalidation point (which are also marked with dashed lines) Stats are color coded. Higher success rates are colored in shades of green, lower success rates are colored in shades of orange whereas the neutral success rates are coloed in light yellow.
Example of stat shown in Neutral shade. I could not find any instrument which had confirmation rate less than 0.4 - which suggests confirmation rate for the patter is pretty strong:
Links for the other two scripts are here:
Successrate
Logistic RSI, STOCH, ROC, AO, ... by DGTExperimental attemt of applying Logistic Map Equation for some of widly used indicators.
With this study "Awesome Oscillator (AO)", "Rate of Change (ROC)", "Relative Strength Index (RSI)", "Stochastic (STOCH)" and a custom interpretation of Logistic Map Equation is presented
Calculations with Logistic Map Equation makes sense when the calculated results are iterated many times within the same equation.
Here is the Logistic Map Equation : Xn+1 = r * Xn * (1 - Xn)
Where, the value of r is the key for this equation which changes amazingly the behaviour of the Logistic Map.
The value we have asigned for r is less then 1 and greater than 0 ( 0 < r < 1) and in this case the iterations performed with the maximum number of output series allowed by Pine is quite enough for our purpose and thanks to arrays we can easiliy store them for further processing
What we have as output:
Each iteration result is then plotted (excluding plotting the first iteration), as circles or line based on user preference
Values above and below zero level (0) are coloured differently to emphasis bull and bear power
Finally Standard Deviation of Array's Elements is ploted as line. Users may choose to display this line only
So where it comes the indicators "Awesome Oscillator (AO)", "Rate of Change (ROC)", "Relative Strength Index (RSI)", "Stochastic (STOCH)".
Those are the indicators whose values are assigned to our key varaiable in the Logistic Map equation forulma which is r
Further details regarding Logistic Map can found under the description of “Logistic EMA w/ Signals by DGT” study
Disclaimer:
Trading success is all about following your trading strategy and the indicators should fit within your trading strategy, and not to be traded upon solely
The script is for informational and educational purposes only. Use of the script does not constitute professional and/or financial advice. You alone have the sole responsibility of evaluating the script output and risks associated with the use of the script. In exchange for using the script, you agree not to hold dgtrd TradingView user liable for any possible claim for damages arising from any decision you make based on use of the script
