🐬Stochastic_RSIStochastic RSI
The indicator highlights the chart background for two specific signals:
- A bearish deadcross occurring above the upper band.
- A bullish goldencross occurring below the lower band.
-----
스토캐스틱 RSI
두가지 신호를 배경색으로 나타냅니다.
- 어퍼 밴드 위에서의 데드크로스
- 로우어 밴드 아래에서의 골든크로스
-----
스토캐스틱 RSI (STOCH RSI)

Alt buy signal 1H Entry + 4H Confirm (MACD + Stoch RSI + HMA)This indicator is a multi-timeframe (MTF) analysis tool designed for the ALT trading , capturing entry signals on the 1-hour (1H) timeframe and confirming trends on the 4-hour (4H) timeframe. It combines MACD, Stoch RSI, and Hull Moving Average (HMA) to identify precise buy opportunities, particularly at reversal points after a downtrend or during trend shifts. It visually marks both past and current BUY signals for easy reference.
Key Features:
1H Entry Signal (Early Ping): Triggers on a MACD golden cross (below 0) combined with a Stoch RSI oversold cross (below 20), offering an initial buy opportunity.
4H Trend Confirmation (Entry Ready): Validates the trend with a 4H MACD histogram rising (in negative territory) or a golden cross, plus a Stoch RSI turn-up (above 30).
Past BUY Display: Labels past data points where these conditions were met as "1H BUY" or "FULL BUY," facilitating backtesting.
HMA Filter: Optional HMA(16) to confirm price breakouts, enhancing trend validation.
Purpose: Ideal for short-term scalping and swing trading. Supports a two-step strategy: initial partial entry on 1H signals, followed by additional entry on 4H confirmation.
Usage Instructions
Installation: Add the indicator to an IMX/USDT 1H chart on TradingView.
Signal Interpretation:
lime "1H BUY": 1H conditions met, consider initial entry (stop-loss: 3-5% below recent low).
green "FULL BUY": 1H+4H conditions met, confirm trend for additional entry (take-profit: 10% below recent swing high).
Customization: Adjust TF (1H/4H), MACD/Stoch RSI parameters, and HMA usage via the input settings.
Alert Setup: Enable alerts for "ENTRY READY" (1H+4H) or "EARLY PING" (1H only) conditions.
Advantages
Accuracy: Reduces false signals by combining MACD golden cross below 0 with Stoch RSI oversold conditions.
Dual Confirmation: 1H for quick timing and 4H for trend validation, improving risk management.
Visualization: Past BUY points enable easy backtesting and pattern recognition.
Flexibility: 4H confirmation mode adjustable (histogram rise or golden cross).
Limitations
Timeframe Dependency: Optimized for 1H charts; may not work on other timeframes.
Market Conditions: Potential whipsaws in sideways markets; additional filters (e.g., RSI > 50) recommended.
Manual Management: Stop-loss and take-profit require user discretion.

AI Trading Alerts v6 — SL/TP + Confidence + Panel (Fixed)Overview
This Pine Script is designed to identify high-probability trading opportunities in Forex, commodities, and crypto markets. It combines EMA trend filters, RSI, and Stochastic RSI, with automatic stop-loss (SL) & take-profit (TP) suggestions, and provides a confidence panel to quickly assess the trade setup strength.
It also includes TradingView alert conditions so you can set up notifications for Long/Short setups and EMA crosses.
⚙️ Features
EMA Trend Filter
Uses EMA 50, 100, 200 for trend confirmation.
Bull trend = EMA50 > EMA100 > EMA200
Bear trend = EMA50 < EMA100 < EMA200
RSI Filter
Bullish trades require RSI > 50
Bearish trades require RSI < 50
Stochastic RSI Filter
Prevents entries during overbought/oversold extremes.
Bullish entry only if %K and %D < 80
Bearish entry only if %K and %D > 20
EMA Proximity Check
Price must be near EMA50 (within ATR × adjustable multiplier).
Signals
Continuation Signals:
Long if all bullish conditions align.
Short if all bearish conditions align.
Cross Events:
Long Cross when price crosses above EMA50 in bull trend.
Short Cross when price crosses below EMA50 in bear trend.
Automatic SL/TP Suggestions
SL size adjusts depending on asset:
Gold/Silver (XAU/XAG): 5 pts
Bitcoin/Ethereum: 100 pts
FX pairs (default): 20 pts
TP = SL × Risk:Reward ratio (default 1:2).
Confidence Score (0–4)
Based on conditions met (trend, RSI, Stoch, EMA proximity).
Labels:
Strongest (4/4)
Strong (3/4)
Medium (2/4)
Low (1/4)
Visual Panel on Chart
Shows ✅/❌ for each condition (trend, RSI, Stoch, EMA proximity, signal now).
Confidence row with color-coded strength.
Alerts
Long Setup
Short Setup
Long Cross
Short Cross
🖥️ How to Use
1. Add the Script
Open TradingView → Pine Editor.
Paste the full script.
Click Add to chart.
Save as "AI Trading Alerts v6 — SL/TP + Confidence + Panel".
2. Configure Inputs
EMA Lengths: Default 50/100/200 (works well for swing trading).
RSI Length: 14 (standard).
Stochastic Length/K/D: Default 14/3/3.
Risk:Reward Ratio: Default 2.0 (can change to 1.5, 3.0, etc.).
EMA Proximity Threshold: Default 0.20 × ATR (adjust to be stricter/looser).
3. Read the Panel
Top-right of chart, you’ll see ✅ or ❌ for:
Trend → Are EMAs aligned?
RSI → Above 50 (bull) or below 50 (bear)?
Stoch OK → Not extreme?
Near EMA50 → Close enough to EMA50?
Above/Below OK → Price position vs. EMA50 matches trend?
Signal Now → Entry triggered?
Confidence row:
🟢 Green = Strongest
🟩 Light green = Strong
🟧 Orange = Medium
🟨 Yellow = Low
⬜ Gray = None
4. Alerts Setup
Go to TradingView Alerts (⏰ icon).
Choose the script under “Condition”.
Select alert type:
Long Setup
Short Setup
Long Cross
Short Cross
Set notification method (popup, sound, email, mobile).
Click Create.
Now TradingView will notify you automatically when signals appear.
5. Example Workflow
Wait for Confidence = Strong/Strongest.
Check if market session supports volatility (e.g., XAU in London/NY).
Review SL/TP suggestions:
Long → Entry: current price, SL: close - risk_pts, TP: close + risk_pts × RR.
Short → Entry: current price, SL: close + risk_pts, TP: close - risk_pts × RR.
Adjust based on your own price action analysis.
📊 Best Practices
Use on H1 + D1 combo → align higher timeframe bias with intraday entries.
Risk only 1–2% of account per trade (position sizing required).
Filter with market sessions (Asia, Europe, US).
Strongest signals work best with trending pairs (e.g., XAUUSD, USDJPY, BTCUSD).

Multi-Timeframe Stochastic RSI Momentum MatrixThis indicator gives you a "bigger picture" view of a stock's momentum by showing you the Daily, Weekly, and Monthly Stoch RSI all in one place. It helps answer two key questions: "Where is the price going?" and "When might things change?". The results of this indicator are presented in a table for easy viewing.
What the Columns Mean:
Stoch RSI : The main momentum score. Red means "overbought" (momentum is high and might be getting tired), and green means "oversold" (momentum is low and might be ready to bounce).
Price for OB/OS : This shows you the approximate price the stock needs to hit to become overbought or oversold.
- (Hist) means the target is a real price that happened recently.
- (Pred) means the price has exceeded the historical momentum boundary at which was oversold or overbough so the indicator has to predict a new target instead of leveraging a historical target.
Key Anchor Reset In : Think of this as a simple countdown. It tells you how many bars (days, weeks, etc.) are left until a key old price is dropped from the indicator's memory. When this countdown hits zero, it can cause a sharp change in the momentum reading, giving you a "heads-up" for a potential shift.
If you're interested in more technical details, read below:
I have leveraged a quantitative framework for analyzing the temporal dynamics of the Stochastic RSI across multiple timeframes (Daily, Weekly, Monthly). It functions as a correlational matrix, designed to move beyond simple overbought/oversold signals by providing contextual and data-driven targets in both price and time.
The matrix computes two primary sets of forward-looking data points:
Price Targets : A hybrid model is employed to determine the price required to push the StochRSI oscillator into an extreme state.
- Historical Anchor (Hist) : This is the primary/default method. It identifies the
deterministic close price within the lookback period that corresponds to the highest (or
lowest) RSI value. This represents a concrete and historically-defined momentum boundary.
- Predictive Heuristic (Pred) : In instances where the current price has invalidated this
historical anchor (i.e., the market is in a state of momentum expansion), the model
switches to a predictive heuristic. It calculates the recent price-to-RSI volatility ratio and
extrapolates the approximate price movement required to achieve an overbought or
oversold state.
Temporal Targets ("Key Anchor Reset In") : This metric provides a temporal forecast. It identifies the highest and lowest RSI values currently anchoring the Stochastic calculation and determines the number of bars remaining until these key data points are excluded from the lookback window. The roll-off of these anchors can precede a significant, non-linear reset in the oscillator's value, thus serving as a leading indicator for a potential momentum state-shift.
Disclaimer : This tool is a derivative of historical price action and should be used for quantitative analysis of momentum states, not as an oracle. The "predictive" components are heuristic extrapolations based on recent volatility and momentum characteristics and they are probabilistic in nature and do not account for exogenous market variables or fundamental shifts. All outputs are contingent on the continuation of the ticker's current momentum profile.

Mean Reversion Probability Zones [BigBeluga]🔵 OVERVIEW
The Mean Reversion Probability Zones indicator measures the likelihood of price reverting back toward its mean . By analyzing oscillator dynamics (RSI, MFI, or Stochastic), it calculates probability zones both above and below the oscillator. These zones are visualized as histograms, colored regions on the main chart, and a compact dashboard, helping traders spot when the market is statistically stretched and more likely to revert.
🔵 CONCEPTS
Mean Reversion : The tendency of price to return to its average after significant extensions.
Oscillator-Based Analysis : Uses RSI, MFI, or Stochastic as the base signal for detecting overextension.
Probability Model : The probability of reversion is computed using three factors:
Whether the oscillator is rising or declining.
Whether the oscillator is above or below user-defined thresholds.
The oscillator’s actual value (distance from equilibrium).
Dual-Zone Output :
Upper histogram = probability of downward mean reversion.
Lower histogram = probability of upward mean reversion.
Historical Extremes : The dashboard highlights the recent maximum probability values for both upward and downward scenarios.
🔵 FEATURES
Oscillator Choice : Switch between RSI, MFI, and Stochastic.
Customizable Zones : User-defined upper/lower thresholds with independent colors.
Probability Histograms :
Above oscillator → down reversion probability.
Below oscillator → up reversion probability.
Colored Gradient Zones on Chart : Visual overlays showing where mean reversion probabilities are strongest.
Probability Labels : Percentages displayed next to histogram values for clarity.
Dashboard : Compact table in the corner showing the recent maximum probabilities for both upward and downward mean reversion.
Overlay Compatibility : Works in both chart pane and sub-pane with oscillators.
🔵 HOW TO USE
Set Oscillator : Choose RSI, MFI, or Stochastic depending on your strategy style.
Adjust Zones : Define upper/lower bounds for when oscillator values indicate strong overbought/oversold conditions.
Interpret Histograms :
Orange (upper) histogram → higher chance of a pullback/downward mean reversion.
Green (lower) histogram → higher chance of upward reversion/bounce.
Watch Gradient Zones : On the main chart, shaded areas highlight where probability of mean reversion is elevated.
Consult Dashboard : Use the “Recent MAX” values to understand how strong recent reversion probabilities have been in either direction.
Confluence Strategy : Combine with support/resistance, order flow, or trend filters to avoid counter-trend trades.
🔵 CONCLUSION
The Mean Reversion Probability Zones provides traders with an advanced way to quantify and visualize mean reversion opportunities. By blending oscillator momentum, threshold logic, and probability calculations, it highlights when markets are statistically stretched and primed for reversal. Whether you are a contrarian trader or simply looking for exhaustion signals to fade, this tool helps bring structure and clarity to mean reversion setups.

FlowSpike ES — BB • RSI • VWAP + AVWAP + News MuteThis indicator is purpose-built for E-mini S&P 500 (ES) futures traders, combining volatility bands, momentum filters, and session-anchored levels into a streamlined tool for intraday execution.
Key Features:
• ES-Tuned Presets
Automatically optimized settings for scalping (1–2m), daytrading (5m), and swing trading (15–60m) timeframes.
• Bollinger Band & RSI Signals
Entry signals trigger only at statistically significant extremes, with RSI filters to reduce false moves.
• VWAP & Anchored VWAPs
Session VWAP plus anchored VWAPs (RTH open, weekly, monthly, and custom) provide high-confidence reference levels used by professional order-flow traders.
• Volatility Filter (ATR in ticks)
Ensures signals are only shown when the ES is moving enough to offer tradable edges.
• News-Time Mute
Suppresses signals around scheduled economic releases (customizable windows in ET), helping traders avoid whipsaw conditions.
• Clean Alerts
Long/short alerts are generated only when all conditions align, with optional bar-close confirmation.
Why It’s Tailored for ES Futures:
• Designed around ES tick size (0.25) and volatility structure.
• Session settings respect RTH hours (09:30–16:00 ET), the period where most liquidity and institutional flows concentrate.
• ATR thresholds and RSI bands are pre-tuned for ES market behavior, reducing the need for manual optimization.
⸻
This is not a generic indicator—it’s a futures-focused tool created to align with the way ES trades day after day. Whether you scalp the open, manage intraday swings, or align to weekly/monthly anchored flows, FlowSpike ES gives you a clear, rules-based signal framework.

Slingshot System By Dusty InvestmentsSlingshot System by Dusty Investments
What it is
A trend-following pullback system designed to time entries inside an established trend using a two-EMA “cloud” plus a Stochastic-RSI K oscillator.
It's the improved version of this script:
It plots:
An EMA cloud (trend and pullback filter)
Long/Short setup markers
“TAKE PROFIT” markers based on the oscillator
Core building blocks
Trend filter (EMA Cloud)
Fast EMA vs Slow EMA
Uptrend: Fast EMA > Slow EMA
Downtrend: Fast EMA < Slow EMA
The area between the two EMAs is filled (the “cloud”).
Cloud touch
The system requires price to touch/pierce the cloud with a small tolerance (configurable) to qualify a pullback.
Oscillator
K is a smoothed Stochastic of RSI (StochRSI K).
Oversold/Overbought levels default to 20/80, with a small tolerance kTol to avoid edge flicker.
Long logic (pullbacks within uptrend)
Purpose: Catch a second, “higher” dip during an uptrend.
Steps:
Candidate V1: While in uptrend, if K ≤ Oversold and price touches the EMA cloud, a V1 candidate is stored (the first dip).
Deal lock: When K later reaches ≥ Overbought in uptrend, the last V1 candidate is “locked in” as V1 for this cycle.
V2 search: After the lock, if another pullback appears (still in uptrend, K ≤ Oversold, price touching the cloud) and the low stays strictly above V1’s low, the script starts searching for the best V2 low (the lowest low of this second dip that remains above V1’s low).
Long signal: When K exits the oversold area, if a valid V2 was found above V1’s low, the indicator places a LONG label at that V2 low.
Take profit for Long: The “TAKE PROFIT” marker is shown when K crosses up through the Overbought level (≥ 80 by default).
Short logic (pullbacks within downtrend)
Purpose: Catch lower‑high pullbacks during a downtrend. The workflow is explicit and labeled:
D1 (first anchor): In downtrend, when price touches the cloud and K ≥ Overbought, mark D1 (the first high).
Valley: The first time K reaches ≤ Oversold after D1.
D2 (setup high): After the valley, the first bar that again touches the cloud with K ≥ Overbought and makes a strict Lower High vs D1 becomes D2. This opens a “window.”
Signal (live): From D2 until confirmation, the Signal marker follows the most recent swing high that forms on downtrend bars. It never tracks uptrend bars.
Confirmation: The first time K reaches ≤ Oversold after D2, the Signal is fixed at the last tracked high. From here the system waits for TP.
Take profit for Short: The “TAKE PROFIT” marker is shown when K crosses back above the Overbought level (≥ 80 by default).
Chaining (New D1): At TP, the prior D2 is promoted to “New D1,” allowing the next cycle to form if conditions repeat (D1 → Valley → D2).
What the labels mean
LONG: A validated long setup at the V2 low (second dip above the first dip’s low) within an uptrend.
SHORT: The live Short entry marker that moves to the latest downtrend swing high between D2 and confirmation; it gets fixed when K hits ≤ Oversold.
TAKE PROFIT: Suggestive exit markers tied to the K oscillator (Long TP when K crosses up 80; Short TP when K crosses up 80 after a Short confirmation).
Strict constraints baked in
No signals against the trend
Fast EMA / Slow EMA periods (trend and cloud)
RSI period for the StochRSI, Stochastic period, and K smoothing
Oversold/Overbought levels (defaults 20/80)
Cloud touch tolerance (percent)
kTol: tolerance around 20/80 thresholds for K
How to use it
Pick your market and use the 4H timeframe since you get the best results this way.
Trade with the trend:
Uptrend: Watch for LONG markers (V1 then V2 higher‑low behavior).
Downtrend: Watch the D1 → Valley → D2 sequence. The Signal marker appears after D2 and is fixed at confirmation; TP comes on K > 80.
Calibrate touchTolPct and kTol per symbol/timeframe to match how tightly you want to require cloud touches and K thresholds.
Risk management is up to you. The indicator outputs entries and TP suggestions; it does not set stops.
Notes
Signals confirm at bar close. During a Short window, the live Signal may move to newer downtrend highs; once confirmed, it becomes fixed.
The LONG side is symmetrical in spirit (pullback‑then‑higher‑low in uptrend), but naming uses V1/V2 instead of D1/D2.

Sling Shot System By LorinThis script uses the Sling Shot System to draw a cloud of Fast EMA of 38 and Slow EMA of 62, a cloud where most of the pullbacks go to. Together with the Stochastic RSI it draws long and short signals:
1. Longs:
when the RSI is bellow 20.
when the candle has touched the cloud on close.
when the price is forming a higher low, meaning its higher then the last time these conditions were met.
when the price is the uptrend, meaning the cloud is green.
2. Shorts:
when the RSI is above 80.
when the candle has touched the cloud on close.
when the price is forming a lower low, meaning its lower then the last time these conditions were met.
when the price is in the downtrend, meaning the cloud is red.

MTF Stochastic Range FinderThis indicator compares Stochastic RSI from 2 timeframes to signal possible reversals. Default 5 minute and 2 minute. Both Stochastic RSIs are customizable.
Allows for 6 support/resistance lines and allows a tolerance to filter proximity to levels for entry.
Can filter price level by manual support/resistance levels and/or VWAP

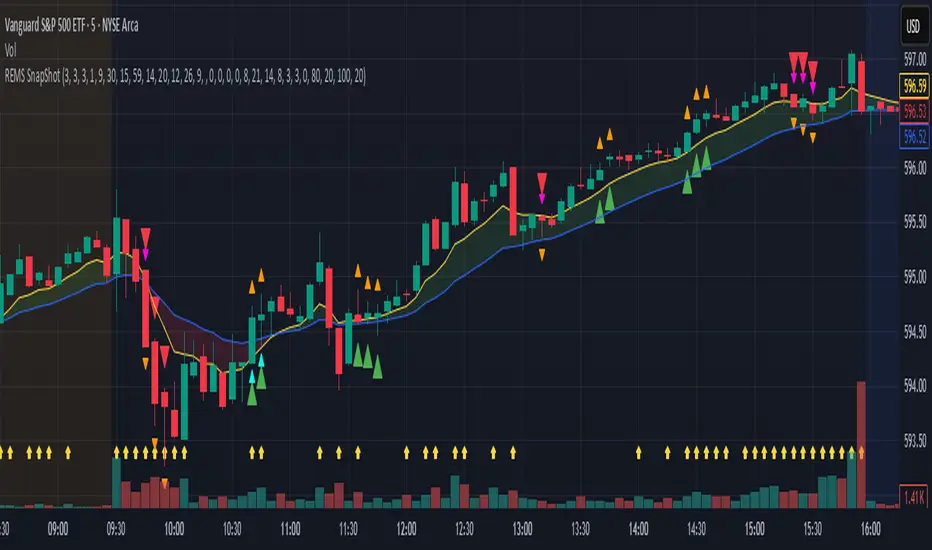
REMS Snap Shot OverlayThe REMS Snap Shot indicator is a multi-factor, confluence-based system that combines momentum (RSI, Stochastic RSI), trend (EMA, MACD), and optional filters (volume, MACD histogram, session time) to identify high-probability trade setups. Signals are only triggered when all enabled conditions align, giving the trader a filtered, visually clear entry signal.
This indicator uses an optional 'look-back' feature where in it will signal an entry based on the recency of specified cross events.
To use the indicator, select which technical indicators you wish to filter, the session you wish to apply (default is 9:30am - 4pm EST, based on your chart time settings), and if which cross events you wish to trigger a reset on the cooldown.
The default settings filter the 4 major technical indicators (RSI, EMAs, MACD, Stochastic RSI) but optional filters exist to further fine tune Stochastic Range, MACD momentum and strength, and volume, with optional visual cues for MACD position, Stochastic RSI position, and volume.
EMAs can be drawn on the chart from this indicator with optional shaded background.
This indicator is an alternative to REMS First Strike, which uses a recency filter instead of a cool down.
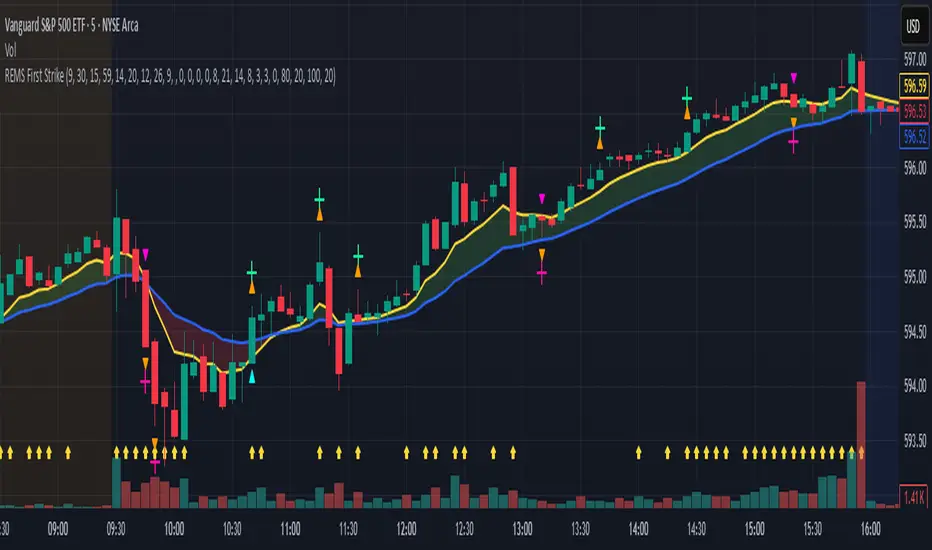
REMS First Strike OverlayThe REMS First Strike indicator is a multi-factor, confluence-based system that combines momentum (RSI, Stochastic RSI), trend (EMA, MACD), and optional filters (volume, MACD histogram, session time) to identify high-probability trade setups. Signals are only triggered when all enabled conditions align, giving the trader a filtered, visually clear entry signal.
This indicator uses an optional 'cool down' feature where in it will signal an entry only after any of the specified cross events occur.
To use the indicator, select which technical indicators you wish to filter, the session you wish to apply (default is 9:30am - 4pm EST, based on your chart time settings), and if which cross events you wish to trigger a reset on the cooldown.
The default settings filter the 4 major technical indicators (RSI, EMAs, MACD, Stochastic RSI) but optional filters exist to further fine tune Stochastic Range, MACD momentum and strength, and volume, with optional visual cues for MACD position, Stochastic RSI position, and volume.
EMAs can be drawn on the chart from this indicator with optional shaded background.
This indicator is an alternative to REMS Snap Shot, which uses a recency filter instead of a cool down.
Penguin Trend with RSI on DiffVisualizes volatility regime via the percent spread between the upper Bollinger Band and the upper Keltner Channel, with bar colors from a lightweight trend engine and an RSI computed on the Diff signal. Supports SMA/EMA/WMA/RMA/HMA/VWMA/VWAP and an optional calculation timeframe. Defaults preserve the original look and behavior.
Penguin Trend with RSI on Diff shows expansion vs. compression in price action by comparing two classic volatility envelopes. It computes:
Diff% = (UpperBB − UpperKC) / UpperKC × 100
• Diff > 0: Bollinger Bands are wider than Keltner Channels → expansion / momentum regime
• Diff < 0: BB narrower than KC → compression / squeeze regime
A white “Average Diff” line smooths Diff% (default: SMA(5)) to highlight regime shifts. Bars are colored only when Diff > 0 to focus on expansion phases. A lightweight trend engine defines four states from a fast/slow MA bias and a short “thrust” MA on ohlc4:
• Green: Bullish bias and thrust > fast MA (healthy upside thrust)
• Red: Bearish bias and thrust < fast MA (healthy downside thrust)
• Yellow: Bullish bias but thrust ≤ fast MA (pullback/weakness)
• Blue: Bearish bias but thrust ≥ fast MA (bear rally/short squeeze)
RSI on Diff:
The indicator adds an RSI applied to Diff% to gauge momentum of the expansion/compression signal itself. Choose between Built-in RSI or a manual RMA-based computation, and optionally smooth it. Default OB/OS lines are 70/30.
How it works:
• Bollinger Bands (BB): Basis = selected MA of src (default SMA(20)); Width = StdDev × Mult (default 2.0)
• Keltner Channels (KC): Basis = selected MA of src (default SMA(20)); Width = ATR(kcATR) × Mult (defaults 20 and 2.0)
• Diff%: Safe division guards against division-by-zero
• MA engine: Select SMA / EMA / WMA / RMA / HMA / VWMA / VWAP for BB/KC bases, Average Diff, and trend components (VWAP is session-anchored)
• Calculation timeframe: Compute internals on a chosen TF via request.security() while viewing any chart TF
Inputs (key):
• Calculation timeframe: Empty = chart TF; set e.g., 60/240 to compute on that TF
• BB: Length, StdDev Mult, MA Type
• KC: Basis Length, ATR Length, Multiplier, MA Type
• Average Diff: Length and MA Type
• RSI on Diff: RSI Length, Method (Built-in or Manual RMA), Smoothing Length, OB/OS levels, show/hide
• Trend Engine: Fast/Slow lengths & MA type, Signal (kept for completeness), Thrust MA length & type
• Display/Visibility: Paint bars only when Diff > 0; show zero line; “true Blue” color toggle; show/hide Diff columns and Average Diff
How to use:
1. Regime changes: Watch Diff% or Average Diff crossing 0. Above zero favors momentum/continuation setups; below zero suggests compression and potential breakout conditions.
2. State confirmation: During expansion (Diff > 0), prioritize Green/Red for aligned thrust; treat Yellow/Blue as cautionary/contrarian.
3. RSI on Diff: Use OB/OS and crossovers for timing entries/exits or for confirming/negating expansion strength.
Alerts:
• Diff crosses above/below 0
• Average Diff crosses above/below 0
• RSI(Diff) crosses above OB / below OS
• State changes: GREEN / RED / YELLOW / BLUE
Notes & limitations:
• VWAP is session-anchored and best on intraday data. If not applicable on the selected calculation TF, the script automatically falls back to EMA.
• Defaults (SMA(20) for BB/KC, multipliers 2.0, SMA(5) Average Diff, original trend coloring and bar painting) preserve the original appearance.
• RSI on Diff is plotted in the same pane for a compact workflow; you can hide it or split into a separate indicator if desired.
Release notes:
v6.0 — Upgraded to Pine v6. Added multi-MA options (SMA/EMA/WMA/RMA/HMA/VWMA/VWAP), calculation timeframe, RSI on Diff (Built-in or Manual RMA) with smoothing, safe division guard, optional zero line, and optional true Blue color. Defaults retain the original behavior.
License / disclaimer:
© waranyu.trkm — MIT License. Educational use only; not financial advice.

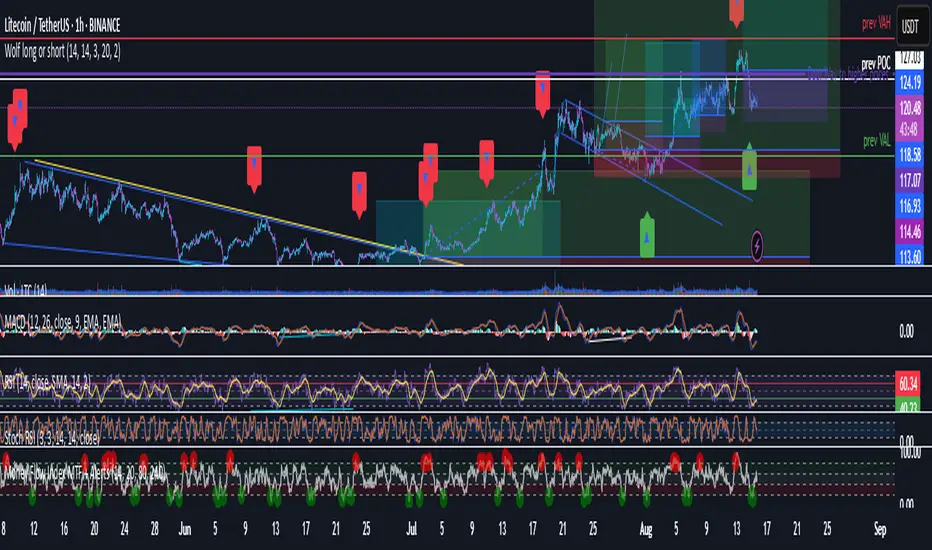
Wolf long or short this indicator is based on RSI, Stoch, BB , this indicator is giving a better understanding of short or long combined with 3 indicator
BTC/Dominance RSI by Sajad BagheriTitle: "BTC/Dominance RSI by Sajad Bagheri"
Description: "Combines BTC Price RSI (Red) and BTC Dominance RSI (Green) to detect trend conflicts and overbought/oversold conditions."
Category: Oscillators
Tags: #BTC, #Dominance, #RSI, #Bitcoin
Access: Public/Private
GMO The GMO is a multi-component confluence oscillator that helps traders visualise when several momentum and trend conditions align.
It blends an EMA trend filter, RSI bias, MACD histogram direction, and Stochastic RSI crossovers, with the option to add Fibonacci retracement proximity for additional confidence.
When multiple conditions agree, combined visual markers (triangle + emoji) appear above or below price, and background shading reflects bullish or bearish momentum. Supporting plots display MACD histogram bars, RSI, Stochastic RSI lines, and the chosen Fibonacci level, allowing quick confirmation at a glance.
This tool is best used as part of a broader confluence-based strategy and should be paired with independent analysis and risk management.
SMI Base-Trigger Bullish Re-acceleration (Higher High)Description
What it does
This indicator highlights a two-step bullish pattern using Stochastic Momentum Index (SMI) plus an ATR distance filter:
1. Base (orange) – Marks a momentum “reset.” A base prints when SMI %K crosses up through %D while %K is below the Base level (default -70). The base stores the base price and starts a waiting window.
2. Trigger (green) – Confirms momentum and price strength. A trigger prints only if, before the timeout window ends:
• SMI %K crosses up through %D again,
• %K is above the Trigger level (default -60),
• Close > Base Price, and
• Price has advanced at least Min ATR multiple (default 1.0× the 14-period ATR) above the base price.
A dashed green line connects the base to the trigger.
Why it’s useful
It seeks a bullish divergence / reacceleration: momentum recovers from deeply negative territory, then price reclaims and exceeds the base by a volatility-aware margin. This helps filter out weak “oversold bounces.”
Signals
• Base ▲ (orange): Potential setup begins.
• Trigger ▲ (green): Confirmation—momentum and price agree.
Inputs (key ones)
• %K Length / EMA Smoothing / %D Length: SMI construction.
• Base when %K < (default -70): depth required for a valid reset.
• Trigger when %K > (default -60): strength required on confirmation.
• Base timeout (days) (default 100): maximum look-ahead window.
• ATR Length (default 14) and Min ATR multiple (default 1.0): price must exceed the base by this ATR-scaled distance.
How traders use it (example rules)
• Entry: On the Trigger.
• Risk: A common approach is a stop somewhere between the base price and a multiple of ATR below trigger; or use your system’s volatility stop.
• Exits: Your choice—trend MA cross, fixed R multiple, or structure-based levels.
Notes & tips
• Works best on liquid symbols and mid-to-higher timeframes (reduce noise).
• Increase Min ATR multiple to demand stronger price confirmation; tighten or widen Base/Trigger levels to fit your market.
• This script plots signals only; convert to a strategy to backtest entries/exits.

Bullish Divergence SMI Base & Trigger with ATR FilterDescription:
A bullish divergence indicator combining the Stochastic Momentum Index (SMI) and Average True Range (ATR) to pinpoint high-probability entries:
1. Base Arrow (Orange ▲):
• Marks every SMI %K / %D bullish crossover where %K < –70 (deep oversold)—the first half of the divergence setup.
• Each new qualifying crossover replaces the previous base, continuously “arming” the divergence signal.
• Configurable SMI lookbacks, oversold threshold, and a base timeout (default 100 days) to clear stale bases.
2. Trigger Arrow (Green ▲):
• Completes the bullish divergence: fires on the next SMI bullish crossover where %K > –60 and price has dropped below the base arrow’s close by at least N × ATR (default 1 × 14-day ATR).
• A dashed green line links the base and trigger to visually confirm the divergence.
• Resets after triggering, ready for a new divergence cycle.
Inputs:
• SMI %K Length, EMA Smoothing, %D Length
• Oversold Base Level (–70), Trigger Level (–60)
• ATR Length (14), ATR Multiplier (1.0)
• Base Timeout (100 days)
Ideal for any market, this study highlights genuine bullish divergences—oversold momentum crossovers that coincide with significant price reactions—before entering long trades.


Stochastic Money Flow IndexThe Stochastic Money Flow Index (or Stochastic MFI ), is a variation of the classic Stochastic RSI that uses the Money Flow Index (MFI) rather than the Relative Strength Index (RSI) in its calculation.
While the RSI focuses solely on price momentum, the MFI is a volume-weighted indicator, meaning it incorporates both price and volume data.
The Stochastic MFI is intended to provide a more precise and sensitive reading of the MFI by measuring the level of the MFI relative to its range over a specific period.
Settings
Stochastic Settings
%K Length : The number of periods used to calculate the Stochastic. (Default: 14)
%K Smoothing : The SMA length used to 'smooth' the %K line. (Default: 3)
%D Smoothing : The SMA length used to 'smooth' the %D line. (Default: 1)
Money Flow Index Settings
MFI Length : The number of periods used to calculate the Money Flow Index. (Default: 14)
MFI Source : The source used to calculate the Money Flow Index. (Default: close)
Additional Settings
Show Overbought/Oversold Gradients? : Toggle the display of overbought/oversold gradients. (Default: true)

Stochastic SuperTrend [BigBeluga]🔵 OVERVIEW
A hybrid momentum-trend tool that combines Stochastic RSI with SuperTrend logic to deliver clean directional signals based on momentum turns.
Stochastic SuperTrend is a straightforward yet powerful oscillator overlay designed to highlight turning points in momentum with high clarity. It overlays a SuperTrend-style envelope onto the Stochastic RSI, generating intuitive up/down signals when a momentum shift occurs across the neutral 50 level. Built for traders who appreciate simplicity without sacrificing reliability.
🔵 CONCEPTS
Stochastic RSI: Measures momentum by applying stochastic calculations to the RSI curve instead of raw price.
SuperTrend Bands: Dynamic upper/lower bands are drawn around the smoothed Stoch RSI line using a user-defined multiplier.
Momentum Direction: Trend flips when the smoothed Stoch RSI crosses above/below the calculated bands.
Neutral Bias Filter: Directional arrows only appear when momentum turns above or below the central 50 level—adding confluence.
🔵 FEATURES
Trend Detection on Oscillator: Applies SuperTrend logic directly to the Stoch RSI curve.
Clean Entry Signals:
→ 🢁 arrow printed when trend flips bullish below 50 (bottom reversals).
→ 🢃 arrow printed when trend flips bearish above 50 (top reversals).
Custom Multiplier: Adjust sensitivity of SuperTrend band spacing around the oscillator.
Neutral Zone Highlight: Visual zone between 0–50 (green) and 50–100 (red) for quick momentum polarity reference.
Toggle SuperTrend Line: Option to show/hide the SuperTrend trail on the Stoch RSI.
🔵 HOW TO USE
Use 🢁 signals for potential bottom reversals when momentum flips bullish from oversold regions.
Use 🢃 signals for potential top reversals when momentum flips bearish from overbought areas.
Combine with price-based SuperTrend or support/resistance zones for confluence.
Suitable for scalping, swing trading, or momentum filtering across all timeframes.
🔵 CONCLUSION
Stochastic SuperTrend is a simple yet refined tool that captures clean momentum shifts with directional clarity. Whether you're identifying reversals, filtering entries, or spotting exhaustion in a trend, this oscillator overlay delivers just what you need— no clutter, just clean momentum structure.

FVGs, Env, BB & Knoxville: A Unified Analysis SuiteFVGs, Env, BB & Knoxville: A Unified Analysis Suite
I'm excited to share the Unified Market Analysis Suite, a powerful and comprehensive indicator designed to provide a multi-layered perspective on market dynamics.
Instead of cluttering your chart with separate tools, this script synergizes four key analytical concepts—Fair Value Gaps (FVGs), Volatility Bands (BB & Envelopes), and Momentum Divergence (Knoxville)—into one seamless package. The core philosophy is to help you identify, confirm, and act on high-probability setups by using each component to validate the others. This layered approach provides a more robust signal than any single indicator could alone.
How the Components Work Together: A Strategic Approach
This script is built for a step-by-step analysis, turning abstract data into actionable insights:
Step 1: Spot Potential Reversals with Knoxville Divergence. The process begins when a bullish or bearish Knoxville Divergence signal appears on your chart. This acts as an early warning, alerting you to a potential shift in momentum that is not yet reflected in the price trend.
Step 2: Identify Inefficiency with Fair Value Gaps (FVGs). Following a divergence signal, you then look for a Fair Value Gap to form in the direction of that divergence. For example, after a bullish divergence, a newly formed bullish FVG can serve as a high-probability zone for potential entries.
Step 3: Gauge Volatility with Bollinger Bands. The Bollinger Bands provide critical context. Is the FVG forming during a low-volatility squeeze, suggesting an explosive move might be imminent? Or is it occurring in a high-volatility environment where more caution is needed? An FVG that forms near or outside the bands can signal a particularly potent setup.
Step 4: Confirm with the Macro Trend using Envelopes. Finally, the long-term Envelope channel helps you see the bigger picture. This confirms whether your FVG/divergence setup is aligned with the dominant market trend (a continuation) or against it (a potential reversal), allowing you to manage your trade with greater confidence.
Key Features & Full Customization
Every component is highly customizable to fit your unique trading style.
1. Fair Value Gaps (FVGs) & Consequent Engulfment (CE)
Automatic Detection: Clearly identifies and plots bullish (UP) and bearish (DOWN) FVGs.
Dynamic Visuals: Boxes and CE lines extend until mitigated, with distinct colors for bullish and bearish gaps. You have the option to automatically hide filled boxes for a cleaner chart.
Mitigation Options: Choose whether FVG mitigation is calculated based on wicks or candle bodies.
Clear Labeling: A new feature adds an "FVG" text label inside each box, with adjustable size, color, and positioning.
Advanced Alerts: Receive alerts for FVG formation (confirmed and un-confirmed), price crossing an FVG's threshold (CE or full fill), and IOFED (price entry into an FVG).
2. Knoxville Divergence
Integrated Momentum Analysis: Uses a combination of RSI and Momentum to detect high-quality divergence signals.
Precision Control: Adjust RSI/Momentum lengths, the lookback period for finding divergences, and RSI overbought/oversold levels.
Intuitive Visuals & Alerts: Divergence lines are drawn directly on your chart with customizable colors, styles, and thickness. Alerts trigger the moment a new bearish or bullish divergence is confirmed.
3. Bollinger Bands (BB)
Classic Volatility Analysis: Monitor market volatility and identify potential price extremes.
Multiple MA Types: Choose from SMA, EMA, SMMA (RMA), WMA, or VWMA for the basis of the bands.
Full Customization: Adjust the length, source, and standard deviation multiplier.
4. Envelopes
Trend & Deviation Channel: Quickly assess price deviation from a central moving average.
Flexible Calculation: Can be calculated using either an SMA or EMA as the basis.
Clear Visuals: The channel is filled for easy and immediate interpretation of the broader trend.
Getting Started
This script is an overlay that plots directly on your price chart. After adding it, click the "Settings" cogwheel. You will find clearly organized sections for each of the four components, allowing you to enable, disable, and fine-tune every parameter to create the perfect analytical view for your strategy.
Acknowledgments and Development Process
This indicator is a comprehensive suite, and I want to be transparent about its development. The foundational logic for detecting three-bar Fair Value Gaps was inspired by the excellent open-source script by @twingall.
However, this module was not simply a copy; it was fundamentally re-architected and enhanced to serve as one component within this larger, original system. Here are the specific, significant improvements:
Architectural Refactoring: The original v5 code was entirely rewritten into a modular fvgManager function in Pine Script® v6, allowing it to integrate seamlessly with the other indicators.
New Feature (Dynamic Labels): I designed and implemented a system to add, manage, and customize text labels inside each FVG box—a feature not present in the original.
Original Components: The other three indicators in this suite—Envelopes, Bollinger Bands, and the Knoxville Divergence detector—are my own original code from the ground up.
Synergistic Integration: The primary development effort was focused on integrating these four distinct analytical tools. The FVG code was specifically modified to support advanced conditional visibility, ensuring it could be toggled on and off without conflicting with the other modules.
My goal was to build on a known concept and place it within a broader, synergistic framework. I truly believe the combination of these tools can enhance your analysis. If you find this script valuable, please consider giving it a boost to show your support.
I wish you all the best on your trading journey!

Dual Stochastic Enhanced (with Presets giua64)Script Title: Dual Stochastic Enhanced (with Presets giua64)
Overview:
This indicator enhances the traditional Dual Stochastic strategy, aiming to provide more filtered and potentially reliable trading signals. By integrating dynamic overbought/oversold levels via Bollinger Bands on the slow stochastic, a trend filter based on a moving average, momentum confirmation via RSI, and user-friendly selectable presets, "Dual Stochastic Enhanced" seeks to offer a more robust approach to identifying potential entry points.
Key Features:
Dual Stochastics: Utilizes a slow stochastic (configurable, e.g., 14 periods) as a context filter and a fast stochastic (configurable, e.g., 5 periods) as a signal trigger.
Bollinger Bands on Slow Stochastic: Instead of fixed overbought/oversold levels (80/20), Bollinger Bands are applied to the %K line of the slow stochastic. This creates dynamic zones that adapt to the stochastic's own volatility.
Trend Filter: A moving average (configurable type and length, e.g., EMA 100 as seen in the example chart for general context) on the price helps filter signals, allowing only trades aligned with the prevailing trend.
RSI Confirmation: An RSI oscillator (configurable length, e.g., 14 periods) is used to confirm momentum. Signals require the RSI to cross certain thresholds to validate the strength of the move.
User Presets: Includes presets for "Scalping," "Intraday," and "Swing trading," which quickly set all key parameters to suit different styles and timeframes. A "Custom" option is also available for full manual configuration.
Clear Visual Signals: Long (green) and Short (red) arrows appear on the chart when all entry conditions are met.
Active Zone Highlighting: The background of the indicator panel changes color (green or red) when "active zone" conditions (a combination of stochastics, trend, and RSI) are favorable.
Information Panel: A table in the top-right corner of the indicator panel displays the current status of the selected preset, trend filter, RSI value, and stochastic levels.
Signal Logic:
A LONG signal is generated when:
The fast stochastic %K crosses above its %D line.
The slow stochastic %K line is below its lower Bollinger Band (dynamic oversold condition).
The fast stochastic %K line is also in a low area (e.g., <25) to confirm the trigger is not premature.
The closing price is above the trend moving average (uptrend).
The RSI is above its long confirmation level (e.g., >40), indicating sufficient bullish momentum.
A SHORT signal is generated when:
The fast stochastic %K crosses below its %D line.
The slow stochastic %K line is above its upper Bollinger Band (dynamic overbought condition).
The fast stochastic %K line is also in a high area (e.g., >75).
The closing price is below the trend moving average (downtrend).
The RSI is below its short confirmation level (e.g., <60), indicating sufficient bearish momentum.
How to Use:
Select a Preset suitable for your trading style and the timeframe you are analyzing (e.g., Scalping for M1-M15, Intraday for M5-H1, Swing for H4-D1).
Alternatively, choose "Custom" and manually adjust all parameters (stochastic lengths, smoothing, Bollinger Bands, Moving Average, RSI, confirmation thresholds).
Observe the Information Panel for a quick understanding of the current conditions.
Evaluate the arrow signals, always considering the broader market context, price action, and any other confluences (supports/resistances, chart patterns).
The background highlighting can help quickly identify periods where conditions are aligned for potential trades.
Disclaimer:
This script is provided for educational and informational purposes only. Trading involves significant risk, and past performance is not indicative of future results. Always thoroughly test any strategy or indicator on historical data and on a demo account before risking real capital. The author assumes no responsibility for any losses incurred from the use of this script.
Author: giua64
