Stochastic BTC OptimizedEnhanced Stochastic for Bitcoin (BTC) – Optimized for Daily Timeframe
This enhanced Stochastic oscillator is specifically fine-tuned for BTC/USD on the 1D timeframe, leveraging historical data from Bitstamp (2011–2025) to minimize false signals and maximize reliability in Bitcoin's volatile swings.
Unlike the classic Stochastic (14, 3, 3), this version uses optimized parameters:
- K Period = 21 – smoother reaction, better suited for BTC’s macro cycles
- D Period = 3, Smooth K = 3 – reduces noise while preserving responsiveness
- Overbought = 85, Oversold = 15 – accounts for BTC’s tendency to trend strongly within extreme zones without immediate reversal
✅ Smart Signal Logic:
Buy/sell signals appear only when %K crosses %D inside the oversold (≤15) or overbought (≥85) zones, and only the first signal is shown to avoid whipsaws.
Visual Enhancements:
- Thick lines when %K/%D are in overbought/oversold zones
- Green/red background highlights on valid signals
- Optional up/down arrows for clear entry visualization
- Customizable colors, line widths, and transparency
🔒 No alerts included – clean, focused on price action and momentum.
💡 Pro Tip: For even higher accuracy, use this indicator in combination with a long-term trend filter (e.g., EMA 200). The oscillator excels in ranging or retracement phases but should not be used alone in strong parabolic moves.
Based on Mozilla Public License v2.0 – feel free to use, modify, and share. Perfect for swing traders and long-term Bitcoin analysts seeking high-probability reversal zones.
перевод на русский
Улучшенный Stochastic для Bitcoin (BTC) — оптимизирован для дневного таймфрейма
Этот улучшенный осциллятор Stochastic специально настроен под BTC/USD на дневном графике, с учётом исторических данных Bitstamp (2011–2025), чтобы минимизировать ложные сигналы и повысить надёжность в условиях высокой волатильности биткоина.
В отличие от классического Stochastic (14, 3, 3), эта версия использует оптимизированные параметры:
- Период K = 21 — более плавная реакция, лучше соответствует макроциклам BTC
- Период D = 3, Сглаживание K = 3 — снижает шум, сохраняя отзывчивость
- Уровень перекупленности = 85, перепроданности = 15 — учитывает склонность BTC к сильным трендам в экстремальных зонах без немедленного разворота
✅ Интеллектуальная логика сигналов:
Покупка/продажа отображается только при пересечении %K и %D внутри зоны перепроданности (≤15) или перекупленности (≥85), и только первый сигнал фиксируется, чтобы избежать «хлыстов».
Улучшенная визуализация:
- Жирные линии, когда %K/%D находятся в экстремальных зонах
- Зелёный/красный фон при появлении сигналов
- Опциональные стрелки для чёткого отображения точек входа
- Настройка цветов, толщины линий и прозрачности
🔒 Без алертов — чистый инструмент, сфокусированный на цене и импульсе.
💡 Совет профессионала: для ещё большей точности используйте этот индикатор вместе с трендовым фильтром (например, EMA 200). Осциллятор лучше всего работает в фазах консолидации или отката, но не стоит применять его в одиночку во время сильных параболических движений.
На основе Mozilla Public License v2.0 — свободно используйте, модифицируйте и делитесь. Идеален для свинг-трейдеров и аналитиков Bitcoin, ищущих зоны с высокой вероятностью разворота.
Stochastic-oversold

Stochastic Fusion Elite [trade_lexx]📈 Stochastic Fusion Elite is your reliable trading assistant!
📊 What is Stochastic Fusion Elite ?
Stochastic Fusion Elite is a trading indicator based on a stochastic oscillator. It analyzes the rate of price change and generates buy or sell signals based on various technical analysis methods.
💡 The main components of the indicator
📊 Stochastic oscillator (K and D)
Stochastic shows the position of the current price relative to the price range for a certain period. Values above 80 indicate overbought (an early sale is possible), and values below 20 indicate oversold (an early purchase is possible).
📈 Moving Averages (MA)
The indicator uses 10 different types of moving averages to smooth stochastic lines.:
- SMA: Simple moving average
- EMA: Exponential moving average
- WMA: Weighted moving average
- HMA: Moving Average Scale
- KAMA: Kaufman Adaptive Moving Average
- VWMA: Volume-weighted moving average
- ALMA: Arnaud Legoux Moving Average
- TEMA: Triple exponential moving average
- ZLEMA: zero delay exponential moving average
- DEMA: Double exponential moving average
The choice of the type of moving average affects the speed of the indicator's response to market changes.
🎯 Bollinger Bands (BB)
Bands around the moving average that widen and narrow depending on volatility. They help determine when the stochastic is out of the normal range.
🔄 Divergences
Divergences show discrepancies between price and stochastic:
- Bullish divergence: price is falling and stochastic is rising — an upward reversal is possible
- Bearish divergence: the price is rising, and stochastic is falling — a downward reversal is possible
🔍 Indicator signals
1️⃣ KD signals (K and D stochastic lines)
- Buy signal:
- What happens: the %K line crosses the %D line from bottom to top
- What does it look like: a green triangle with the label "KD" under the chart and the label "Buy" below the bar
- What does this mean: the price is gaining an upward momentum, growth is possible
- Sell signal:
- What happens: the %K line crosses the %D line from top to bottom
- What it looks like: a red triangle with the label "KD" above the chart and the label "Sell" above the bar
- What does this mean: the price is losing its upward momentum, possibly falling
2️⃣ Moving Average Signals (MA)
- Buy Signal:
- What happens: stochastic crosses the moving average from bottom to top
- What it looks like: a green triangle with the label "MA" under the chart and the label "Buy" below the bar
- What does this mean: stochastic is starting to accelerate upward, price growth is possible
- Sell signal:
- What happens: stochastic crosses the moving average from top to bottom
- What it looks like: a red triangle with the label "MA" above the chart and the label "Sell" above the bar
- What does this mean: stochastic is starting to accelerate downwards, a price drop is possible
3️⃣ Bollinger Band Signals (BB)
- Buy signal:
- What happens: stochastic crosses the lower Bollinger band from bottom to top
- What it looks like: a green triangle with the label "BB" under the chart and the label "Buy" below the bar
- What does this mean: stochastic was too low and is now starting to recover
- Sell signal:
- What happens: Stochastic crosses the upper Bollinger band from top to bottom
- What it looks like: a red triangle with a "BB" label above the chart and a "Sell" label above the bar
- What does this mean: stochastic was too high and is now starting to decline
4️⃣ Divergence Signals (Div)
- Buy Signal (Bullish Divergence):
- What's happening: the price is falling, and stochastic is forming higher lows
- What it looks like: a green triangle with a "Div" label under the chart and a "Buy" label below the bar
- What does this mean: despite the falling price, the momentum is already changing in an upward direction
- Sell signal (bearish divergence):
- What's going on: the price is rising, and stochastic is forming lower highs
- What it looks like: a red triangle with a "Div" label above the chart and a "Sell" label above the bar
- What does this mean: despite the price increase, the momentum is already weakening
🛠️ Filters to filter out false signals
1️⃣ Minimum distance between the signals
- What it does: sets the minimum number of candles between signals
- Why it is needed: prevents signals from being too frequent during strong market fluctuations
- How to set it up: Set the number from 0 and above (default: 5)
2️⃣ "Waiting for the opposite signal" mode
- What it does: waits for a signal in the opposite direction before generating a new signal
- Why you need it: it helps you not to miss important trend reversals
- How to set up: just turn the function on or off
3️⃣ Filter by stochastic levels
- What it does: generates signals only when the stochastic is in the specified ranges
- Why it is needed: it helps to catch the moments when the market is oversold or overbought
- How to set up:
- For buy signals: set a range for oversold (for example, 1-20)
- For sell signals: set a range for overbought (for example, 80-100)
4️⃣ MFI filter
- What it does: additionally checks the values of the cash flow index (MFI)
- Why it is needed: confirms stochastic signals with cash flow data
- How to set it up:
- For buy signals: set the range for oversold MFI (for example, 1-25)
- For sell signals: set the range for overbought MFI (for example, 75-100)
5️⃣ The RSI filter
- What it does: additionally checks the RSI values to confirm the signals
- Why it is needed: adds additional confirmation from another popular indicator
- How to set up:
- For buy signals: set the range for oversold MFI (for example, 1-30)
- For sell signals: set the range for overbought MFI (for example, 70-100)
🔄 Signal combination modes
1️⃣ Normal mode
- How it works: all signals (KD, MA, BB, Div) work independently of each other
- When to use it: for general market analysis or when learning how to work with the indicator
2️⃣ "AND" Mode ("AND Mode")
- How it works: the alarm appears only when several conditions are triggered simultaneously
- Combination options:
- KD+MA: signals from the KD and moving average lines
- KD+BB: signals from KD lines and Bollinger bands
- KD+Div: signals from the KD and divergence lines
- KD+MA+BB: three signals simultaneously
- KD+MA+Div: three signals at the same time
- KD+BB+Div: three signals at the same time
- KD+MA+BB+Div: all four signals at the same time
- When to use: for more reliable but rare signals
🔌 Connecting to trading strategies
The indicator can be connected to your trading strategies using 6 different channels.:
1. Connector KD signals: connects only the signals from the intersection of lines K and D
2. Connector MA signals: connects only signals from moving averages
3. Connector BB signal: connects only the signals from the Bollinger bands
4. Connector divergence signals: connects only divergence signals
5. Combined Connector: connects any signals
6. Connector for "And" mode: connects only combined signals
🔔 Setting up alerts
The indicator can send alerts when alarms appear.:
- Alerts for KD: when the %K line crosses the %D line
- Alerts for MA: when stochastic crosses the moving average
- Alerts for BB: when stochastic crosses the Bollinger bands
- Divergence alerts: when a divergence is detected
- Combined alerts: for all types of alarms
- Alerts for "And" mode: for combined signals
🎭 What does the indicator look like on the chart ?
- Main lines K and D: blue and orange lines
- Overbought/oversold levels: horizontal lines at levels 20 and 80
- Middle line: dotted line at level 50
- Stochastic Moving Average: yellow line
- Bollinger bands: green lines around the moving average
- Signals: green and red triangles with corresponding labels
📚 How to start using Stochastic Fusion Elite
1️⃣ Initial setup
- Add an indicator to your chart
- Select the types of signals you want to use (KD, MA, BB, Div)
- Adjust the period and smoothing for the K and D lines
2️⃣ Filter settings
- Set the distance between the signals to get rid of unnecessary noise
- Adjust stochastic, MFI and RSI levels depending on the volatility of your asset
- If you need more reliable signals, turn on the "Waiting for the opposite signal" mode.
3️⃣ Operation mode selection
- First, use the standard mode to see all possible signals.
- When you get comfortable, try the "And" mode for rarer signals.
4️⃣ Setting up Alerts
- Select the types of signals you want to be notified about
- Set up alerts for these types of signals
5️⃣ Verification and adaptation
- Check the operation of the indicator on historical data
- Adjust the parameters for a specific asset
- Adapt the settings to your trading style
🌟 Usage examples
For trend trading
- Use the KD and MA signals in the direction of the main trend
- Set the distance between the signals
- Set stricter levels for filters
For trading in a sideways range
- Use BB signals to detect bounces from the range boundaries
- Use a stochastic level filter to confirm overbought/oversold conditions
- Adjust the Bollinger bands according to the width of the range
To determine the pivot points
- Pay attention to the divergence signals
- Set the distance between the signals
- Check the MFI and RSI filters for additional confirmation

Money Flow Index Trend Zone Strength [UAlgo]The "Money Flow Index Trend Zone Strength " indicator is designed to analyze and visualize the strength of market trends and OB/OS zones using the Money Flow Index (MFI). The MFI is a momentum indicator that incorporates both price and volume data, providing insights into the buying and selling pressure in the market. This script enhances the traditional MFI by introducing trend and zone strength analysis, helping traders identify potential trend reversals and continuation points.
🔶 Customizable Settings
Amplitude: Defines the range for the MFI Zone Strength calculation.
Wavelength: Period used for the MFI calculation and Stochastic calculations.
Smoothing Factor: Smoothing period for the Stochastic calculations.
Show Zone Strength: Enables/disables visualization of the MFI Zone Strength line.
Show Trend Strength: Enables/disables visualization of the MFI Trend Strength area.
Trend Strength Signal Length: Period used for the final smoothing of the Trend Strength indicator.
Trend Anchor: Selects the anchor point (0 or 50) for the Trend Strength Stochastic calculation.
Trend Transform MA Length: Moving Average length for the Trend Transform calculation.
🔶 Calculations
Zone Strength (Stochastic MFI):
The highest and lowest MFI values over a specified amplitude are used to normalize the MFI value:
MFI Highest: Highest MFI value over the amplitude period.
MFI Lowest: Lowest MFI value over the amplitude period.
MFI Zone Strength: (MFI Value - MFI Lowest) / (MFI Highest - MFI Lowest)
By normalizing and smoothing the MFI values, we aim to highlight the relative strength of different market zones.
Trend Strength:
The smoothed MFI zone strength values are further processed to calculate the trend strength:
EMA of MFI Zone Strength: Exponential Moving Average of the MFI Zone Strength over the wavelength period.
Stochastic of EMA: Stochastic calculation of the EMA values, smoothed with the same smoothing factor.
Purpose: The trend strength calculation provides insights into the underlying market trends. By using EMA and stochastic functions, we can filter out noise and better understand the overall market direction. This helps traders stay aligned with the prevailing trend and make more informed trading decisions.
🔶 Usage
Interpreting Zone Strength: The zone strength plot helps identify overbought and oversold conditions. A higher zone strength indicates potential overbought conditions, while a lower zone strength suggests oversold conditions, can suggest areas for entry/exit decisions.
Interpreting Trend Strength: The trend strength plot visualizes the underlying market trend, can help signal potential trend continuation or reversal based on the chosen anchor point.
Using the Trend Transform: The trend transform plot provides an additional layer of trend analysis, helping traders identify potential trend reversals and continuation points.
Combine the insights from the zone strength and trend strength plots with other technical analysis tools to make informed trading decisions. Look for confluence between different indicators to increase the reliability of your trades.
🔶 Disclaimer:
Use with Caution: This indicator is provided for educational and informational purposes only and should not be considered as financial advice. Users should exercise caution and perform their own analysis before making trading decisions based on the indicator's signals.
Not Financial Advice: The information provided by this indicator does not constitute financial advice, and the creator (UAlgo) shall not be held responsible for any trading losses incurred as a result of using this indicator.
Backtesting Recommended: Traders are encouraged to backtest the indicator thoroughly on historical data before using it in live trading to assess its performance and suitability for their trading strategies.
Risk Management: Trading involves inherent risks, and users should implement proper risk management strategies, including but not limited to stop-loss orders and position sizing, to mitigate potential losses.
No Guarantees: The accuracy and reliability of the indicator's signals cannot be guaranteed, as they are based on historical price data and past performance may not be indicative of future results.

Overbought / Oversold Screener## Introduction
**The Versatile RSI and Stochastic Multi-Symbol Screener**
**Unlock a wealth of trading opportunities with this customizable screener, designed to pinpoint potential overbought and oversold conditions across 17 symbols, with alert support!**
## Description
This screener is suitable for tracking multiple instruments continuously.
With the screener, you can see the instant RSI or Stochastic values of the instruments you are tracking, and easily catch the moments when they are overbought / oversold according to your settings.
The purpose of the screener is to facilitate the continuous tracking of multiple instruments. The user can track up to 17 different instruments in different time intervals. If they wish, they can set an alarm and learn overbought oversold according to the values they set for the time interval of the instruments they are tracking.**
Key Features:
Comprehensive Analysis:
Monitors RSI and Stochastic values for 17 symbols simultaneously.
Automatically includes the current chart's symbol for seamless integration.
Supports multiple timeframes to uncover trends across different time horizons.
Personalized Insights:
Adjust overbought and oversold thresholds to align with your trading strategy.
Sort results by symbol, RSI, or Stochastic values to prioritize your analysis.
Choose between Automatic, Dark, or Light mode for optimal viewing comfort.
Dynamic Visual Cues:
Instantly highlights oversold and overbought symbols based on threshold levels.
Timely Alerts:
Stay informed of potential trading opportunities with alerts for multiple oversold or overbought symbols.
## Settings
### Display
**Timeframe**
The screener displays the values according to the selected timeframe. The default timeframe is "Chart". For example, if the timeframe is set to "15m" here, the screener will show the RSI and stochastic values for the 15-minute chart.
** Theme **
This setting is for changing the theme of the screener. You can set the theme to "Automatic", "Dark", or "Light", with "Automatic" being the default value. When the "Automatic" theme is selected, the screener appearance will also be automatically updated when you enable or disable dark mode from the TradingView settings.
** Position **
This option is for setting the position of the table on the chart. The default setting is "middle right". The available options are (top, middle, bottom)-(left, center, right).
** Sort By **
This option is for changing the sorting order of the table. The default setting is "RSI Descending". The available options are (Symbol, RSI, Stoch)-(Ascending, Descending).
It is important to note that the overbought and oversold coloring of the symbols may also change when the sorting order is changed. If RSI is selected as the sorting order, the symbols will be colored according to the overbought and oversold threshold values specified for RSI. Similarly, if Stoch is selected as the sorting order, the symbols will be colored according to the overbought and oversold threshold values specified for Stoch.
From this perspective, you can also think of the sorting order as a change in the main indicator.
### RSI / Stochastic
This area is for selecting the parameters of the RSI and stochastic indicators. You can adjust the values for "length", "overbought", and "oversold" for both indicators according to your needs. The screener will perform all RSI and stochastic calculations according to these settings. All coloring in the table will also be according to the overbought and oversold values in these settings.
### Symbols
The symbols to be tracked in the table are selected from here. Up to 16 symbols can be selected from here. Since the symbol in the chart is automatically added to the table, there will always be at least 1 symbol in the table. Note that the symbol in the chart is shown in the table with "(C)". For example, if SPX is open in the chart, it is shown as SPX(C) in the table.
## Alerts
The screener is capable of notifying you with an alarm if multiple symbols are overbought or oversold according to the values you specify along with the desired timeframe. This way, you can instantly learn if multiple symbols are overbought or oversold with one alarm, saving you time.

Exponential Stochastic Strategywhat is Exponential Stochastic?
it is a modified version of the stochastic indicator. This strategy does not include pyramiding, repaint, trailing stop or take profit.
what it does?
It contains an extra input in addition to the stochastic indicator. Thanks to this input, different exponential weights can be given to the outputs and the indicator can be made more sensitive or insensitive. The strategy buys when the indicator leaves the overbought zone, sells when it leaves the oversold zone and always stays in the trade.
how it does it?
it uses this formula: i.hizliresim.com
Thanks to this formula, even if the weights given to the outputs change, the indicator always continues to take a value between 0 and 100.
how to use it ?
With the input named "exp", you can change the sensitivity of the indicator and develop different strategies. other inputs are the same as the stochastic indicator. Increasing the exp value causes the indicator to signal less, decreasing it makes it much more sensitive.

MTF Stochastic ScannerThis Stochastic scanner can be use to identify overbought and oversold of 10 symbols over multiple timeframes
it will give you a quick overview which pair is more overbough or more oversold and also signals tops and bottoms in the AVG row
light red/green cell = weak bearish (Stoch = 30-20) / bullish (Stoch = 70-80)
medium red/green cell = bearish (Stoch = 20-10) / bullish (Stoch = 80-90)
dark red/green cell = strong bearish (Stoch <= 10) / bullish (Stoch >= 90)
gray cell = neutral (Stoch = 30-70)
Usage
If AVG (average of all 4 timeframes) falls below 20, the cell will get green, indicating a good time to enter long (buy)
If AVG (average of all 4 timeframes) rises above 80, the cell will get red, indicating a good time to enter short (sell)
Use the "MTF Stochastic Scanner" in combination with the " MTF RSI Scanner "
to find tops (RSI MTF avg >=70 AND Stochastic MTF avg >= 80)
or bottoms (RSI MTF avg <= 30 AND Stochastic MTF avg <= 20)
Here is how the two MTF scanners looked on Nov 08 2021 (ATH) »
and here how the MTF scanners looked on June 21 2022
use TradingViews Replay function to check how it would have worked in the past and when not.
As always… there NOT a single indicator that can show to the top & bottom 100% every single time. So use with caution, with other indicators and/or deeper understanding of technicals analysis ☝️☝️☝️
Settings
You can change the timeframes, symbols, Stochastic settings, overbought/oversold levels and colors to your liking
Drag the table onto the price chart, if you want to use it as an overlay.
NOTE:
Because of the 4x10 security requests, it can take up to 1 minute for changed settings to take effect! Please be patient 🙃
If you have any idea on how to optimise the code, please feel free to share 🙏
*** Inspired by "Binance CHOP Dashboard" from @Cazimiro and "RSI MTF Table" from @mobester16 ***

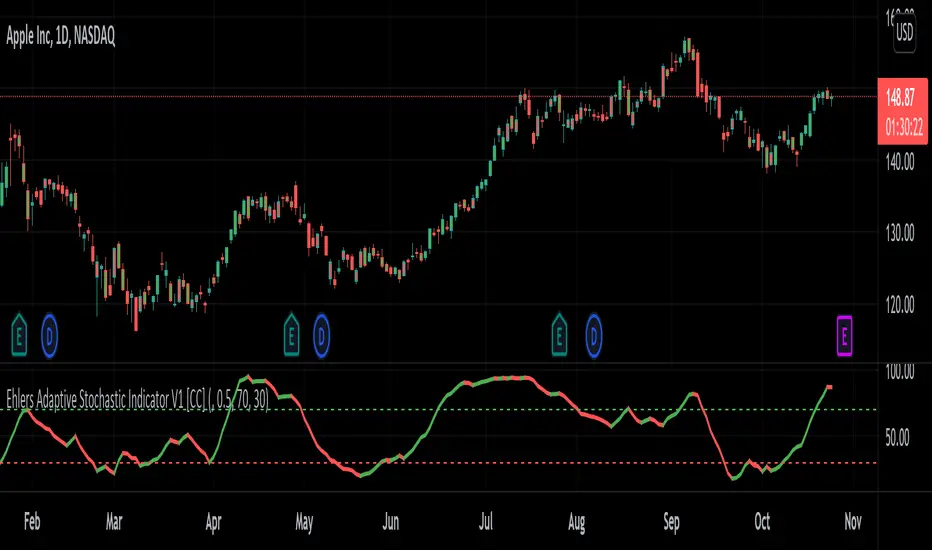
Ehlers Adaptive Stochastic Indicator V1 [CC]The Adaptive Stochastic Indicator V1 was created by John Ehlers (Rocket Science For Traders pgs 233-234) and this indicator uses the same calculations to find a cycle period that is then used for both the creation of the stochastic indicator but also for the smoothing to create a double smoothed stochastic indicator. Because it is calculated this way, this indicator is more reactive than almost any other stochastic indicator and provides clear buy and sell signals especially when the underlying stock is trending. It is interpreted in the same way as a normal stochastic indicator so great buy signals are when the indicator is below the oversold line and starts to move up and vice versa. Buy when the line turns green and sell when it turns red.
Let me know if there are any other indicators you would like to see me publish!
Modified Stochastic MACD Oscillator - Vitali ApirineFor all MACD enthusiasts out there, hot off the press, I present this next generation "Modified Stochastic MACD Oscillator" employing PSv4.0, originally formulated by Vitali Apirine for TASC - November 2019 Traders Tips. Just when you may have thought it was the end of the evolutionary line for MACD technology, it's not! Basically it's a NEW hybridization of a MACD and stochastic rolled into one, maintaining scale symmetry to support overbought/oversold defined levels across time frames and assets, unlike the ordinary MACD. On the ordinary MACD, this is virtually impossible to do properly, and trust me, I have tried with zero success. My less than 40 line implementation, at initial release, is a heavily modified version of the original indicator using novel techniques, surpassing not only Apirine's original intended design, but also the "contemporary MACD" provided by TV, visible on the bottom of the chart.
Utilizing the "Power of Pine", I included the maximum amount of features I could surmise in an ultra small yet powerful package. I provided an abundance of control over each feature as an attempt to create another heavenly MACD experience in an open source package, only rivaled by my "Ultimate MACD Super Pack". Configurations are displayed above in multiple scenarios that should be suitable for most traders. Of notable mention, I rescaled the oscillator more towards a zero mean unity scale, while still leaving the waveforms completely intact.
Features List Includes:
Dark Background - Easily disabled in indicator Settings->Style for "Light" charts or with Pine commenting
AND much, much more... you have the source!
For those of you who are new to Pine Script, this script also may help you understand advanced programming techniques in Pine and how they may be utilized in a most effective manner. I would like to see Tradingview become the go to platform for the best MACD indicators attainable with this contribution to the TV community. This is commonly what my dense intricate code looks like behind the veil, and if you are wondering why there is no notes, that's because the notation is in the variable naming. If you wish to contribute additional ideas, please do so below in the comments about all things MACD in Pine.
NOTICE: Copy pasting bandits who may be having nefarious thoughts, DO NOT attempt this, because this may violate Tradingview's terms, conditions and/or house rules. "WE" are always watching the TV community vigilantly for mischievous behaviors and actions that exploit well intended authors for the purpose of unscrupulously increasing brownie points in reputation scores. Hiding behind a "protected" wall may not protect you from investigation and account penalization by TV staff. Be respectful, and don't just throw a meaningless feature in there branding it as "your" gizmo. Fair enough? Alrighty then... I firmly believe in "innovating" future state-of-the-art indicators, and please contact me if you wish to do so.
The comments section below is solely just for commenting and other remarks, ideas, compliments, etc... regarding only this indicator, not others. When available time provides itself, I will consider your inquiries, thoughts, and concepts presented below in the comments section if you do have any questions or comments regarding this indicator. When my indicators achieve more prevalent use by TV members, I may implement more ideas when they present themselves as worthy additions. As always, "Like" it if you simply just like it with a proper thumbs up, and also return to my scripts list occasionally for additional postings. Have a profitable future everyone!


Stochastic with False bar R2-2 by JustUncleLThis study project is an updated version of the implementation of the "Stochastic False BAR" indicator.
Description:
The standard Stochastic buy/sell indications come from Stochastic crosses about the standard overbought/oversold zones (80/20). This does not always work and you get stuck in the OB/OS zones with a trend continuation. Utilising a second much longer length Stochastic, the "False BAR" (Black) indicates when it is unsafe to take Stochastic cross over trades. Where the false bar does not appear (aqua, no background highlighing), the overbought / oversold conditions of the Stochastic can be considered higher-probability reversal areas and thus trading opportunities.
This Revision:
Added options to enable/disable False Bar lines and Stochastic trends.
Added options to modify upper and lower limits of false bar Stochastic and trading stochastic trend.
Added option to show the trading Stochastic as coloured Ribbon.
Added name titles for all plots
Added Background highlighting for False Bar.
