Historical Returns [BigBeluga]🔵 OVERVIEW
The Historical Returns indicator visualizes daily and monthly return data to help traders assess seasonal performance and volatility behavior. It provides a clean and informative dashboard showing the current month’s daily return bubbles, monthly return curves, and a snapshot of the current month and year performance. This tool is ideal for spotting recurring return patterns and understanding the broader profitability context of a symbol.
🔵 CONCEPTS
Daily Return Bubbles: Each trading day is analyzed for its return percentage, and plotted as a bubble with size proportional to the return magnitude.
Monthly Performance Curves: Average or cumulative returns are calculated and plotted to show how the current month is performing relative to historical averages.
Current Year Return: Current year performance as a single return value, giving traders context on long-term profitability.
Current Month Average Return: Current month average performance as a single return value, giving traders context on short-term profitability.
Extreme Return Labels: Optionally highlights daily returns above +4% or below -4% with labeled percentages for spike recognition.
🔵 FEATURES
Shows daily return bubbles (1%–7%+), color-coded by direction.
Labels monthly returns with the month name and percentage value.
Displays a performance dashboard with:
Daily return heatmap for the current month.
Average return for the current month.
Year-to-date return.
Toggle between average and cumulative modes for monthly return curves.
Clearly marks days with abnormal return spikes using optional labels.
Clean fallback warning if not on a daily chart ("⚠️USE DAILY TIMEFRAME").
Custom color themes for bullish and bearish values.
🔵 HOW TO USE
Use the monthly return curve to compare how the current month is performing against historical averages.
Look for clusters of positive or negative bubbles as signals of strong directional weeks.
Watch extreme return labels for volatility spikes or catalyst days.
Use year-to-date return to assess how the asset is trending in the broader macro cycle.
Combine with other BigBeluga tools to align trades with historically favorable periods.
🔵 CONCLUSION
Historical Returns is your visual companion for return analytics — helping you identify profitable months, detect volatility surges, and understand historical seasonality at a glance. With a clean dashboard and insightful overlays, this tool supports better timing and improved statistical edge in both short- and long-term trades.
Statisticalanalysis

Gott's Copernican Trend PredictorThe Gott's Copernican Trend Predictor predicts trend duration using the Copernican Principle - Based on astrophysicist Richard Gott's temporal prediction method.
I had the idea to create this indicator after reading the book The Doomsday Calculation by William Poundstone.
Background & Theory
This indicator implements J. Richard Gott III's Copernican Principle - a statistical method that famously predicted the fall of the Berlin Wall and the duration of Broadway shows with remarkable accuracy.
The Copernican Principle Explained
Named after Copernicus who showed that Earth is not at the center of the universe, this principle assumes that you are not observing something at a special moment in time. When you observe a trend at any random point, you're statistically more likely to be seeing it during the "middle portion" of its lifetime rather than at its very beginning or end.
The Mathematics
Gott's formula provides a 95% confidence interval for how much longer a trend will continue:
Minimum remaining duration = Current Age ÷ 39
Maximum remaining duration = Current Age × 39
The factor of 39 comes from statistical analysis where:
There's only a 2.5% chance you're observing in the first 1/40th of the trend's life
There's only a 2.5% chance you're observing in the last 1/40th of the trend's life
This gives us 95% confidence that the trend will last between Age/39 and Age×39
How It Works
Trend Detection
The indicator uses dual moving averages (default: 50 & 200 period) to identify trend changes:
Bullish Cross: Fast MA crosses above Slow MA → Uptrend begins
Bearish Cross: Fast MA crosses below Slow MA → Downtrend begins
Real-Time Predictions
Once a trend is detected, the indicator continuously calculates:
Trend Age: How long the current trend has been active
Gott's 95% CI: Statistical range for remaining trend duration
Projected End Dates: Calendar dates when the trend might end
How to Use
Setup
Add the indicator to any timeframe (works on minutes, hours, days, weeks)
Customize MA periods and type (SMA, EMA, WMA)
Choose table position and font size for optimal viewing
Interpretation
Example: If a trend is 100 hours old:
Minimum duration: 100 ÷ 39 = ~3 more hours
Maximum duration: 100 × 39 = ~3,900 more hours
95% confidence: The trend will end between these times
This indicator might be useful for swing traders, trend followers, and quantitative analysts.
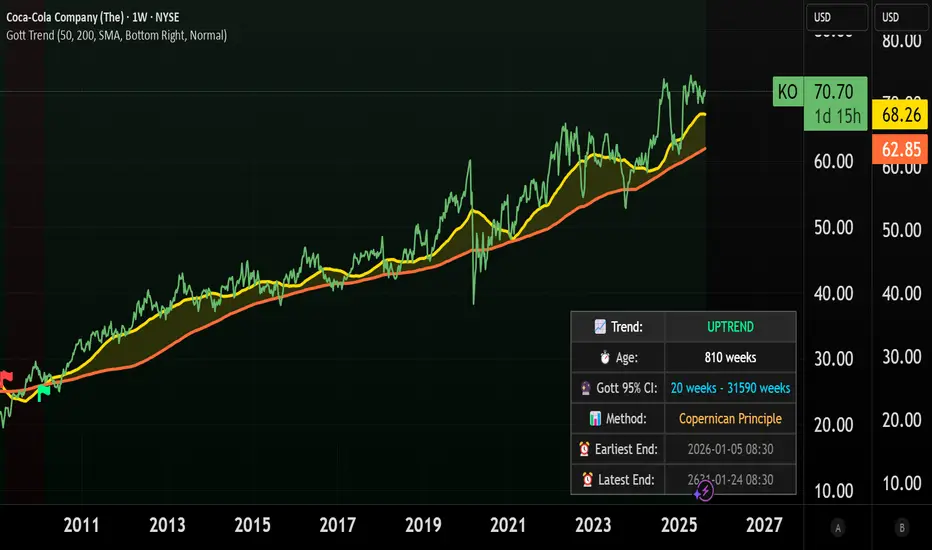
Coca-Cola example:
Coca-Cola's chart shows an uptrend spanning 810 weeks, approximately 15.5 years. According to Gott's Copernican Principle, this trend age generates a 95% confidence interval predicting the trend will continue for a minimum of 20 weeks and a maximum of 31,590 weeks.
On the other hand, a shorter trend age produces a proportionally smaller minimum duration and different risk profile in terms of statistical continuation probability. For this reason, more recent trends (and more recent companies) are likely to remain in trend for shorter.
StatPivot- Dynamic Range Analyzer - indicator [PresentTrading]Hello everyone! In the following few open scripts, I would like to share various statistical tools that benefit trading. For this time, it is a powerful indicator called StatPivot- Dynamic Range Analyzer that brings a whole new dimension to your technical analysis toolkit.
This tool goes beyond traditional pivot point analysis by providing comprehensive statistical insights about price movements, helping you identify high-probability trading opportunities based on historical data patterns rather than subjective interpretations. Whether you're a day trader, swing trader, or position trader, StatPivot's real-time percentile rankings give you a statistical edge in understanding exactly where current price action stands within historical contexts.
Welcome to share your opinions! Looking forward to sharing the next tool soon!
█ Introduction and How it is Different
StatPivot is an advanced technical analysis tool that revolutionizes retracement analysis. Unlike traditional pivot indicators that only show static support/resistance levels, StatPivot delivers dynamic statistical insights based on historical pivot patterns.
Its key innovation is real-time percentile calculation - while conventional tools require new pivot formations before updating (often too late for trading decisions), StatPivot continuously analyzes where current price stands within historical retracement distributions.
Furthermore, StatPivot provides comprehensive statistical metrics including mean, median, standard deviation, and percentile distributions of price movements, giving traders a probabilistic edge by revealing which price levels represent statistically significant zones for potential reversals or continuations. By transforming raw price data into statistical insights, StatPivot helps traders move beyond subjective price analysis to evidence-based decision making.
█ Strategy, How it Works: Detailed Explanation
🔶 Pivot Point Detection and Analysis
The core of StatPivot's functionality begins with identifying significant pivot points in the price structure. Using the parameters left and right, the indicator locates pivot highs and lows by examining a specified number of bars to the left and right of each potential pivot point:
Copyp_low = ta.pivotlow(low, left, right)
p_high = ta.pivothigh(high, left, right)
For a point to qualify as a pivot low, it must have left higher lows to its left and right higher lows to its right. Similarly, a pivot high must have left lower highs to its left and right lower highs to its right. This approach ensures that only significant turning points are recognized.
🔶 Percentage Change Calculation
Once pivot points are identified, StatPivot calculates the percentage changes between consecutive pivot points:
For drops (when a pivot low is lower than the previous pivot low):
CopydropPercent = (previous_pivot_low - current_pivot_low) / previous_pivot_low * 100
For rises (when a pivot high is higher than the previous pivot high):
CopyrisePercent = (current_pivot_high - previous_pivot_high) / previous_pivot_high * 100
These calculations quantify the magnitude of each market swing, allowing for statistical analysis of historical price movements.
🔶 Statistical Distribution Analysis
StatPivot computes comprehensive statistics on the historical distribution of drops and rises:
Average (Mean): The arithmetic mean of all recorded percentage changes
CopyavgDrop = array.avg(dropValues)
Median: The middle value when all percentage changes are arranged in order
CopymedianDrop = array.median(dropValues)
Standard Deviation: Measures the dispersion of percentage changes from the average
CopystdDevDrop = array.stdev(dropValues)
Percentiles (25th, 75th): Values below which 25% and 75% of observations fall
Copyq1 = array.get(sorted, math.floor(cnt * 0.25))
q3 = array.get(sorted, math.floor(cnt * 0.75))
VaR95: The maximum expected percentage drop with 95% confidence
Copyvar95D = array.get(sortedD, math.floor(nD * 0.95))
Coefficient of Variation (CV): Measures relative variability
CopycvD = stdDevDrop / avgDrop
These statistics provide a comprehensive view of market behavior, enabling traders to understand the typical ranges and extreme moves.
🔶 Real-time Percentile Ranking
StatPivot's most innovative feature is its real-time percentile calculation. For each current price, it calculates:
The percentage drop from the latest pivot high:
CopycurrentDropPct = (latestPivotHigh - close) / latestPivotHigh * 100
The percentage rise from the latest pivot low:
CopycurrentRisePct = (close - latestPivotLow) / latestPivotLow * 100
The percentile ranks of these values within the historical distribution:
CopyrealtimeDropRank = (count of historical drops <= currentDropPct) / total drops * 100
This calculation reveals exactly where the current price movement stands in relation to all historical movements, providing crucial context for decision-making.
🔶 Cluster Analysis
To identify the most common retracement zones, StatPivot performs a cluster analysis by dividing the range of historical drops into five equal intervals:
CopyrangeSize = maxVal - minVal
For each interval boundary:
Copyboundaries = minVal + rangeSize * i / 5
By counting the number of observations in each interval, the indicator identifies the most frequently occurring retracement zones, which often serve as significant support or resistance areas.
🔶 Expected Price Targets
Using the statistical data, StatPivot calculates expected price targets:
CopytargetBuyPrice = close * (1 - avgDrop / 100)
targetSellPrice = close * (1 + avgRise / 100)
These targets represent statistically probable price levels for potential entries and exits based on the average historical behavior of the market.
█ Trade Direction
StatPivot functions as an analytical tool rather than a direct trading signal generator, providing statistical insights that can be applied to various trading strategies. However, the data it generates can be interpreted for different trade directions:
For Long Trades:
Entry considerations: Look for price drops that reach the 70-80th percentile range in the historical distribution, suggesting a statistically significant retracement
Target setting: Use the Expected Sell price or consider the average rise percentage as a reasonable target
Risk management: Set stop losses below recent pivot lows or at a distance related to the statistical volatility (standard deviation)
For Short Trades:
Entry considerations: Look for price rises that reach the 70-80th percentile range, indicating an unusual extension
Target setting: Use the Expected Buy price or average drop percentage as a target
Risk management: Set stop losses above recent pivot highs or based on statistical measures of volatility
For Range Trading:
Use the most common drop and rise clusters to identify probable reversal zones
Trade bounces between these statistically significant levels
For Trend Following:
Confirm trend strength by analyzing consecutive higher pivot lows (uptrend) or lower pivot highs (downtrend)
Use lower percentile retracements (20-30th percentile) as entry opportunities in established trends
█ Usage
StatPivot offers multiple ways to integrate its statistical insights into your trading workflow:
Statistical Table Analysis: Review the comprehensive statistics displayed in the data table to understand the market's behavior. Pay particular attention to:
Average drop and rise percentages to set reasonable expectations
Standard deviation to gauge volatility
VaR95 for risk assessment
Real-time Percentile Monitoring: Watch the real-time percentile display to see where the current price movement stands within the historical distribution. This can help identify:
Extreme movements (90th+ percentile) that might indicate reversal opportunities
Typical retracements (40-60th percentile) that might continue further
Shallow pullbacks (10-30th percentile) that might represent continuation opportunities in trends
Support and Resistance Identification: Utilize the plotted pivot points as key support and resistance levels, especially when they align with statistically significant percentile ranges.
Target Price Setting: Use the expected buy and sell prices calculated from historical averages as initial targets for your trades.
Risk Management: Apply the statistical measurements like standard deviation and VaR95 to set appropriate stop loss levels that account for the market's historical volatility.
Pattern Recognition: Over time, learn to recognize when certain percentile levels consistently lead to reversals or continuations in your specific market, and develop personalized strategies based on these observations.
█ Default Settings
The default settings of StatPivot have been carefully calibrated to provide reliable statistical analysis across a variety of markets and timeframes, but understanding their effects allows for optimal customization:
Left Bars (30) and Right Bars (30): These parameters determine how pivot points are identified. With both set to 30 by default:
A pivot low must be the lowest point among 30 bars to its left and 30 bars to its right
A pivot high must be the highest point among 30 bars to its left and 30 bars to its right
Effect on performance: Larger values create fewer but more significant pivot points, reducing noise but potentially missing important market structures. Smaller values generate more pivot points, capturing more nuanced movements but potentially including noise.
Table Position (Top Right): Determines where the statistical data table appears on the chart.
Effect on performance: No impact on analytical performance, purely a visual preference.
Show Distribution Histogram (False): Controls whether the distribution histogram of drop percentages is displayed.
Effect on performance: Enabling this provides visual insight into the distribution of retracements but can clutter the chart.
Show Real-time Percentile (True): Toggles the display of real-time percentile rankings.
Effect on performance: A critical setting that enables the dynamic analysis of current price movements. Disabling this removes one of the key advantages of the indicator.
Real-time Percentile Display Mode (Label): Chooses between label display or indicator line for percentile rankings.
Effect on performance: Labels provide precise information at the current price point, while indicator lines show the evolution of percentile rankings over time.
Advanced Considerations for Settings Optimization:
Timeframe Adjustment: Higher timeframes generally benefit from larger Left/Right values to identify truly significant pivots, while lower timeframes may require smaller values to capture shorter-term swings.
Volatility-Based Tuning: In highly volatile markets, consider increasing the Left/Right values to filter out noise. In less volatile conditions, lower values can help identify more potential entry and exit points.
Market-Specific Optimization: Different markets (forex, stocks, commodities) display different retracement patterns. Monitor the statistics table to see if your market typically shows larger or smaller retracements than the current settings are optimized for.
Trading Style Alignment: Adjust the settings to match your trading timeframe. Day traders might prefer settings that identify shorter-term pivots (smaller Left/Right values), while swing traders benefit from more significant pivots (larger Left/Right values).
By understanding how these settings affect the analysis and customizing them to your specific market and trading style, you can maximize the effectiveness of StatPivot as a powerful statistical tool for identifying high-probability trading opportunities.

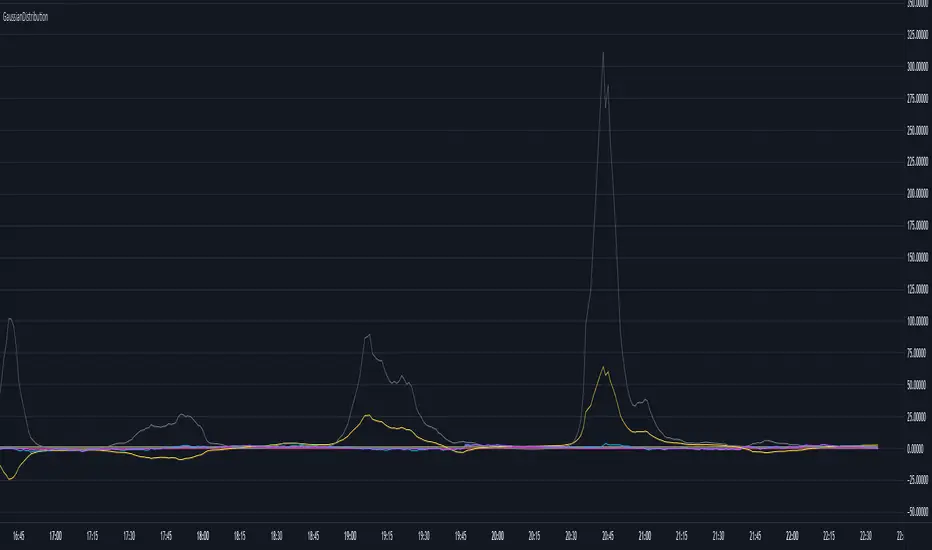
GaussianDistributionLibrary "GaussianDistribution"
This library defines a custom type `distr` representing a Gaussian (or other statistical) distribution.
It provides methods to calculate key statistical moments and scores, including mean, median, mode, standard deviation, variance, skewness, kurtosis, and Z-scores.
This library is useful for analyzing probability distributions in financial data.
Disclaimer:
I am not a mathematician, but I have implemented this library to the best of my understanding and capacity. Please be indulgent as I tried to translate statistical concepts into code as accurately as possible. Feedback, suggestions, and corrections are welcome to improve the reliability and robustness of this library.
mean(source, length)
Calculate the mean (average) of the distribution
Parameters:
source (float) : Distribution source (typically a price or indicator series)
length (int) : Window length for the distribution (must be >= 30 for meaningful statistics)
Returns: Mean (μ)
stdev(source, length)
Calculate the standard deviation (σ) of the distribution
Parameters:
source (float) : Distribution source (typically a price or indicator series)
length (int) : Window length for the distribution (must be >= 30 for meaningful statistics)
Returns: Standard deviation (σ)
skewness(source, length, mean, stdev)
Calculate the skewness (γ₁) of the distribution
Parameters:
source (float) : Distribution source (typically a price or indicator series)
length (int) : Window length for the distribution (must be >= 30 for meaningful statistics)
mean (float) : the mean (average) of the distribution
stdev (float) : the standard deviation (σ) of the distribution
@return Skewness (γ₁)
skewness(source, length)
Overloaded skewness to calculate from source and length
Parameters:
source (float) : Distribution source (typically a price or indicator series)
length (int) : Window length for the distribution (must be >= 30 for meaningful statistics)
@return Skewness (γ₁)
mode(mean, stdev, skewness)
Estimate mode - Most frequent value in the distribution (approximation based on skewness)
Parameters:
mean (float) : the mean (average) of the distribution
stdev (float) : the standard deviation (σ) of the distribution
skewness (float) : the skewness (γ₁) of the distribution
@return Mode
mode(source, length)
Overloaded mode to calculate from source and length
Parameters:
source (float) : Distribution source (typically a price or indicator series)
length (int) : Window length for the distribution (must be >= 30 for meaningful statistics)
@return Mode
median(mean, stdev, skewness)
Estimate median - Middle value of the distribution (approximation)
Parameters:
mean (float) : the mean (average) of the distribution
stdev (float) : the standard deviation (σ) of the distribution
skewness (float) : the skewness (γ₁) of the distribution
@return Median
median(source, length)
Overloaded median to calculate from source and length
Parameters:
source (float) : Distribution source (typically a price or indicator series)
length (int) : Window length for the distribution (must be >= 30 for meaningful statistics)
@return Median
variance(stdev)
Calculate variance (σ²) - Square of the standard deviation
Parameters:
stdev (float) : the standard deviation (σ) of the distribution
@return Variance (σ²)
variance(source, length)
Overloaded variance to calculate from source and length
Parameters:
source (float) : Distribution source (typically a price or indicator series)
length (int) : Window length for the distribution (must be >= 30 for meaningful statistics)
@return Variance (σ²)
kurtosis(source, length, mean, stdev)
Calculate kurtosis (γ₂) - Degree of "tailedness" in the distribution
Parameters:
source (float) : Distribution source (typically a price or indicator series)
length (int) : Window length for the distribution (must be >= 30 for meaningful statistics)
mean (float) : the mean (average) of the distribution
stdev (float) : the standard deviation (σ) of the distribution
@return Kurtosis (γ₂)
kurtosis(source, length)
Overloaded kurtosis to calculate from source and length
Parameters:
source (float) : Distribution source (typically a price or indicator series)
length (int) : Window length for the distribution (must be >= 30 for meaningful statistics)
@return Kurtosis (γ₂)
normal_score(source, mean, stdev)
Calculate Z-score (standard score) assuming a normal distribution
Parameters:
source (float) : Distribution source (typically a price or indicator series)
mean (float) : the mean (average) of the distribution
stdev (float) : the standard deviation (σ) of the distribution
@return Z-Score
normal_score(source, length)
Overloaded normal_score to calculate from source and length
Parameters:
source (float) : Distribution source (typically a price or indicator series)
length (int) : Window length for the distribution (must be >= 30 for meaningful statistics)
@return Z-Score
non_normal_score(source, mean, stdev, skewness, kurtosis)
Calculate adjusted Z-score considering skewness and kurtosis
Parameters:
source (float) : Distribution source (typically a price or indicator series)
mean (float) : the mean (average) of the distribution
stdev (float) : the standard deviation (σ) of the distribution
skewness (float) : the skewness (γ₁) of the distribution
kurtosis (float) : the "tailedness" in the distribution
@return Z-Score
non_normal_score(source, length)
Overloaded non_normal_score to calculate from source and length
Parameters:
source (float) : Distribution source (typically a price or indicator series)
length (int) : Window length for the distribution (must be >= 30 for meaningful statistics)
@return Z-Score
method init(this)
Initialize all statistical fields of the `distr` type
Namespace types: distr
Parameters:
this (distr)
method init(this, source, length)
Overloaded initializer to set source and length
Namespace types: distr
Parameters:
this (distr)
source (float)
length (int)
distr
Custom type to represent a Gaussian distribution
Fields:
source (series float) : Distribution source (typically a price or indicator series)
length (series int) : Window length for the distribution (must be >= 30 for meaningful statistics)
mode (series float) : Most frequent value in the distribution
median (series float) : Middle value separating the greater and lesser halves of the distribution
mean (series float) : μ (1st central moment) - Average of the distribution
stdev (series float) : σ or standard deviation (square root of the variance) - Measure of dispersion
variance (series float) : σ² (2nd central moment) - Squared standard deviation
skewness (series float) : γ₁ (3rd central moment) - Asymmetry of the distribution
kurtosis (series float) : γ₂ (4th central moment) - Degree of "tailedness" relative to a normal distribution
normal_score (series float) : Z-score assuming normal distribution
non_normal_score (series float) : Adjusted Z-score considering skewness and kurtosis