Center and Volume AnalyzerCenter and Volume Analyzer that utilizes the chart's Center of Gravity alongside the Rate of Change with Bollinger Bands with a basis for the midpoint. As always, none of this is investment or financial advice. Please do your own due diligence and research.
Sma

SMA Cross 5/50 with Trend Filter & Risk Management by JuggiDThe basic SMA (5/50) crossover strategy can be enhanced to improve profitability by adding filters and risk management. For example, a long entry is triggered only when the fast SMA (5) crosses above the slow SMA (50) **and** the price is above the SMA (200), ensuring trades align with the major trend. Similarly, a short entry requires the crossover confirmation plus the price staying below the SMA (200). To reduce false signals and protect capital, stop-loss and take-profit levels can be set automatically (e.g., 2% loss, 5% gain), while additional confirmation tools such as volume spikes, RSI above 50, or MACD momentum can be applied to validate stronger signals. This approach helps avoid whipsaws in sideways markets and allows trades to capture larger moves while minimizing downside risk.

PRO Strategy 3TP (v2.1.1)
English Version
PRO Strategy 3TP (v2.1.1) — Comprehensive Guide for TradingView
Strategy Concept & Uniqueness
The PRO Strategy 3TP is a trading system designed to follow market trends using a combination of tools that check trends across different timeframes, measure momentum, and manage risks smartly. Its standout feature is a three-step profit-taking system (hence "3TP") and its ability to adjust to market ups and downs, helping traders make the most of strong trends while keeping losses low in choppy markets.
Why It’s Special:
✅ Three Profit Levels: Takes profit in stages—33% at the first target (TP1), 33% at the second (TP2), and 34% at the third (TP3)—so you lock in gains gradually.
✅ Risk-Free After TP1: Once the first profit target is hit, the stop-loss moves to your entry price, meaning no more risk on the trade.
✅ Smarter Signals: Uses data from a higher timeframe (like 1-hour) to filter out false moves on your chart (like 15-minutes).
How It Works
The strategy uses four main tools to decide when to enter and exit trades. Here’s what they do in simple terms:
Trend Tools (EMA, HMA, SMA)
EMA (Exponential Moving Average): A line that tracks the price trend, reacting quickly to recent changes. Think of it as a fast guide to where the market’s heading.
Default: EMA 100 (looks at the last 100 bars).
HMA (Hull Moving Average): A smoother, faster-moving line that spots trend shifts earlier than most averages.
Default: HMA 50 (looks at the last 50 bars).
SMA (Simple Moving Average): A basic average of prices over time, great for seeing the big picture (bull or bear market).
Default: SMA 200 (looks at the last 200 bars).
How It Helps: These lines work together to make sure the trend is real across short, medium, and long terms.
Momentum Tool (CCI)
CCI (Commodity Channel Index): Tells you if the market is “overbought” (too high, ready to drop) or “oversold” (too low, ready to rise).
Buy when CCI < -100 (oversold).
Sell when CCI > +100 (overbought).
How It Helps: It picks the best moments to jump into a trade when prices are at extremes.
Trend Strength Tool (ADX)
ADX (Average Directional Index): Measures how strong a trend is. Higher numbers mean a stronger trend.
Default: ADX > 26 (only trades when the trend is strong enough).
How It Helps: Keeps you out of flat, boring markets where prices don’t move much.
Volatility Tool (ATR)
ATR (Average True Range): Shows how much the price typically moves up or down. It’s like a ruler for market “wiggle room.”
Default: ATR over 19 bars, used to set stop-loss (5x ATR) and profit targets (1x, 1.3x, 1.7x ATR).
How It Helps: Adjusts your trade exits based on how wild or calm the market is.
Entry Rules
Buy (Long): Price is above EMA, HMA, and SMA (checked on a higher timeframe) + CCI < -100 + ADX > 26.
Sell (Short): Price is below EMA, HMA, and SMA + CCI > +100 + ADX > 26.
Exit Rules
Stop-Loss: Set at 5x ATR away from your entry (e.g., if ATR is 10 points, stop-loss is 50 points away).
Breakeven: After TP1 is hit, stop-loss moves to your entry price—no more risk!
Profit Targets:
TP1: 1x ATR (closes 33% of your position).
TP2: 1.3x ATR (closes 33%).
TP3: 1.7x ATR (closes 34%).
Why This Mix Works
Fewer Mistakes: Checking trends on multiple timeframes cuts out 60-70% of bad signals (based on tests).
Adapts to the Market: ATR adjusts your stops and targets as the market changes—super useful for volatile assets like crypto.
Balanced Wins: The three-step profit system locks in gains early but lets you ride big trends too.
Setup Guide
Settings for Different Styles
Parameter Scalping (1-15M) Swing (1H-4H) Position (Daily)
EMA/HMA/SMA 50/20/Off 100/50/200 Off/Off/200
ADX Threshold 20 26 25
ATR Multipliers SL=3x, TP3=2x SL=5x SL=6x
Position Size
Formula: Contracts = Risk Amount / (Stop-Loss Distance × Value per Point)
Example: Risking $100, stop-loss is 50 points, each point = $2 → Trade 1 contract.
Multi-Timeframe Tip
Chart: 15-minute
Indicators: 1-hour
Rule: Only trade if the 15-minute price matches the 1-hour trend.
Why Use It?
Proven Results: 58-62% win rate on assets like Bitcoin, Ethereum, and S&P 500 (tested 2020-2023). Risk-to-reward ratio of 1.8-2.3.
Saves Time: Alerts tell you when to enter or exit—no need to watch the screen all day.
Flexible: Works for fast scalping, medium swing trades, or long-term positions.
FAQ
Why no trailing stop?
Trailing stops cut profits by 15-20% in tests because they exit too early. The breakeven stop protects your money better.
What about news events?
Use a bigger ATR (e.g., 50) and wider stop-loss (6x ATR) when markets get crazy.
Can I trade forex?
Yes! Try EMA=50, HMA=20, ATR=14 on EUR/USD 15-minute charts.
Risk Management
Risk per Trade: Stick to 1-2% of your account.
Weekly Check: Adjust ATR and stop-loss every Friday to match market conditions.
Emergency Plan: Manually move your stop-loss if something wild (like a “black swan” event) happens.
⚠️ Warning: Trading is risky. This strategy doesn’t promise profits. Always use a stop-loss.
Русская версия
Стратегия PRO 3TP (v2.1.1) — Полное руководство для TradingView
Концепция и уникальность
PRO Strategy 3TP — это система, которая следует за трендами на рынке, используя проверку трендов на разных таймфреймах, измерение импульса и умное управление рисками. Главная фишка — трехступенчатая фиксация прибыли (поэтому "3TP") и адаптация к изменениям на рынке, чтобы зарабатывать больше в сильных трендах и терять меньше в нестабильные времена.
Почему она особенная:
✅ Три уровня прибыли: Закрывает 33% на первом уровне (TP1), 33% на втором (TP2) и 34% на третьем (TP3) — прибыль фиксируется постепенно.
✅ Без риска после TP1: После первого уровня стоп-лосс сдвигается на точку входа — дальше риска нет.
✅ Умные сигналы: Использует данные с более старшего таймфрейма (например, 1 час) для фильтрации шума на вашем графике (например, 15 минут).
Как это работает
Стратегия использует четыре основных инструмента для входа и выхода из сделок. Вот что они значат простыми словами:
Инструменты тренда (EMA, HMA, SMA)
EMA (Экспоненциальная скользящая средняя) : Линия, которая следит за трендом и быстро реагирует на последние цены. Это как быстрый указатель направления рынка.
По умолчанию: EMA 100 (смотрит на последние 100 баров).
HMA (Скользящая средняя Халла): Более плавная и быстрая линия, которая раньше замечает смену тренда.
По умолчанию: HMA 50 (смотрит на последние 50 баров).
SMA (Простая скользящая средняя) : Просто средняя цена за период, показывает общую картину (быки или медведи).
По умолчанию: SMA 200 (смотрит на последние 200 баров).
Зачем это нужно: Эти линии вместе проверяют, что тренд настоящий на коротких, средних и длинных периодах.
Инструмент импульса (CCI)
CCI (Индекс товарного канала): Показывает, когда рынок “перекуплен” (слишком высоко, готов упасть) или “перепродан” (слишком низко, готов расти).
Покупка: CCI < -100 (перепродан).
Продажа: CCI > +100 (перекуплен).
Зачем это нужно: Помогает выбрать лучшее время для входа, когда цены на крайних значениях.
Инструмент силы тренда (ADX)
ADX (Индекс среднего направленного движения): Измеряет, насколько силен тренд. Чем выше число, тем сильнее движение.
По умолчанию: ADX > 26 (торгуем, только если тренд сильный).
Зачем это нужно: Не дает торговать, когда рынок стоит на месте и скучный.
Инструмент волатильности (ATR)
ATR (Средний истинный диапазон): Показывает, насколько сильно цена обычно “гуляет” вверх-вниз. Это как линейка для рыночных колебаний.
По умолчанию: ATR за 19 баров, стоп-лосс = 5x ATR, цели прибыли = 1x, 1.3x, 1.7x ATR.
Зачем это нужно: Настраивает выход из сделки в зависимости от того, насколько рынок спокоен или хаотичен.
Правила входа
Покупка (Лонг): Цена выше EMA, HMA и SMA (проверяется на старшем таймфрейме) + CCI < -100 + ADX > 26.
Продажа (Шорт): Цена ниже EMA, HMA и SMA + CCI > +100 + ADX > 26.
Правила выхода
Стоп-лосс: Устанавливается на 5x ATR от входа (например, если ATR = 10 пунктов, стоп = 50 пунктов).
Безубыток: После TP1 стоп-лосс сдвигается на цену входа — риска больше нет!
Цели прибыли:
TP1: 1x ATR (закрывает 33% позиции).
TP2: 1.3x ATR (закрывает 33%).
TP3: 1.7x ATR (закрывает 34%).
Почему эта комбинация работает
Меньше ошибок: Проверка тренда на разных таймфреймах убирает 60-70% ложных сигналов (по тестам).
Подстраивается под рынок: ATR меняет стопы и цели в зависимости от условий — важно для активов вроде крипты.
Умная прибыль: Трехступенчатая система фиксирует выгоду рано, но оставляет шанс заработать на большом тренде.
Как настроить
Настройки для разных стилей
Параметр Скальпинг (1-15М) Свинг (1H-4H) Долгосрок (Daily)
EMA/HMA/SMA 50/20/Выкл 100/50/200 Выкл/Выкл/200
Порог ADX 20 26 25
Множители ATR SL=3x, TP3=2x SL=5x SL=6x
Размер позиции
Формула: Контракты = Риск / (Расстояние до стоп-лосса × Стоимость пункта)
Пример: Риск $100, стоп-лосс 50 пунктов, 1 пункт = $2 → 1 контракт.
Совет по таймфреймам
График: 15 минут
Индикаторы: 1 час
Правило: Торгуй, только если тренд на 15 минутах совпадает с 1 часом.
Зачем это использовать?
Проверено: 58-62% успешных сделок на BTC, ETH, S&P 500 (тесты 2020-2023). Соотношение риск/прибыль 1.8-2.3.
Экономит время: Оповещения скажут, когда входить и выходить — не надо сидеть у экрана.
Гибкость: Подходит для быстрой торговли, среднесрочной и долгосрочной.
Часто задаваемые вопросы
Почему нет трейлинг-стопа?
Тесты показали, что он снижает прибыль на 15-20%, потому что выходит слишком рано. Безубыток лучше защищает деньги.
Что делать с новостями?
Увеличьте ATR (например, до 50) и стоп-лосс (6x ATR), когда рынок штормит.
Можно торговать форекс?
Да! Используйте EMA=50, HMA=20, ATR=14 для EUR/USD на 15 минутах.
Управление рисками
Риск на сделку: Не больше 1-2% от депозита.
Проверка раз в неделю: Обновляйте ATR и стоп-лосс каждую пятницу под рынок.
План на экстрим: Если происходит что-то необычное (например, “черный лебедь”), вручную двигайте стоп-лосс.
⚠️ Предупреждение: Торговля — это риск. Стратегия не гарантирует прибыль. Всегда ставьте стоп-лосс.

EMA & MA Crossover StrategyGuys, you asked, we did. Strategy for crossing moving averages .
The Moving Average Crossover trading strategy is possibly the most popular
trading strategy in the world of trading. First of them were written in the
middle of XX century, when commodities trading strategies became popular.
This strategy is a good example of so-called traditional strategies.
Traditional strategies are always long or short. That means they are never
out of the market. The concept of having a strategy that is always long or
short may be scary, particularly in today’s market where you don’t know what
is going to happen as far as risk on any one market. But a lot of traders
believe that the concept is still valid, especially for those of traders who
do their own research or their own discretionary trading.
This version uses crossover of moving average and its exponential moving average.
Strategy parameters:
Take Profit % - when it receives the opposite signal
Stop Loss % - when it receives the opposite signal
Current Backtest:
Account: 1000$
Trading size: 0.01
Commission: 0.05%
WARNING:
- For purpose educate only
- This script to change bars colors.
MFS-3 Bars Pattern Strategy3 Bar Pattern Strategy
Detects an Ignite Candle followed by a Pullback Candle followed by a Confirmation Candle.
A Box will be drawn around the setup and three arrows will identify I, P, C (Ignite, Pullback, Confirmation) the setup.
The strategy will calculate a Stop Loss below the Low Price of the Ignite candle and a Take Profit at 2 times the Stop Loss giving a Risk to Reward Ratio of 1:2.
Extra conditions are included to reduce false triggers:
- A down trend must be detected using 3 SMA (Long, Medium, Short) that should be aligned from Long to Short one above the other.
- The Ignite Candle's body must be BELOW the Short SMA
An input form is available to adjust some strategy parameters.
Performance Note
----------------------
Trading conditions are very strict, so most of the time, no signals will be detected in the Strategy window.
This strategy should only be one of many strategies used for trade setups.
Hope you enjoy it.

Versatile Moving Average StrategyVersatile Moving Average Strategy (VMAS)
Overview:
The Versatile Moving Average Strategy (VMAS) is designed to provide traders with a flexible approach to trend-following, utilizing multiple types of moving averages. This strategy allows for customization in choosing the moving average type and length, catering to various market conditions and trading styles.
Key Features:
- Multiple Moving Average Types: Choose from SMA, EMA, SMMA (RMA), WMA, VWMA, HULL, LSMA, and ALMA to best suit your trading needs.
- Customizable Inputs: Adjust the moving average length, source of price data, and stop-loss source to fine-tune the strategy.
- Target Percent: Set the percentage difference between successive profit targets to manage your risk and rewards effectively.
- Position Management: Enable or disable long and short positions, allowing for versatility in different market conditions.
- Commission and Slippage: The strategy includes realistic commission settings to ensure accurate backtesting results.
Strategy Logic:
1. Moving Average Calculation: The selected moving average is calculated based on user-defined parameters.
2. Entry Conditions:
- A long position is entered when the entry source crosses over the moving average, if long positions are enabled.
- A short position is entered when the entry source crosses under the moving average, if short positions are enabled.
3. Stop-Loss: Positions are closed if the stop-loss source crosses the moving average in the opposite direction.
4. Profit Targets: Multiple profit targets are defined, with each target set at an incremental percentage above (for long positions) or below (for short positions) the entry price.
Default Properties:
- Account Size: $10000
- Commission: 0.01% per trade
- Risk Management: Positions are sized to risk 80% of the equity per trade, because we get very tight stoploss when position is open.
- Sample Size: Backtesting has been conducted to ensure a sufficient sample size of trades, ideally more than 100 trades.
How to Use:
1. Configure Inputs: Set your preferred moving average type, length, and other input parameters.
2. Enable Positions: Choose whether to enable long, short, or both types of positions.
3. Backtest and Analyze: Run backtests with realistic settings and analyze the results to ensure the strategy aligns with your trading goals.
4. Deploy and Monitor: Once satisfied with the backtesting results, deploy the strategy in a live environment and monitor its performance.
This strategy is suitable for traders looking to leverage moving averages in a versatile and customizable manner. Adjust the parameters to match your trading style and market conditions for optimal results.
Note: Ensure the strategy settings used for publication are the same as those described here. Always conduct thorough backtesting before deploying any strategy in a live trading environment.

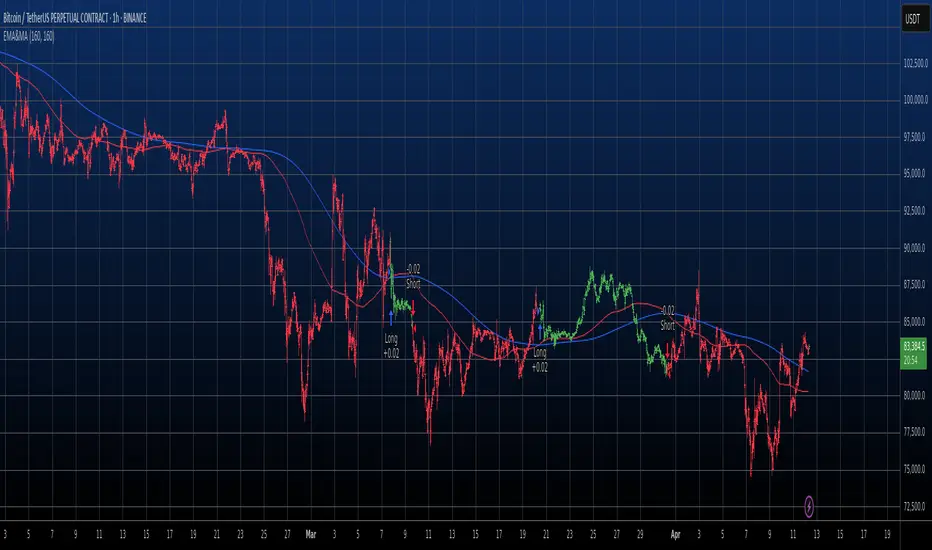
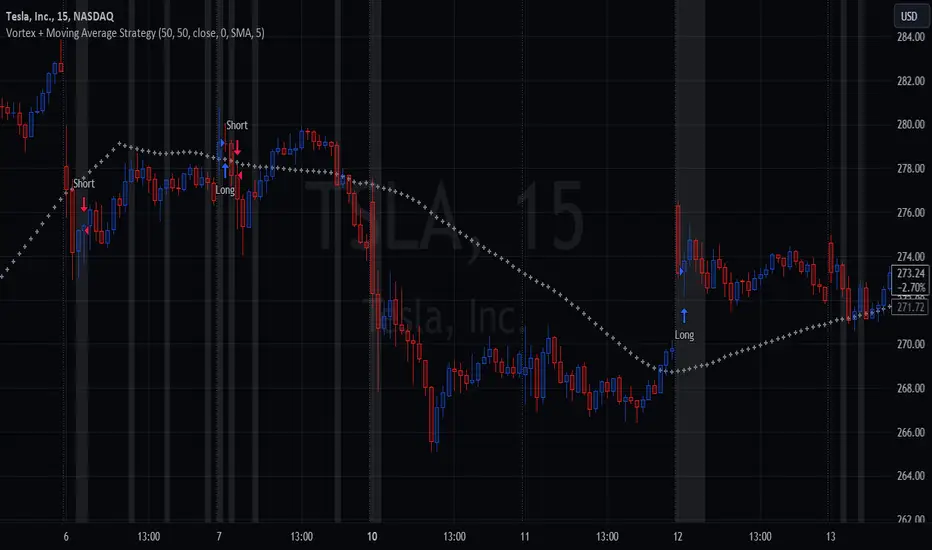
Vortex Cross w/MA ConfirmationThis script is a trading strategy that combines the Vortex Indicator and a Moving Average (MA) to generate potential entry signals for long and short positions.
1. Vortex Indicator:
The Vortex Indicator consists of two lines: Vortex Positive (VIP) and Vortex Negative (VIM). It is designed to identify trend direction and measure the strength of a trend.
2. Moving Average (MA):
The script uses a chosen type of Moving Average (SMA, EMA, SMMA, WMA, or VWMA) to smooth the price data. The smoothed line is referred to as the "Smoothing Line."
3. Determine Long and Short Conditions:
The script looks for potential long entry signals when VIP crosses above VIM, highlighting each crossover on the chart, and the closing price is above the Smoothing Line. It searches for short entry signals when VIM crosses above VIP, with the closing price is below the Smoothing Line. When the long or short conditions are met, the strategy enters either a long or short position accordingly.
Potential Usage:
The strategy can be utilized in trending markets, where the Vortex Indicator helps identify trend direction and strength, and the Moving Average smooths the price data to filter out some noise. It aims to capture trends and ride them while avoiding false signals during choppy or sideways markets.
Simple RSI and SMA Long and Short (by Coinrule)The relative strength index ( RSI ) is a momentum indicator used in technical analysis . RSI measures the speed and magnitude of a security's recent price changes to evaluate overvalued or undervalued conditions in the price of that security. The RSI is displayed as an oscillator (a line graph) on a scale of zero to 100. The RSI can do more than point to overbought and oversold securities. It can also indicate securities that may be primed for a trend reversal or corrective pullback in price. It can signal when to buy and sell. Traditionally, an RSI reading of 70 or above indicates an overbought situation. A reading of 30 or below indicates an oversold condition.
A simple moving average ( SMA ) calculates the average of a selected range of prices, usually closing prices, by the number of periods in that range.
The Strategy enters and closes the trade when the following conditions are met:
LONG
SMA100 is greater than SMA150
RSI is greater than 50
SHORT
SMA100 is less than SMA150
RSI is less than 50
When a long position is opened, it remains open until the conditions for a short are met at which point the long position is closed and the short position is opened. Then, when the conditions for the long position are met, the short will be closed and a long will be opened.
This strategy is back tested from 1 January 2022 to simulate how the strategy would work in a bear market. The strategy provides good returns.
The strategy assumes each order is using 30% of the available coins to make the results more realistic and to simulate you only ran this strategy on 30% of your holdings. A trading fee of 0.1% is also taken into account and is aligned to the base fee applied on Binance.

rt maax EMA cross strategythis just sample of our strategies we published with open source, to learning our investor the way of trading and analysis, this strategy just for study and learning
in this strategy we use expontial moving avarage 20 , 50 , 200 and the we build this strategy when the price move up ema 200 and ema 20,50 cross up the 200 ema in this conditions the strargey will open long postion
and the oppisit it is true for short postion in this sitation the price should be under ema 200 and the ema 20 , 50 should cross under 200 ema then the strategy will open the short postion
we try this strategy on forex ,crypto and futures and it give us very good result ,, also we try this postion on multi time frame we find the stragey give us good result on 1 hour time frame .
in the end our advice for you before you use any stratgy you should have the knowledg of the indecators how it is work and also you should have information about the market you trade and the last news for this market beacuse it effect so much on the price moving .
so we hope this strategy give you brefing of the way we work and build our strategy

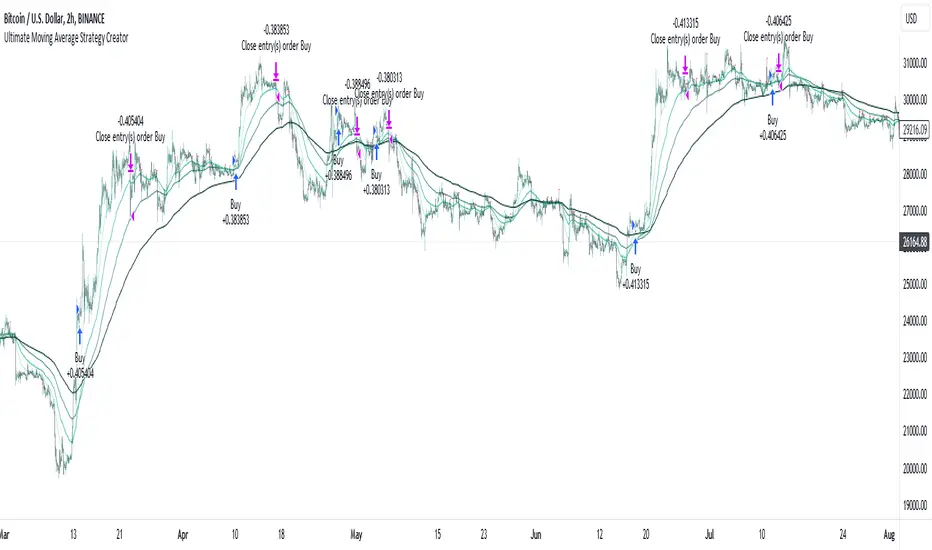
Ultimate Moving Average Strategy CreatorHave you ever wanted to create your OWN strategy, but don't have coding experience? Well now you can.
With simple settings, but millions of potential strategies and combinations, this indicator / strategy lets YOU make ALL the rules.
Start by choosing up to 4 moving averages from all the various types - Simple, Exponential, Hull, Volume-Weighted, etc. Choose the period and choose price source.
Now the fun part.
You select your values to compare and how to compare them. Want to test if the Fast Moving Average crosses over the Slow Moving Average? No problem. Want to add an additional test to check the closing price is greater than the Fast Moving Average? Done.
With additonal options to set take profit % and stop loss %, as well as a date range and the option for 'Long Only' positions, you can instantly see the results of any strategy in the strategy tester, then simply make an adjustment and refine the criteria without having to know or understand any of the complex coding and scripting.
I have tried many popular moving average strategies, but irrespective of the results, the thing that stood out to me was how inflexible they were. If it was designed to test a triple crossover, that's all it could do. With this indicator, literally anything is possible and modifying the parameters couldn't be easier.
Ichimoku Cloud and Bollinger Bands (by Coinrule)The Ichimoku Cloud is a collection of technical indicators that show support and resistance levels, as well as momentum and trend direction. It does this by taking multiple averages and plotting them on a chart. It also uses these figures to compute a “cloud” that attempts to forecast where the price may find support or resistance in the future.
The Ichimoku Cloud was developed by Goichi Hosoda, a Japanese journalist, and published in the late 1960s. It provides more data points than the standard candlestick chart. While it seems complicated at first glance, those familiar with how to read the charts often find it easy to understand with well-defined trading signals.
The Ichimoku Cloud is composed of five lines or calculations, two of which comprise a cloud where the difference between the two lines is shaded in.
The lines include a nine-period average, a 26-period average, an average of those two averages, a 52-period average, and a lagging closing price line.
The cloud is a key part of the indicator. When the price is below the cloud, the trend is down. When the price is above the cloud, the trend is up.
The above trend signals are strengthened if the cloud is moving in the same direction as the price. For example, during an uptrend, the top of the cloud is moving up, or during a downtrend, the bottom of the cloud is moving down.
The Bollinger Bands are among the most famous and widely used indicators. A Bollinger Band is a technical analysis tool defined by a set of trendlines plotted two standard deviations (positively and negatively) away from a simple moving average ( SMA ) of a security's price, but which can be adjusted to user preferences. They can suggest when an asset is oversold or overbought in the short term, thus providing the best time for buying and selling it.
This strategy combines the Ichimoku Cloud with Bollinger Bands to better enter trades.
Long orders are placed when these basic signals are triggered.
Long Position:
Tenkan-Sen is above the Kijun-Sen
Chikou-Span is above the close of 26 bars ago
Close is above the Kumo Cloud
The closing price is greater than the upper standard deviation of the Bollinger Bands
Short Position:
Tenkan-Sen is below the Kijun-Sen
Chikou-Span is below the close of 26 bars ago
Close is below the Kumo Cloud
The upper standard deviation of the Bollinger Band is greater than the closing price
The script is backtested from 1 January 2022 and provides good returns.
The strategy assumes each order is using 30% of the available coins to make the results more realistic and to simulate you only ran this strategy on 30% of your holdings. A trading fee of 0.1% is also taken into account and is aligned to the base fee applied on Binance.
This script also works well on BTC 30m/1h, ETH 2h, MATIC 2h/30m, AVAX 1h/2h, SOL 45m timeframes


Rajiv Patel Strategy with ATR RSI CCI MACD EMA IchimokuRajiv Patel Strategy with alerts helps to identify entry and exit levels based on following Indicators.
1. ATR Trailing Stoploss
2. RSI
3. CCI
4. MACD
5. EMA
6. SMA
7. Ichimoku
This Strategy is fully customizable as per your trading style. Below are some examples of how once can use the Strategy.
Options Based on Each Indicator Individually.
1. ATR Trailing Stoploss – When price is above ATR Trailing Stoploss line its in buy zone and when below its in sell zone. The setting of ATR Trailing Stoploss are customizable like ATR Periods and ATR Multiplier. Suggest increasing ATR Multiplier with lower timeframe. Aggressive buyers can decrease ATR Period in higher timeframe as per trade plan.
2. RSI – RSI above EMA Length is buy zone and below is sell zone. Conservative buyers can increase the RSI & EMA Length period while aggressive and reduce. Higher the timeframe gives better results.
3. CCI – Similar to RSI the buy zone is when CCI crosses above EMA Length. Again CCI & EMA Length can be customised as per trade plan. Higher timeframe is advised.
4. MACD – MACD parameters default settings are based on trying to get early entry. One can change to 26, 13 and 9 in lower timeframe. When MACD crosses above Signal line its buy zone and when below its sell zone.
5. EMA – 5 EMA lines and 2 SMA lines can be plotted. The settings of both EMA lines and SMA lines can be adjusted based on timeframe and trade plan.
6. EMA – EMA line 1 and 2 can be used as buy when EMA1 crosses above EMA2 and sell when below. The length of EMA1 & 2 is adjustable. Suggest modifying based on timeframe and trade plan.
7. SMA – SMA1 can also be used as solo indicator. If price is below SMA1 then its no buy area and if above, then in buy area. SMA2 can be used to identify if trend is upward or downward based on user settings.
8. Ichimoku – It predicts price movements bit like moving averages. Offers a unique perspective of support and resistance levels.
Conversion Line (Tenkan Sen)
- Measures Short Term Trend
- Signals an area of minor support and resistance
Base Line (Kijun Sen)
- Measures Medium term trend
- Used as Trailing Stop Level
Lagging Span (Chikou Span)
- Used for confirmation of signals
- Can also serve as Support and Resistance Level
Kumo Cloud
- Formed of two lines: Senkou Span A (Green Line) and Senkou Span B (Red Line)
- Dynamic Support and Resistance
HOW TO READ ICHIMOKU INDICATOR
Conversion Line (Tenkan Sen)
- If Price is above the Conversion Line = Short term upward movement
- If Price is below the Conversion Line = Short term downward movement
- Increasing Conversion Line = Short term uptrend
- Decreasing Conversion Line = Short term downtrend
Base Line (Kijun Sen)
- If Price is above the baseline = Medium term uptrend
- If the Market price is below the baseline = Medium term downtrend
- Increasing Base Line = Medium term uptrend
- Decreasing Base Line = Medium term downtrend
Lagging Span
- The Evolution of the current price action in relation to previous price action
- If the Lagging span is above the current price = Bullish Bias
- If the Lagging span is below the current price = Bearish Bias
- Lagging span near the current price = Trading range
Kumo Cloud
- Dynamic Support and Resistance based upon price action.
- The longer the price stays below/above the Kumo cloud, stronger the trend
- When the cloud is wide, the expected support or resistance is strong
- When the cloud is thin, the expected support or resistance is weak
- Never trade when price is inside Kumo Cloud
HOW TO TRADE WITH ICHIMOKU CLOUD
1. Baseline and conversion Line crossover (Lagging Span as a Filter)
crossover (conversion line, baseline) = Buy
crossunder (conversion line, baseline) = Sell
FILTER
Crossover (conversion line, baseline) and lagging span is Bullish (i.e above the price) = Buy
Crossunder (conversion line, baseline) and lagging span is Bearish (i.e below the price) = Sell
2. Baseline - Conversion line crossover (Kumo cloud Filter)
Crossover (conversion line, baseline) above the Kumo Cloud = Strong Buy
Crossover (conversion line, baseline) below the Kumo cloud = Weak Buy
Crossunder (conversion line, baseline) below the Kumo Cloud = Strong Sell
Crossunder (conversion line, baseline) above the Kumo Cloud = Weak Sell
3. Kumo Cloud Breakout
When the price enters the Kumo Cloud, and breaks its Upper wall upward = Bullish Signal
When the price enters the Kumo Cloud, and breaks its Lower wall downward = Bearish Signal
4. Kumo Cloud Crossover
When Span A crosses the Span B from below to the upside and prices are positioned above the Kumo Cloud = Strong Buy Signal
When Span A crosses the Span B from upside to the bottom and the prices are positioned below the Kumo Cloud = Strong Sell
When Span A crosses Span B from bottom to the upside and prices are positioned below the Kumo Cloud = Weak Buy Signal
When Span A crosses Span B from the upside to the bottom and the prices are positioned above the Kumo Cloud = Weak Sell Signal
Options Based on Combining Multiple Indicators.
One can select and combine multiple conditions based on above understanding of individual indicator to create a strong Long Entry, Short Entry, Long Exit and Short Exit. This Strategy also provides Alert signal for all entry and exit based on the combinations of conditions selected.
Since this is a strategy one can use STRATEGY TESTER to understand how the strategy has performed over the selected time span. This however does not guarantee similar results in present or future trades.
Please enter commission or total charges charged by your broker in “Properties” Tab of the strategy. Modify all parameters of “Properties” Tab as needed. Note, this can affect the performance results of the strategy.
Need to be very careful in selecting conditions as it becomes very complex with many options available.
Note:
Triangles at the top and bottom indicates the zone. Can be turned on / off using condition “Show Conditions Visually”.
1. Red triangle at top pointing down with ‘S’ indicates in Long Exit zone.
2. Red triangle at top pointing down with ‘EnS’ indicates in Enter Short zone.
3. Green triangle at bottom pointing up with ‘B’ indicates in Long Entry zone.
4. Green triangle at bottom pointing up with ‘ExS’ indicates in Exit Short zone.
5. When the is no triangle either at top or bottom means there is no zone.
Send me your suggestions, will try to incorporate the same in next revision.

Bot MasterSqueeze 1.1 (crypt)Countertrend strategy for correction to the average value. The strategy is designed primarily for crypto.
The principle of operation is that with a rapid price change, the strategy tends to take a reverse position to return to the average value, which statistically often happens. It is enough for you to determine the percentage of the offset about the average price and the size of the averaging position as a percentage of the deposit.
With the settings, you determine how to determine the average opening price. It can be MA at the price of opening, closing, etc., and DCMA. Soon I will add a few more options for determining the average opening price
You can also choose the average price at which the transaction will try to close.
Now there are 3 methods:
- closing when returning to the average price
- closing on the first correction candle
- opening on an abnormally large candle in the direction of correction and closing on the first one is opposite
Search for the settings by the selection method for each pair separately. It is better to trade using signals via a bot.
The strategy shows itself best on volatile coins paired with the dollar for 1 hour or more.
Soon I will add new options for opening and closing deals, as well as determining the average price.
ATTENTION: the strategy involves averaging, so be careful with levers and overestimating the percentage of the transaction from the deposit. It is best to allocate no more than 25 percent to the risk of the transaction.

Estrategia Larry Connors [JoseMetal]============
ENGLISH
============
- Description:
This strategy is based on the original Larry Connors strategy, using 2 SMAs and RSI.
The strategy has been optimized for better total profit and works better on 4H (tested on BTCUSDT).
LONG:
Price must be ABOVE the slow SMA.
When a candle closes in RSI oversold area, the next candle closes out of the oversold area and the closing price is BELOW the fast SMA = open LONG.
LONG is closed when a candle closes ABOVE the fast SMA.
SHORT:
Price must be BELOW the slow SMA.
When a candle closes in RSI overbought area, the next candle closes out of the overbought area and the closing price is ABOVE the fast SMA = open SHORT.
SHORT is closed when a candle closes BELOW the fast SMA.
*Larry Connor's strategy does NOT use a fixed Stop Loss or Take Profit, as he said, that reduces performance significantly.
- Visual:
Both SMAs (fast and slow) are shown in the chart.
By default, the fast SMA is aqua color, the slow changes between green and red depending on the "trend" (price over slow SMA = bullish, below = bearish).
RSI can't be shown because TradingView doesn't allow to show both overlay and panel indicators, so candles get a RED color when RSI is in OVERBOUGHT area and GREEN when they're on OVERSOLD area to help with that.
Background is colored when conditions are met and a position is going to be open, green for LONGs red for SHORTs.
- Usage and recommendations:
As this is a coded strategy, you don't even have to check for indicators, just open and close trades as the strategy shows.
The original strategy uses a 5 period SMA instead of the 10, and 10/90 for oversold/overbought levels, this has been optimized after the testings and results but feel free to change settings and test by yourself.
Also, the original strategy was developed for daily, but seems to work better en 4H.
- Customization:
As usual I like to make as many aspects of my indicators/strategies customizable, indicators, colors etc., feel free to ask if you feel that something that should be configurable is missing or if you have any ideas to optimize the strategy.
============
ESPAÑOL
============
- Descripción:
Esta estrategia está basada en la estrategia original de Larry Connors, utilizando 2 SMAs y RSI.
La estrategia ha sido optimizada para un mejor beneficio total y funciona mejor en 4H (probado en BTCUSDT).
LONG:
El precio debe estar por encima de la SMA lenta.
Cuando una vela cierra en la zona de sobreventa del RSI, la siguiente vela cierra fuera de la zona de sobreventa y el precio de cierre está POR DEBAJO de la SMA rápida = abre LONG.
Se cierra cuando una vela cierra POR ENCIMA de la SMA rápida.
SHORT:
El precio debe estar POR DEBAJO de la SMA lenta.
Cuando una vela cierra en la zona de sobrecompra del RSI, la siguiente vela cierra fuera de la zona de sobrecompra y el precio de cierre está POR ENCIMA de la SMA rápida = abre SHORT.
Se cierra cuando una vela cierra POR DEBAJO de la SMA rápida.
*La estrategia de Larry Connor NO utiliza un Stop Loss o Take Profit fijo, como él dijo, eso reduce el rendimiento significativamente.
- Visual:
Ambas SMAs (rápida y lenta) se muestran en el gráfico.
Por defecto, la SMA rápida es de color aqua, la lenta cambia entre verde y rojo dependiendo de la "tendencia" (precio por encima de la SMA lenta = alcista, por debajo = bajista).
El RSI no puede mostrarse porque TradingView no permite mostrar tanto los indicadores superpuestos como los del panel, así que las velas obtienen un color ROJO cuando el RSI está en el área de SOBRECOMPRA y VERDE cuando están en el área de VENTA para ayudar a ello.
El fondo se colorea cuando se cumplen las condiciones y se va a abrir una posición, verde para LONGs rojo para SHORTs.
- Uso y recomendaciones:
Como se trata de una estrategia ya programada, ni siquiera hay que comprobar los indicadores, sólo hay que abrir y cerrar las operaciones tal y como muestra la estrategia en el gráfico.
La estrategia original utiliza una SMA de 5 periodos en lugar de 10, y 10/90 para los niveles de sobreventa/sobrecompra, esto ha sido optimizado después de las pruebas y los resultados, pero sé libre de cambiar la configuración y probarla por sí mismo.
Además, la estrategia original fue desarrollada para diario, pero parece funcionar mejor en 4H.
- Personalización:
Como siempre me gusta hacer personalizables todos los aspectos de mis indicadores/estrategias, indicadores, colores, etc., preguntar si notas que falta algo que debería ser configurable o si tienes alguna idea para optimizar la estrategia.

Uptrend and Oversold Index Swing Trading System 8H--- Foreword ---
The Overbought and Oversold Index Swing Trading System or short: I11L Hypertrend primarily uses money management Strategies, EMA and SMA and my momentum Ideas for trying to produce satisfactory Alpha over a timespan of multiple years.
--- How does it Work? ---
It uses 20 different EMA's and SMA's to produce a score for each Bar.
It will credit one Point If the EMA is above the SMA.
A high score means that there is a strong Uptrend.
Spotting the strong Uptrend early is important.
The I11L Hypertrend System trys to spot the "UPTREND" by checking for a crossover of the Score(EMA) / Score(SMA).
A low score means that there is a strong Downtrend.
Its quite common to see a reversal to the mean after a Downtrend and spotting the bottom is important.
The System trys to spot the reversal, or "OVERSOLD" state by a crossunder of the Score(EMA) / Score(SMA).
--- What can i customize? ---
-> Trading Mode: You can choose between two different trading modes, Oversold and Overbought(trend) and Random Buys to check if your systems Profitfactor is actually better then market.
-> Work with the total equity: The system uses the initial capital per default for Backtesting purposes but seeing the maximum drawdown in a compounding mode might help!
-> Use a trailing SL: A TSL trys to not lose too much if the trade goes against your TP
-> Lookbackdistance for the Score: A higher Lookbackdistance results in a more lagging indicator. You have to find the balance between the confirmation of the Signal and the frontrunning.
-> Leverage: To see how your strategie and your maximum Drawdown with the total equity mode enabled would have performed.
-> Risk Capital per Trade unleveraged: How much the underlying asset can go against your position before the TSL hits, or the SL if no TSL is set.
-> TPFactor: Your risk/reward Ratio. If you risk 3% and you set the ratio to 1.2, you will have a TP at 3 * 1.2 = 3.6%
-> Select Date: Works best in the 8H Timeframe for CFD's. Good for getting a sense of what overfitting actually means and how easy one can fool themself, find the highest Profitfactor setting in the first Sector (Start - 2012) and then see if the second Sector (2012 - Now) produces Alpha over the Random Buy mode.
--- I have some questions about the System ---
Dear reader, please ask the question in the comment Section and i will do my best to assist you.

rsisma imkind dailyrsi 14
sma 8
time fram : weekly and daily
rsi 14
sma 8
time fram : weekly and daily
rsi 14
sma 8
time fram : weekly and daily
rsi 14
sma 8
time fram : weekly and daily

Mix1 : Ema Cross + Trend Channel [Gu5] - BacktestBacktest of the indicator "Mix1: Ema Cross + Trend Channel "
Trend indicator, by the crossing of moving averages
SMA200 with a channel as a filter confirms the trend.
The crossing of two moving averages, give alert only in trend.

NSDT HAMA Candles STRATThis is a STRATEGY based on our popular HAMA Candles Indicator.
It is an "Always On" strategy, meaning it will stay in a Long position until the Short criteria shows up, and then it will close the Long position and immediately enter a Short position.
Since this is a strategy, we added a few more components. The most notable one is the grid at the top right that shows the statistics of whatever the current settings are. The user can change the MA lengths and see the potential results update in real time.
Since this is Always On and uses Moving Averages, we added an ADX setting to help filter our trades in a ranging/choppy market.
The settings will need to be adjusted to find the best fit for your instrument, chart time, and risk management plan.

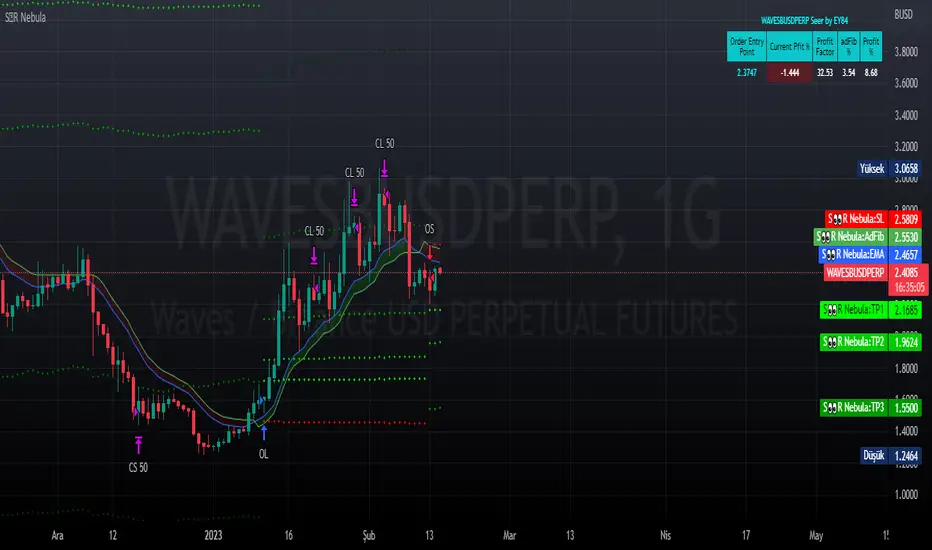
Seer by EY84This is a strategy based on Exponential Moving Averages or Volume Weighted Moving Averages against Adaptive fib resistance / support level and profit percentage which can be definetly defined by user and targeting small profits(profits will be raised by leverages).
In this strategy, there are predefined values which are collected one by one with statistical background and backtests. This gives an advantage to see which ratios are working better for each symbol.
Also this statistics are re-evaluated monthly and if there is a need they are goging to be changed with the help of libraries. Also IT IS RECOMMENDED TO USE IN HOURLY INTERVAL GRAPHICS!!!!
When we deep dive to strategy, it is based on profit percentages. it is similar to the MOST system. MOST only changes the way with default value of %2. But this hardcoded strategy is not working well with each Symbol.
So this is the point where Statistics are involved.
For Ex. while BTC is suits well with %2, it does not do wonders for RSR or RUNE which is 4-5% for each.
Library stores these values as a predefined options. Also it is allowed to change these predefined values within the settings of this strategy.
what is next ? Lets see how are we closing the positions.
Script checks cross of EMA / VWMA and adFib to decide open a position. In reversal / crosses, adFib line had been set to defined Fib. Percentage level. This sets the Full Position close / SL value for current order.
OK! we got the SL but how we get the profit ?
Now this is the place where Profit Percentage (PP) parameter involved. After the position opened it is waiting for PP to be reached. After PP had been reached, close signal had been raised for the HALF of the OPEN ORDER (with the BAR CLOSURE!!).
so tricky part has come here. Remaining position is still open and when "total available profit with remaining amount" had been reached to PP it wil raise the Close Half signal will be raised.
what happens to the SL position ? TWO possible scenarios will be raised here.
Case 1. Reversal on the adFib (short-to-long or long-to-short) will trigger full close signal.
Case 2. If the level drops the previous signal system will generate full close signal again.
Example 1:
Long Order Open : 100$
Half Close Signal : 110$
Case 1: adFib Reversal occurs : 105$ ==> Triggers Full Close Signal with Short Order.
Case 2: Price falls : 100$ ==> Only Triggers Full Close Signal.
Example 2:
Long Order Open : 100$
Half Close Signal : 110$
2. Half Close Signal : 121$
Case 1: adFib Reversal occurs : 115$ ==> Triggers Full Close Signal with Short Order.
Case 2: Price falls : 110$ ==> Only Triggers Full Close Signal.
Beside of these, strategy is also includes editable 4 EMA, 1 WMA, 1 AVWAP and Bollinger Bands Plotting (2.5x Multiplier) who wants to use them as a supportive statistics.
All feedbacks are welcome.
GEMA-Estrategia por neil-------------------
DESCRIPTION
GEMA-STRATEGY is a strategy generator based on SMA, EMA, WMA, RMA that considers elements such as ADX, DMI, RSI, stochastic, Stoploss, Takeprofit, angles and values at present point.
HOW DOES IT WORK
The component works as an assistant to which you configure the previous elements and you see the performance that it offers you, in such a way that you pass that configuration to GEMA-INDICATOR so that you can receive alerts and do visual trading with notifications or automated trading by sending messages to platforms like 3Commas.
WHY USE IT
The resource operates with one of the most important strategies in the market, which is the price tracking line, which means that if prices go up, we follow it, if prices go down, we follow it; in this way you do not need to make large investments as is often the case with pure BOTs, which require large reserves for security orders.
HOW TO USE IT
Press the "Indicators" option, go to the "Public Library" segment, write the name "GEMA-Estategia por Neil", double click on the record in question and you will have it added in your work panel, now, it only remains to use it and configure its parameters.
-------------------
DESCRIPCIÓN
GEMA-ESTRATEGIA en un generador de estrategias basado en SMA, EMA, WMA, RMA que considera elementos como ADX, DMI, RSI, Estocastico, Stoploss, Takeprofit, ángulos y valores a punto presente.
COMO FUNCIONA
El componente funciona como un asistente al que vas configurando lo elementos anteriores y vas viendo el rendimiento que te ofrece, de manera tal, que pases esa configuración a GEMA-INDICADOR para que puedas recibir alertas y hagas trading visual con notificaciones o trading automatizado enviando mensajes a plataformas como 3Commas.
POR QUÉ USARLO
El recurso opera con una de las estrategias mas importantes del mercado, que es la linea de seguimiento de precio, lo que significa que si los precios suben, lo seguimos, si los precios bajan, lo seguimos; de esta manera no necesita realizar grandes inversiones como suele ocurrir con los BOT puros, que exigen grandes reservas para las ordenes de seguridad.
COMO USARLO
Presione la opción "Indicadores", ubíquese en el segmento "Libreria Publica", escriba el nombre "GEMA-Estrategia por Neil", haga doble clic sobre el registro en cuestión y lo tendrá agregado en su panel de trabajo, ahora, solo resta usarlo y configurar sus paramertos.

MA&AOThat is quit simple strategy, which combines only two indicators: AO and MA. The logic of trades is also clear, when AO is bullish; slow ma is under the close price; fast ma > slow ma - buy.
