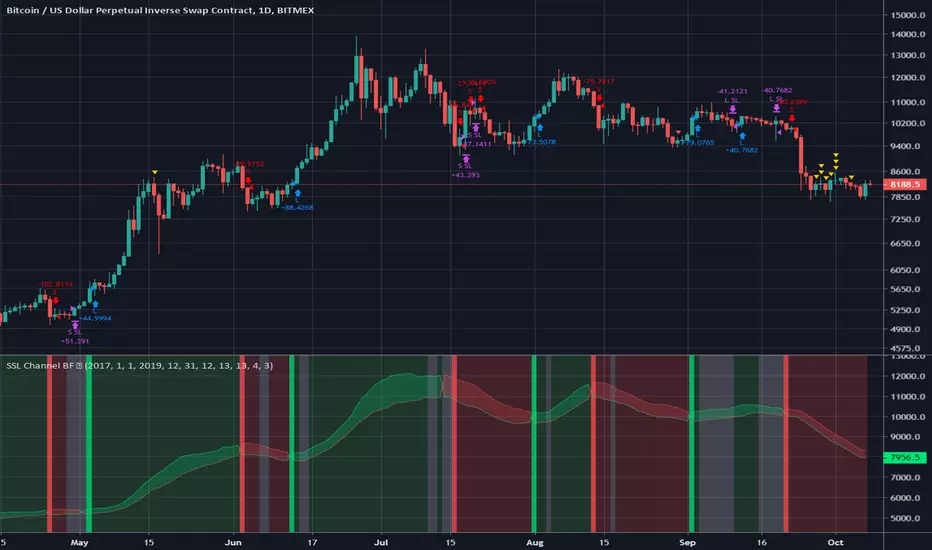
SSL Channel BFSSL Channel Close is a great all-rounder based on 2 Simple Moving Averages, one of recent Highs, one of recent Lows.
The calculation prints a channel on the chart consisting of 2 lines.
This strategy gives a Long signal when price closes above the top of these 2 lines and a Short signal when it closes below the bottom.
Trading in choppy sideways markets can compound losses so we avoid that here by using recent ATR to determine relative volatility and refrain from trading when the background is White.
We use a basic 3% stop loss.
Charted on XBT/USD Bitmex Daily chart.
INSTRUCTIONS
Green = long
Red = short
White Background= No trade
The way I have set this strategy up is that if we get stopped out but we are still in a green or red background, we re-enter. Closing the trade only occurs on an opposing signal or if we get stopped out.
단순 이동 평균 (SMA)

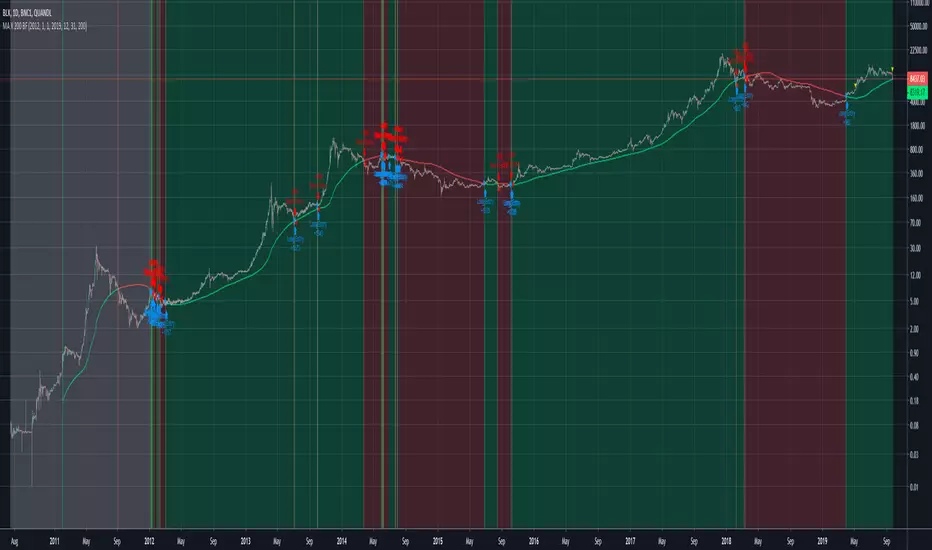
MA X 200 BFGo long when the price closes above the 200 SMA.
Go short when the price crosses under the 200 SMA.
Keep it simple.
MavCrossover v2Simple moving average crossover strategy with
SMA and EMA,
a time window and
the possibility to set the 2nd MA as a factor of the 1st one (to quick cycle through them)

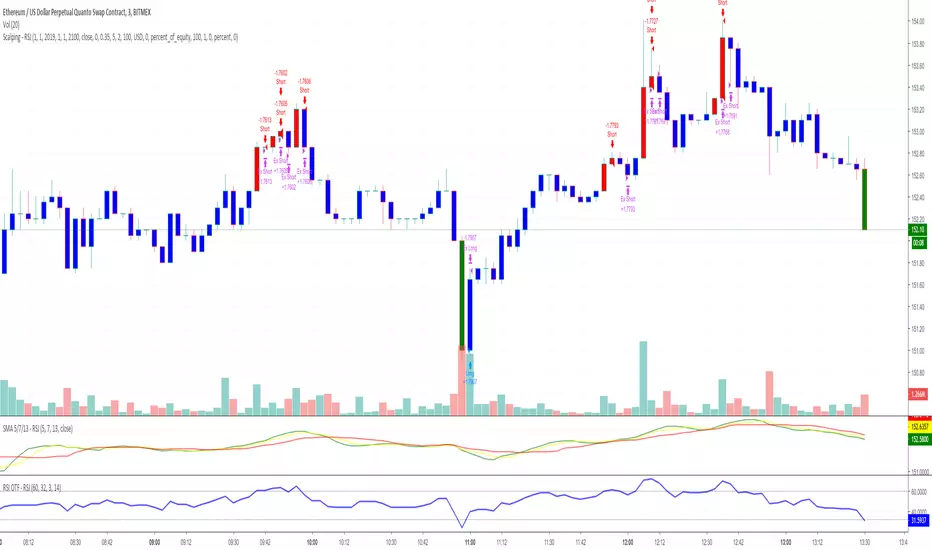
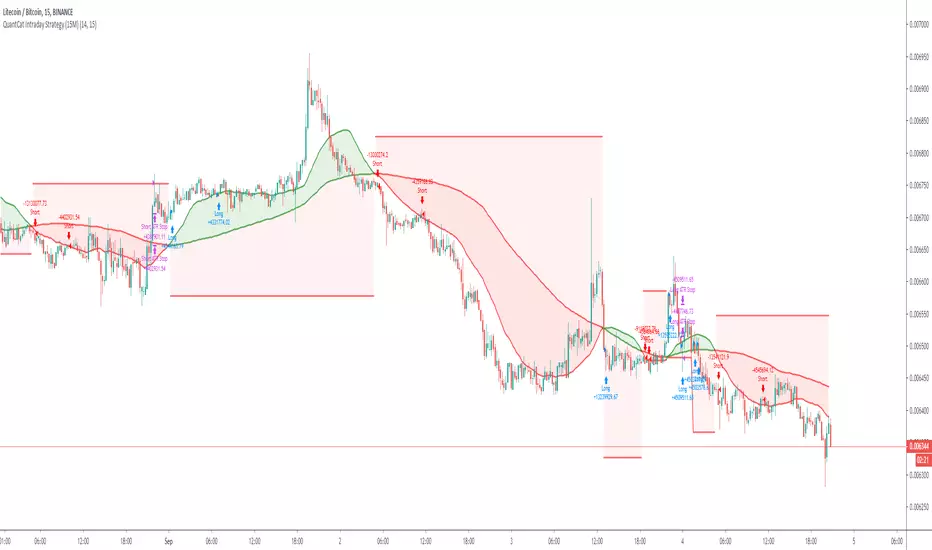
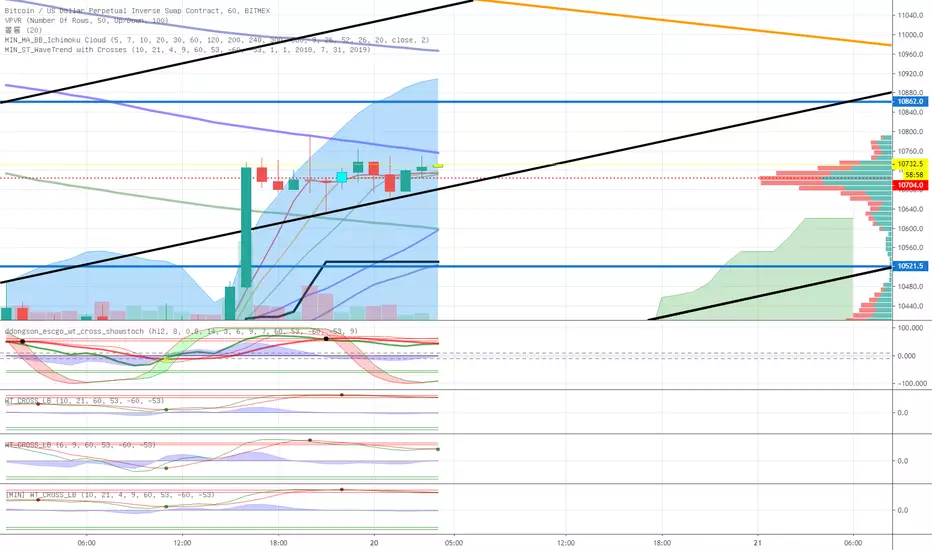
QuantCat Intraday Strategy (15M)QuantCat Intraday Strategy
This strategy is designed to be used on the 15 minute time frame, on liquid x/btc pairs and BTC/USD.
It works by having 2 moving averages, automatic stop loss calculation, and taking positions on MA crosses and MA zone bounces for confirmation.
Stoploss is so crucial to minimise any damage from huge unexpected candles, the strategies can just be used for entries as well, you don't have to stick to the exact formula- of the long and short system, but this by itself is profitable.
The system nets positive results on
-BTC/USD
-ETH/BTC
-LTC/BTC
-XRP/BTC
There is a small element of trend filtering also for the MA's, but I found adding it in actually hindered performance when testing and training the strategies unless it was using a loose value.
You can get live alerts for this strategy and speak to our developers by joining our server on discord! (Link in signature)
Cryptopians - MA Trading StrategySimple moving average trading strategy.
Based on:
10 MA
20 MA
Daily timeframe

2-Period RSI strategy (with filter)2-period RSI strategy backtest described in several books of the trader Larry Connors . This strategy uses a 2 periods RSI , one slow arithmetic moving average and one fast arithmetic moving average.
Entry signal:
- RSI 2 value below oversold level (Larry Connors usually sets oversold to be below 5, but other authors prefer to work below 10 due to the higher number of signals).
- Closing above the slow average (200 periods).
- Entry at closing of candle or opening of next candle.
Exit signal:
- Occurs when the candlestick closes above the fast average (the most common fast average is 5 periods, but some traders also suggest the 10 period average).
Entry Filter (modification made by me):
- Applied an RSI2 arithmetic moving average to smooth out oscillations.
- Entered only when RSI2 is below oversold level and RSI2 moving average is below 30.
* NOTE: In the stocks that I evaluate daily the averages of 4 and 6 periods work very well as a filter.
Comments:
This strategy works very well in Daily charts but can be applied in other chart times as well. As this is a strategy to catch market fluctuations, it presents different results with different stocks.
I have been applying this strategy to the stocks of the Brazilian market (BOVESPA) and have enjoyed the result. Every day I evaluate the stocks that are generating entry signals and choose which one to trade based on the stocks with the highest Profit Value.
The RSI 2 averaging filter probably will reduce profit of the backtests because reduces the number of signals, but the Profit Value will usually increase. For me this was a good thing because without the filter, this strategy usually shows more signals than I have capital to allocate.
Before entering a trade I look at which fast average the paper has the highest Profit Value and then I use this average as my output signal for that trade (this change has greatly improved the result of the outputs).
This strategy does not use Stop Loss because normally Stop Loss decreases effectiveness (profit). In any case, the option to apply a percentage Stop Loss if desired is added in the script. As the strategy does not use stop, extra caution with risk management is advisable. I advise not to allocate more than 20% of the trade capital in the same operation.
I'm still studying ways to improve this strategy, but so far this is the best setup I've found. Suggestions are always welcome and we can test to see if they improve the backtest result.
Good luck and good trades.
================================================
Backtest das estratégia do IFR de 2 períodos descrita em varios livros do trader Larry Connors . Esta estratégia usa um IFR de 2 períodos, uma média movel aritmética lenta e uma média movel aritmética rápida.
Sinal de entrada:
- Valor do IFR 2 abaixo do nível de sobrevenda (Larry Connors usualmente define sobrevenda sendo abaixo de 5, mas outros autores preferem trabalhar abaixo de 10 devido ao maior número de sinais).
- Fechamento acima da média lenta (200 períodos).
- Realizado a compra no fechamento do candle ou na abertura do candle seguinte.
Sinal de saída:
- Ocorre quando o candle fecha acima da média rápida (a média rápida mais comum é a de 5 períodos, mas alguns traders sugerem também a média de 10 períodos).
Filtro para entrada (modificação feita por mim):
- Aplicado uma média móvel aritmética do IFR2 para suavisar as oscilações.
- Realizado a entrada apenas quando o IFR2 está abaixo do nível de sobrevenda e a média móvel do IFR2 está abaixo de 30.
*OBS: nos ativos que avalio diariamente as médias de 4 e 6 períodos funcionam muito bem como filtro.
Comentários:
Esta estratégia funciona muito bem no tempo gráfico Diário mas pode ser aplicada tambem em outros tempos gráficos. Como trata-se de uma estratégia para pegar oscilações do mercado, ela apresenta diferentes resultados com diferentes ativos.
Eu venho aplicando esta estratégia nos ativos do mercado brasileiro (BOVESPA) e tenho gostado do resultado. Diariamente eu avalio os papeis que estão gerando entrada e escolho qual irei realizar o trade baseado nos papeis que apresentam maior Profit Value.
O filtro da média do IFR 2 reduz o lucro nos backtests pois reduz também a quantidade de sinais, mas em compensação o Profit Value irá normalmente aumentar. Para mim isto foi algo positivo pois, sem o filtro, normalmente esta estratégia apresenta mais sinais do que possuo capital para alocar.
Antes de entrar em um trade eu olho em qual média rápida o papel apresenta maior Profit Value e então eu utilizo está média como meu sinal de saída para aquele trade (esta mudança tem melhorado bastante o resultado das saídas).
Está estratégia não utiliza Stop Loss pois normalmente o Stop Loss diminui a eficácia (lucro). De qualquer maneira, foi acrescentado no script a opção de aplicar um Stop Loss percentual caso seja desejado. Como a estratégia não utiliza stop é aconselhável um cuidado redobrado com o gerenciamento de risco. Eu aconselho não alocar mais de 20% do capital de trade em uma mesma operação.
Ainda estou estudando formas de melhorar esta estratégia, mas até o momento está é a melhor configuração que encontrei. Sugestões são sempre bem vindas e podemos testar para verificar se melhoram o resultado do backtest.
Boa sorte e bons trades.

TMA Strategy v2.2This is a backtest of the TMA Indicator v2.2 using default parameters.
Backtest window: Jan 1, 2015 - Jul 21, 2019 (today)
For more information on the indicator and strategy seen here please take a look at this backtest:
For paper trading only. Do not use on real markets. Never make investment decisions based on this indicator alone.

Double 7's StrategyStrategy described in the book "Short Term Trading Strategies that Work", written by Larry Connors and Cesar Alvarez.
It is the simplest strategy I know and has only 3 rules:
- Price must be above the arithmetic moving average of 200 periods.
- Buy when the price closes below the closing of the last 7 days.
- Sale when the price closes above the closing of the last 7 days.
Simple as it may seem, this strategy works very well in some stocks and/or graphical times (in some stocks it overcomes many RSI 2 strategies). It was developed for the daily chart and does not usually work well on weekly or monthly charts, but can be used for day trades if the back-test proves to be favorable.
If you want, you can change the input and output rules by setting other values for the input or output period and thus find more positive results for specific stocks.
There is no stop loss because in tests the stop loss usually reduces the gains of the strategy.
Good luck and good trades.
================================
Estrategia descrita no livro "Short Term Trading Strategies that Work", escrito por Larry Connors e Cesar Alvarez.
É a estratégia mais simples que eu conheço e tem apenas 3 regras:
- Preço deve estar acima da média móvel aritmética de 200 períodos.
- Compre quando o preço fechar abaixo do fechamento dos ultimos 7 dias.
- Venda quando o preço fechar acima do fechamento dos ultimos 7 dias.
Por mais simples que pareça, esta estratégia funciona muito bem em alguns papeis e/ou tempos gráficos (em alguns papeis a mesma supera muitas estratégias pelo IFR2). A mesma foi desenvolvida para o gráfico diário e normalmente não funciona muito bem em gráficos semanais ou mensais, mas pode ser utilizado no intraday caso o backtest se mostre favorável.
Caso você queira, é possível alterar a regra de entrada e saída definindo outros valores para o período de entrada ou saída e assim encontrar resultados mais positivos para cada papel.
Não existe stop loss pois nos testes normalmente o stop loss reduz os ganhos da estratégia.
Boa sorte e bons trades.

[M10] Quad MA Trend ScalperFour adjustable moving averages set in order to produce buy and sell signals, works best on smaller timeframes from my backtesting, 10M - 30M seems optimal for scalping.
The idea behind this script is to only enter positions that are following the trend in order to minimise drawdown and decrease risk when using leverage.
The script will only enter long positions when MA crossover occurs above the Long MA 2.
The script will exit a long position when MA Short crosses below Long MA 1.
The script will only enter short positions when MA cross under occurs below the Long MA 2.
The script will exit a short position when MA Short crosses below Long MA 1.

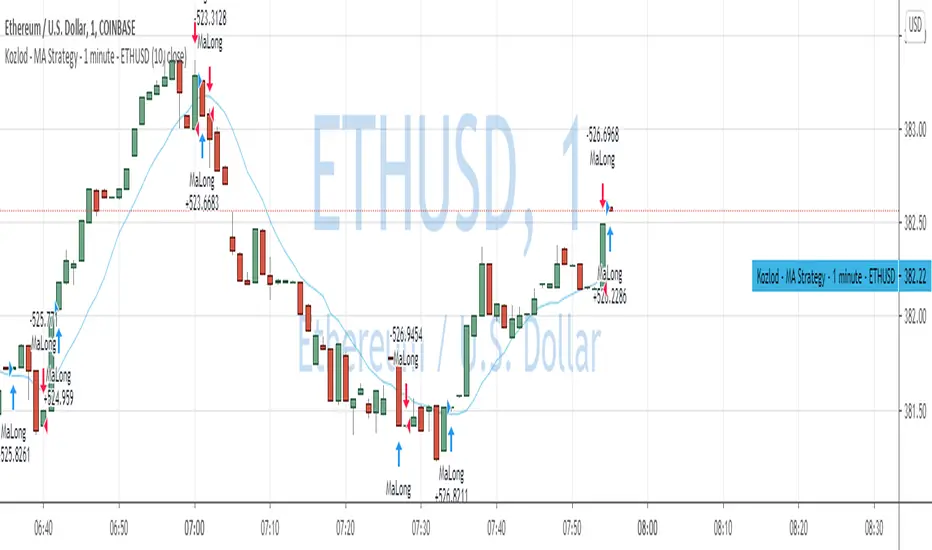
QuantNomad - MA Strategy - 1 minute - ETHUSDInteresting performance for simple MA strategy on 1m ETHUSD. I used only close price and 15 SMA in it.
Performance is 55% over 10 days with a drawdown of only 3.5%.
Percent profitable is only 30% with almost 2k trades.
For sure this won't work as a standalone strategy, with 2k trades commission and slippage will destroy all your PNL but it can be a pretty good base for a more complicated strategy with good filters.
And remember:
Past performance does not guarantee future results.

Custom Band Strategy1. Trend
if ema200 > ema30 Long entry only
else Short entry only
2. Custom Band
Upper band = sma(period) + max(close, period) * multiplier
Lower band = sma(period) - max(close, period) * multiplier
Multiplier can be either 1.3 or 1.1 depending on the trend.
(If trend is long, upper band's factor would be 1.3, lower band be 1.1)
2. Long entry condition
- Cross over the lower band and band width is greater than (close price)*2.2%(assume this band width as an expected ROE)
- Previous candle change rate((close-open)/open*100) is less than 3%.
3. Short entry condition
- Cross under the upper band and band width is greater than (close price)*2.2%
- Previous candle change rate is less than 3%.
4. Long/Short exit condition
- cross over/under the lower/upper band and roe is higher than 2%.
5. Stop/Target condition
- Target 10%, Stoploss 3%
- Previous candle change rate is higher than 3%.
Most variables can be set manually.
Test period changeable.


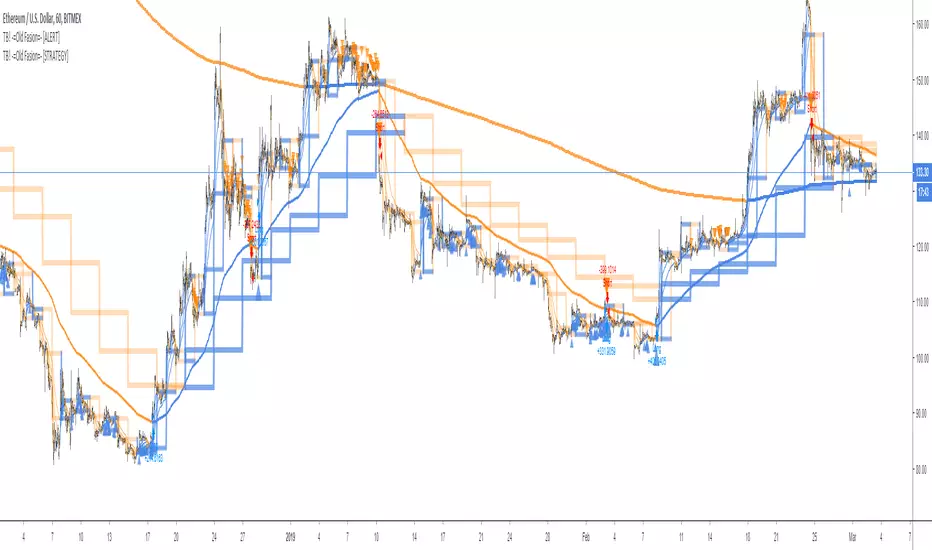
TB! -=Old Fasion=- [STRATEGY]This is the Strategy version of;
A Good Old Fasion sma/rma trading done as it should be done!
Great for hedging
- Bitfinex
- Poloniex
- Bitmex
- Deribit
No repaint, no false alerts or any other kind of nonsense.
With this strategy version you can determine the most optimal settings.
Those optimal setting you copy into the alert edition and of you go, sending alerts to GunBot, Haasbot, Dragonbot, Trexen, Autoview or whatever makes you happy.
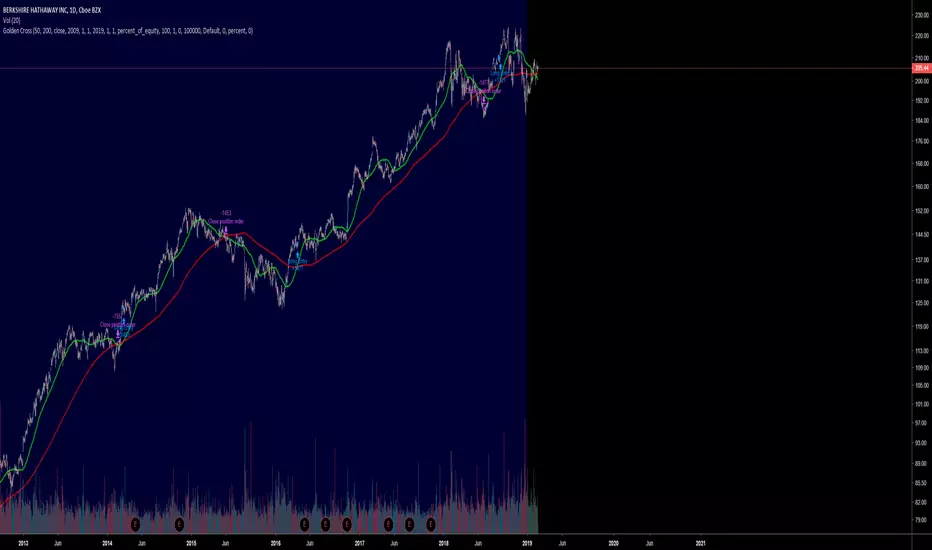
Dumb Strategy 2 - Golden CrossThe Golden Cross is one of the simplest market indicator who helps long term investors to entry a position.
With that in mind, I made a very easy to understand backtest showing how much we could earn if we entered in a Golden Cross and exit when Death Cross happening.
Take this code and try in your favorite market.
Of course, never use only this indicator to trade.
Simple Buy and Sell SignalsUpdated from version 10.4 to version 12
Feel free to use this. I made this for my own strategy and to make my life easier spotting entries. I'm still currently learning pine script so it's not perfect. Currently the exits are based on trend reversal (not recommended) so I suggest you pick your own exits and bank those pips.
Criteria; (Tested on these Settings)
NZDJPY
5 Min Timeframe

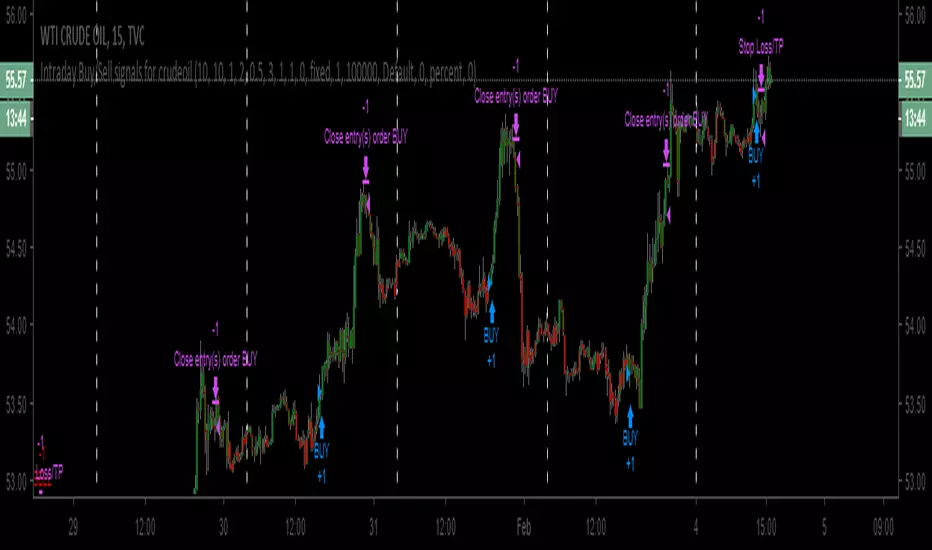
Intraday Buy/Sell signals for CrudeoilHi Everyone,
This is higly tuned intraday Buy/Signal generator for Crudeoil. It works on any time frames below 30 mins. But, the best setting is 15 mins.
How to use:
1. Just, apply this strategy to your crudeoil WTI instrument
2. Set your time frame to 15 mins
3. Buy the instrument whenever buy signal generates / Sell the intrument whenever buy singal generates
4. Strategy itself has 0.5% stop loss generating signals. But, create stop loss of 0.5% after buying/selling the instrument
5. Finally, whenever close signals triggers, just close the trade.
Note: Please try with only one lot at the beginning. If everything goes well after testing, mulitple lot can be used.
Disclaimer:
This strategy is for testing purpose only. Any profit/loss to the user's capitla is subject to market risk. And, the creator of this script is no where responsible.
SSR Srategy V2SSR strategy is a strategy evolved from Stochastic RSI fast and slow line crossing strategy and has the advantage of being adjustable with high degree of freedom. The full name of SSR is Smooth Stochastic RSI .
This indicator provides the following three trading mechanisms:
1. Enter each time the D and smooth D lines cross
2. Only enter when the D line and the smooth D line cross outside the threshold, and reverse trade when the next time cross outside the threshold.
3. Only enter when the D line and the smooth D line cross outside the threshold, and close the position at the next cross.
It also provides the following two functions to help u evaluate trading profit:
1. Select specific time test.
2. Stop loss setting.
P.S. If the 'Order’s limit was reached’ message appears, you can use the specific time test function to narrow the test range.

MACD/EMA Long StrategyThis incredibly simple strategy uses a combination of the 20 EMA and bullish/bearish MACD crosses as a low risk method of getting in and out of markets.
Depending on whether the market is above or below the 200 SMA, the script determines if the market is in bullish or bearish territory. Above the 200 SMA, the script will ignore the 20 EMA as a buy condition and buy solely on the confirmation of a bullish MACD cross upon the close of a candle. In this bullish market, the script will only enable the sell condition if both the MACD is bearish AND a close below the 20 EMA occurs. This is to reduce the chances of the script selling prematurely in the event of a bearish MACD cross, if the market is still in overall bullish territory.
When the market is below the 200 SMA, the confirmation occurs in the opposite direction. The buy condition will only be met if both the MACD is bullish AND a close above the 20 EMA occurs. However, the sell condition ignores the 20 EMA and will sell solely on the confirmation of a bearish MACD cross upon the close of the candle.
This strategy can be used in both bullish and bearish markets. This conservative strategy will slightly underperform in a bull market, with the sell condition occasionally being met and then potentially buying back higher. However, it will successfully get you out of a turning market and automatically switch into a more 'risk-off' mentality during a bear market. This strategy is not recommended for sideways markets, as trading around the 20 EMA coupled with a relatively flat MACD profile can cause the strategy to buy the peaks and sell troughs easily.