boot2thrill - EMA 20/50 & SMA 50/200//Notes:
//Version by boot2thrill on 05-20-2019.
//Version includes combined Exponential Moving Averages EMA 20/50 and Simple Moving Averages SMA 50/200.
//***Recommended use on BTCUSD 1h/4h/1d chart.***
스크립트에서 "黄金近20年走势"에 대해 찾기

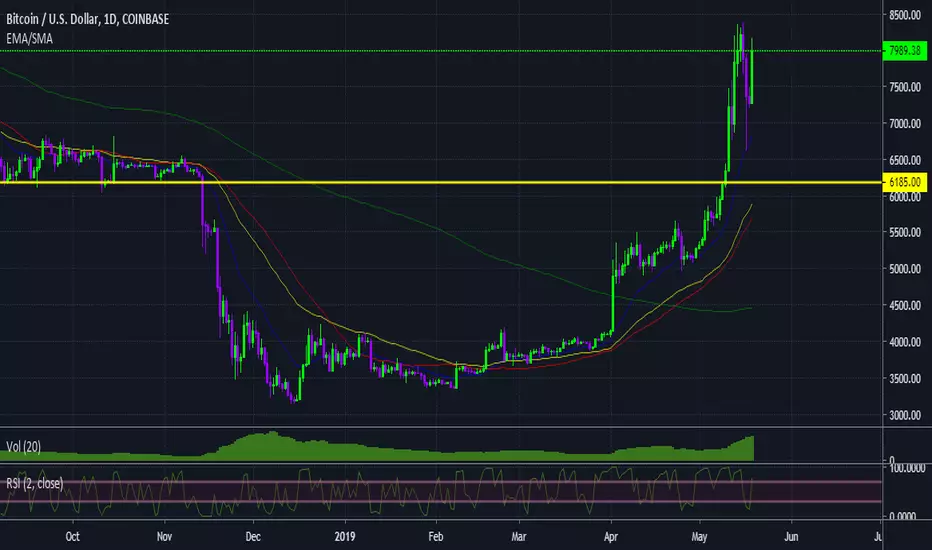
boot2thrill - EMA 20/50 & SMA 50/200//Notes:
//Version by boot2thrill on 05-20-2019.
//Version includes combined Exponential Moving Averages (EMA) for 20/50 periods and Simple Moving Averages (SMA) for 50/200 periods.
//***Recommended use on BTCUSD 1h/4h/1d chart.***
Combo Backtest 123 Reversal and 2/20 EMA This is combo strategies for get
a cumulative signal. Result signal will return 1 if two strategies
is long, -1 if all strategies is short and 0 if signals of strategies is not equal.
First strategy
This System was created from the Book "How I Tripled My Money In The
Futures Market" by Ulf Jensen, Page 183. This is reverse type of strategies.
The strategy buys at market, if close price is higher than the previous close
during 2 days and the meaning of 9-days Stochastic Slow Oscillator is lower than 50.
The strategy sells at market, if close price is lower than the previous close price
during 2 days and the meaning of 9-days Stochastic Fast Oscillator is higher than 50.
Secon strategy
This indicator plots 2/20 exponential moving average. For the Mov
Avg X 2/20 Indicator, the EMA bar will be painted when the Alert criteria is met.
Please, use it only for learning or paper trading. Do not for real trading.
WARNING:
- For purpose educate only
- This script to change bars colors.

Combo Strategies 123 Reversal and 2/20 EMA This is combo strategies for get
a cumulative signal. Result signal will return 1 if two strategies
is long, -1 if all strategies is short and 0 if signals of strategies is not equal.
First strategy
This System was created from the Book "How I Tripled My Money In The
Futures Market" by Ulf Jensen, Page 183. This is reverse type of strategies.
The strategy buys at market, if close price is higher than the previous close
during 2 days and the meaning of 9-days Stochastic Slow Oscillator is lower than 50.
The strategy sells at market, if close price is lower than the previous close price
during 2 days and the meaning of 9-days Stochastic Fast Oscillator is higher than 50.
Secon strategy
This indicator plots 2/20 exponential moving average. For the Mov
Avg X 2/20 Indicator, the EMA bar will be painted when the Alert criteria is met.
Please, use it only for learning or paper trading. Do not for real trading.

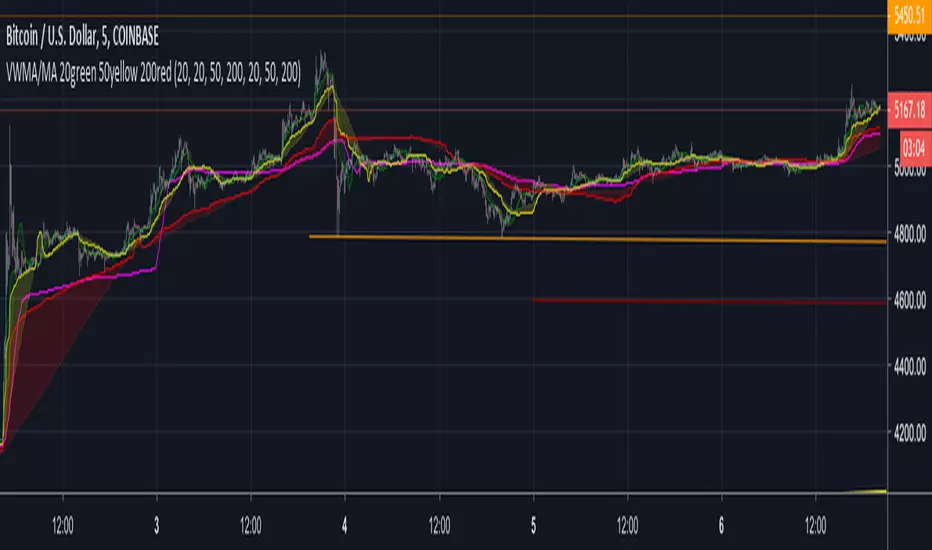
VWMA : 20 50 200Plots 20, 50 and 200 tick Volume Weighted MA and Simple MA.
The Volume Weighted MA tends to move before the SMA. I am seeing significant price movements on crypto charts near 50 VWMA crosses. As well, the 20-50 VWMA crosses. When the thicker lines ( VWMA ) are above or below the same color SMA, this divergence can also signal changes in trends.
This is my first script and likely be updated. Feedback is welcome.
5-8 EMA Cross with added 20 EMAThis is a simple EMA cross script to get into trades early using a 5/8 EMA cross but also allows you to filter out risky trades using the 20 EMA. For long trades the cross is not a valid signal if it occurs below the 20 EMA and vice versa.

EMA CROSS (20,55) S6Hthis indicator gives you a buy and sell signal when the (20) ema crosses (50) ema then that is an buy signal
when the (50) ema crosses (20) ema then that is an sell signal
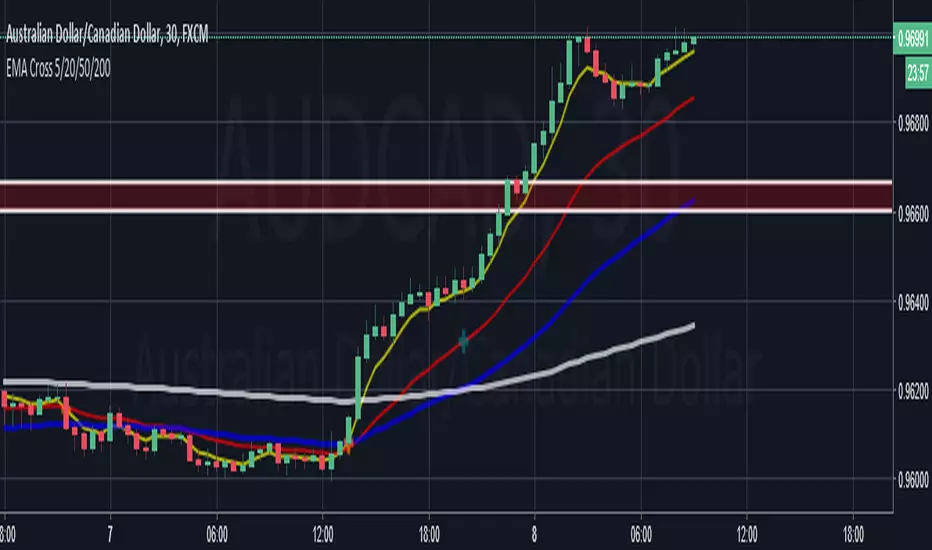
Delphiguy EMA Cross 5/20/50/200A simple Indicator for EMA 5, 20, 50, 200.
It shows gives potential trades on the crossover of the 5/20, and 50/200
It also shows price trend via the 200EMA
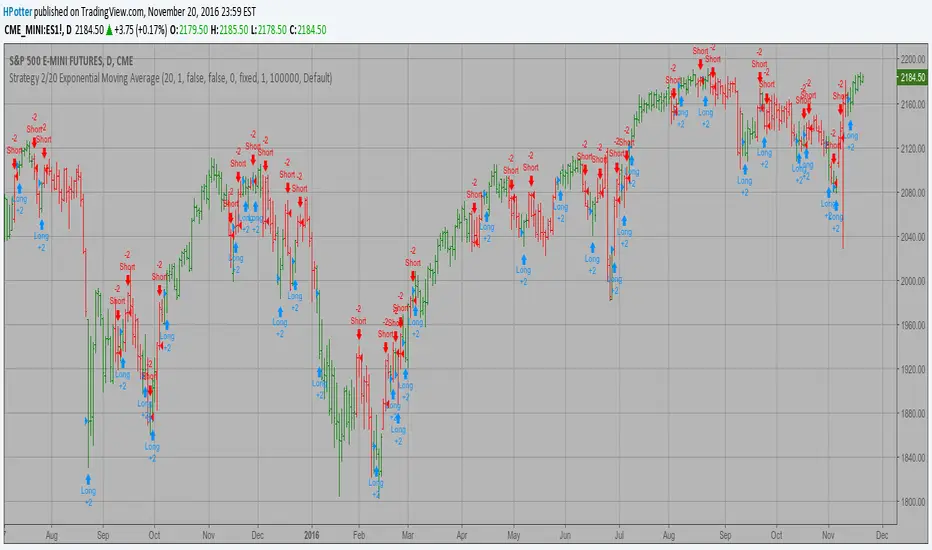
2/20 Exponential Moving Average Backtest Strategy
This indicator plots 2/20 exponential moving average. For the Mov
Avg X 2/20 Indicator, the EMA bar will be painted when the Alert criteria is met.
You can use in the xPrice any series: Open, High, Low, Close, HL2, HLC3, OHLC4 and ect...
You can change long to short in the Input Settings
Please, use it only for learning or paper trading. Do not for real trading.

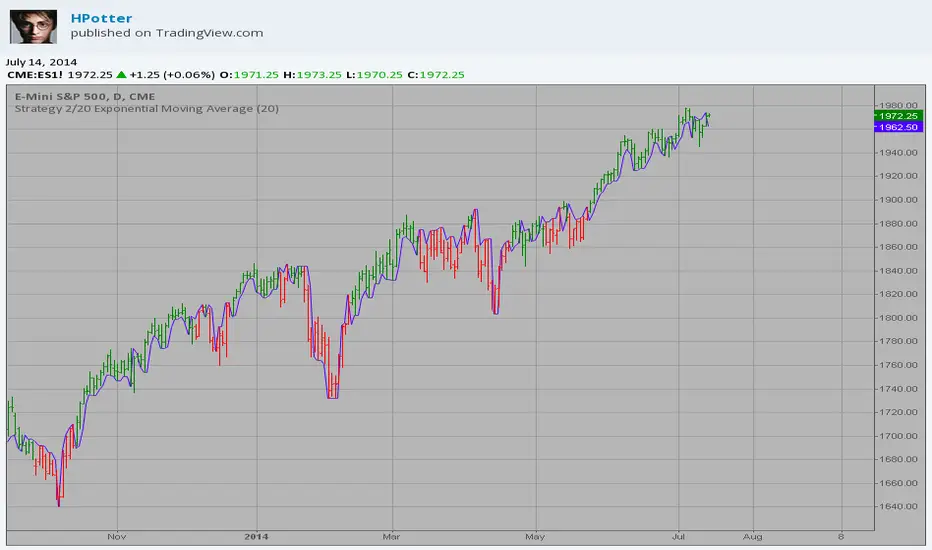
2/20 Exponential Moving Average StrategyThis indicator plots 2/20 exponential moving average. For the Mov
Avg X 2/20 Indicator, the EMA bar will be painted when the Alert criteria is met.
Please, use it only for learning or paper trading. Do not for real trading.
Trend MA 20Simple to use for anyone trading a 20 length moving average.
Crossover is signaled once 20 MA crosses 1 MA at close of selected time interval.

Strategy 2/20 Exponential Moving Average Strategy.
This indicator plots 2/20 exponential moving average. For the Mov
Avg X 2/20 Indicator, the EMA bar will be painted when the Alert criteria is met.
You can use in the xPrice any series: Open, High, Low, Close, HL2, HLC3, OHLC4 and ect...
2/20 Exponential Moving Average This indicator plots 2/20 exponential moving average. For the Mov
Avg X 2/20 Indicator, the EMA bar will be painted when the Alert criteria is met.
You can use in the xPrice any series: Open, High, Low, Close, HL2, HLC3, OHLC4 and ect...

EMA 9/20/200This indicator plots three Exponential Moving Averages (EMAs) on the chart: a short-term 9-period EMA in red, a medium-term 20-period EMA in orange, and a long-term 200-period EMA in blue. It's useful for identifying trends, crossovers, and potential support/resistance levels. Overlay it on any timeframe for stocks, forex, or crypto.

6/20 EMA Crossover MarksPuts a green arrow or red arrow at the bottom of the chart when the 6 period EMA crosses above (or below) the 20 period EMA.
In settings you can move the arrow marks to be at the bar etc.
This is a simplified way to see moving average convergence/divergence crossovers.

6x EMA Set (5/20/50/100/200/300)This Pine Script indicator utilizes six Exponential Moving Averages (5, 20, 50, 100, 200, and 300 EMA) to visualize market trends and support/resistance levels across multiple timeframes on a single chart. The code is highly customizable, allowing the user to input and adjust the period length and color for each EMA directly within the indicator settings. The calculation engine uses Pine Script v5's optimized ta.ema() function to compute each average based on the closing price, with the EMA formula naturally weighting recent price action more heavily. This multi-layered structure enables the trader to quickly compare short-term momentum (Fast EMAs) against long-term structural trends (Slow EMAs).

10/20 EMA 50/100/200 SMA — by mijoomoCreated by mijoomo.
This indicator combines EMA 10 & EMA 20 with SMA 50/100/200 in one clean package.
Each moving average is toggleable, fully labeled, and alert-compatible.
Designed for traders who want a simple and effective multi-MA trend tool.

10/20 EMA 50/100/200 SMA — by mijoomoCreated by mijoomo.
This indicator combines EMA 10 & EMA 20 with SMA 50/100/200 in one clean package.
Each moving average is toggleable, fully labeled, and alert-compatible.
Designed for traders who want a simple and effective multi-MA trend tool.

4H EMA 5/10/20/60 + 1H 60EMA Rebound Signals + Sou4H EMA 5/10/20/60 + 1H 60EMA Rebound Signals + Sou
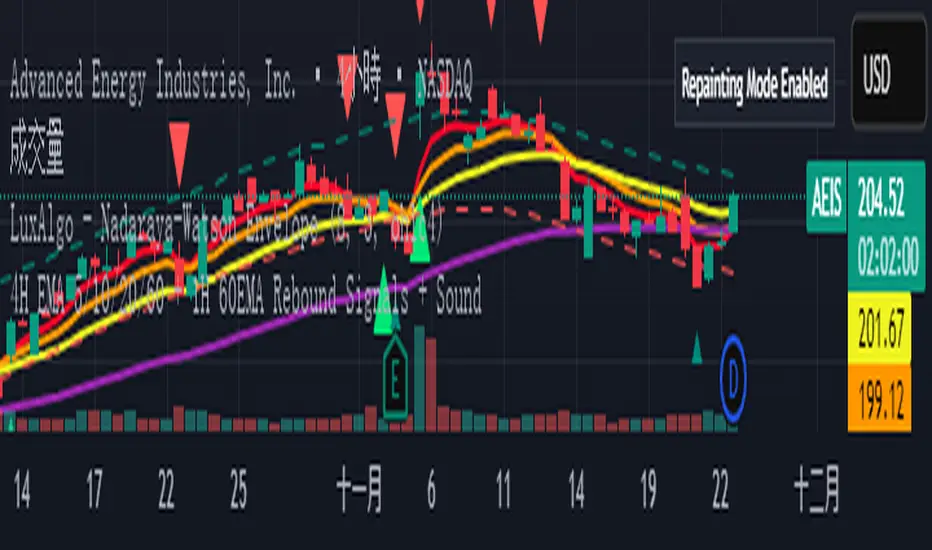
Simple Moving Averages (5, 10, 20, 60, 120, 200SMA for different time frames.
Covers 5, 10, 20, 60, 120, 200 sma units

9/20 EMA Trend indicator Fill for daytrading fills a color in between the lines of the 9 and 20 EMA to show trend easily

Vertical Lines: 5, 20, 50, 200 Days Back - 30 minutesVerticals lines to indicate 5, 20, 50, and 200 day marks on a 30 minute chart. Used in Swing trading with multi-timeframe approach to mark the levels.
Generated using Claude.
