[Delphi] RSI - Dynamic Movement Sys - Volume Oscil - Pista CicCopyright by Delphi v1.0 05/07/2018 - 12/07/2018
RSI - Dynamic Movement System - Volume Oscillator - Pista Ciclica
Follow me for updates and strategies
05/07/2018 Added Pista Ciclica
05/07/2018 Added RSI
09/07/2018 Added ADX - Dynamic Movement System
12/07/2018 Added Volume Oscillator
스크립트에서 "跨境通12月4日地天板"에 대해 찾기

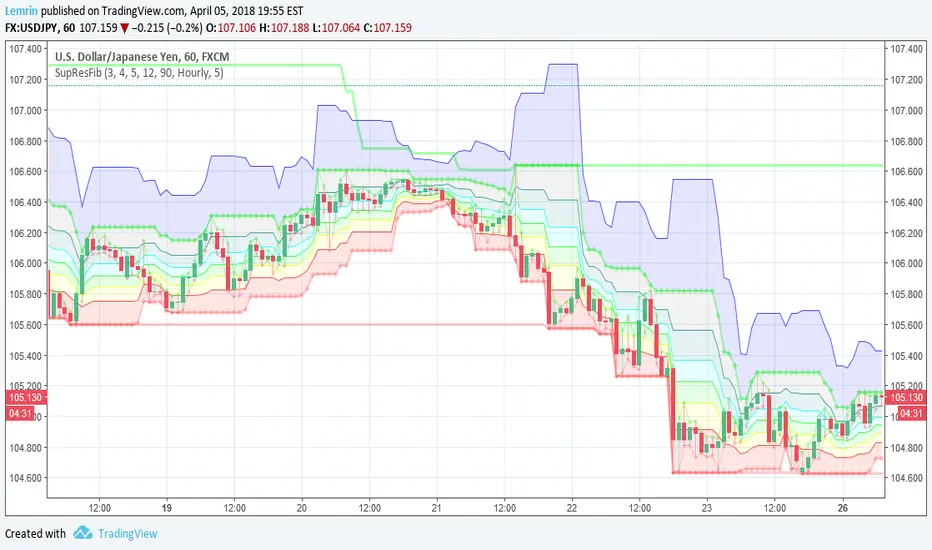
Automatic Support, Resistance, Fibonacci LevelsThis indicator plots absolute high and low values for up to five completely adjustable time periods (in months, weeks, days, hours, minutes) and optionally calculates the Fibonacci levels on the pair of absolutes of your choice, ascending or descending, and mimics the shading available in the built-in Fib charting tools (e.g. retracement).
Here are a few screenshots of the same chart with various options selected.
3-Month, 4-Week, and 5-Day absolutes with 3-Monthly Fib plotted:
The same chart with 4-Weekly Fib:
The same chart with 5-Daily Fib:
5-Day, 12-Hour, 90-Minute absolutes with 12-Hourly Fib:
Zoomed in, on a 30-minute interval, with 90-minute Fib:
With descending ("inverted") 90-minute Fib:
I started putting this together for Vazzyb, who was looking for a way to automate plotting horizontal support and resistance levels for monthly, weekly, and daily extremes, and then I added additional features as they occurred to me. Special thanks to Paaax, who suggested I add Fib levels.
I am leaving the code open, so you may feel free to grab snippets you like and use them for your own purposes. Of particular interest may be my custom "calc_fib()" function, which accepts any series pair, as well as a Boolean indicating whether to invert, and returns an array with each of the major Fibonacci levels: .
If anyone likes this enough to feel generous, please feel free:
BTC
3KmFchJ18QvMzAJKDcFQXvyK9p1EHWQdhP
BCH
qqtrw64ptuwprk5vtj3z8qwkvh3v0jawxq7khqng7x
ETH
0x9b51361A278910Ba3945C7519C9f0FA8a77df18d
LTC
MDeWWsP7XCG2zQuZ2dYALZXQ52u2qkc8fh
P.S. If you want the time lengths to be as close to accurate as possible, don't forget to change the number of days per week when using for cryptocurrency!
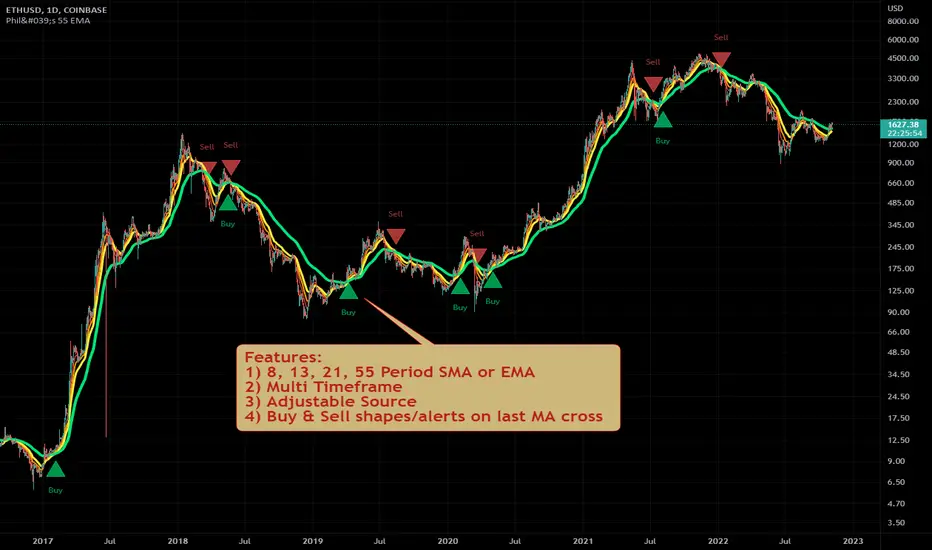
Philakone 55 EMA Swing Trading StrategyThis strategy was inspired by Philkone Crypto's "Lesson 12: Let's Learn Advanced 55 EMA Strategy" video.
steemit.com
Supports Buy and Sell Condition alerts and displays arrows on the chart.
Ichimoku Kinko Hyo + HULL-MA_X + MacDThe Ichimoku Kinko Hyo system includes five kinds of signal, of which this strategy uses the most recent of ones i.e. Tenkan Sen / Kijun Sen Cross and price crosses the Kijun Sen. As the Chikou Span, Senkou Span A and Senkou Span B are shifted into the past/future, the trigger signals will be only be used for visual confirmation and not part of the strategy.
The Tenkan Sen, also known as the Turning or Conversion line, is a moving average of the highest high and lowest low over the last 9 periods in this strategy.
The Kijun Sen, also known as the Standard or Base line, is a moving average of the highest high and lowest low over the last 24 periods in this strategy.
The Chikou Span, also known as the Lagging line, is the closing price plotted 24 periods behind in this strategy.
The Senkou Span A, also known as the 1st leading line, is a moving average of the Tenkan Sen and Kijun Sen and is plotted 24 periods ahead in this strategy.
The Senkou Span B, also known as the 2nd leading line, is a moving average of the highest high and lowest low over the last 51 trading days is plotted 24 periods ahead in this strategy.
Moving average convergence divergence (MaCD) is a trend-following momentum indicator that shows the relationship between two moving averages of prices. The MaCD is calculated in this strategy by subtracting the 24-day exponential moving average (EMA) from the 12-day EMA. A nine-day EMA of the MACD, called the "signal line", aMaCD in this case, is then plotted on top of the MaCD. In this strategy, MaCD/ aMaCD Cross is functioning as a trigger for buy and sell signals.
As with most technical analysis methods, Ichimoku is likely to produce frequent conflicting signals in non-trending markets, So in addition to Ichimoku Kinko Hyo, the Hull MA is popular amongst some day traders, as the indicator which in combination with MaCD attempts to give an accurate signal by eliminating lags and improving the smoothness of the line.
Alan Hull, developed this moving average indicator and hence it’s called the Hull MA.
Now, let’s dissect how the Hull moving average is calculated.
The Hull MA involves the weighted moving average (WMA) in its calculation.
First, calculate the WMA with period (n / 2) and multiply this by 2. Remember ‘n’ is the time period configurable based on the trader’s requirement. The default setting is 12 periods in this strategy, fast Hull MA crossing slow Hull MA will generate a circle on charts.
Second, calculate the WMA for period “n” and subtract if from the first step. Thirdly, calculate the weighted moving average with period sqrt (n) using the data from the second step. You can take a look at the below formula:
Hull MA= WMA (2*WMA (n/2) − WMA (n)), sqrt (n))
The Hull MA Cross in combination with Tenkan Sen / Kijun Sen Cross and MaCD tries to give an accurate signal by eliminating lags and improve the smoothness of price activity. Please note that price trends can and do change often, so your readings of the charts and this trading system should be probabilistic, rather than predictive.

Pullback Trading Tool R5-65 by JustUncleLBy request this is an updated version of the "PullBack Trading Tool": removes experimental "OCC" channel, added option to display ribbons or just single moving average lines, added alert arrows for "PB" exits, added alertcondition for TV alarm subsystem, added some extract options for Pivot points and general cleanup of code.
Description:
This project incorporates the majority of the indicators needed to analyse and trade Trends for Pullbacks, swings and reversals.
Incorporated within this tool are the following indicators:
1. Major industry (Banks) recognised important EMAs in an EMA Ribbon:
Lime = EMA5 (Optional Display)
DodgerBlue = EMA12 (Optional Display)
Red = EMA36 (Optional display)
Green = EMA89
Blue = EMA200
Black = EMA633
2. The 5 EMA (default) High/Low/Close Price Action Channel (PAC), the PAC channel display is disabled by default.
3. Optionally display Fractals and optional Fractal levels
4. Optional HH, LH, LL, HL finder.
5. Optional Buy/Sell "PB" exit Alerts with Optional 200EMA filter.
6. Coloured coded Bar high lighting based on the PAC:
blue = bar closed above PAC
red = bar closed below PAC
gray = bar closed inside PAC
7. Alert condition sent to TradingView's Alarm subsystem for PB exits.
8. Pivot points with optional labels.
9. EMA5-12 Ribbon is displayed by default.
10.EMA12-36 Ribbon is displayed by default
Set up and hints:
I am unable to provide a full description here, as Pullback Trading incorporates a full trading Methodology, there are a number of articles and books written on the subject.
Set the chart to Heikin Ashi Candles (optional).
I also add a "Sweetspot Gold R3" indicator to the chart as well to help with support and resistance finding and shows where the important "00" lines are.
First on a weekly basis say Sunday night or Monday morning, analyse the Daily and Weekly charts to establish overall trends, and support/resistant levels. Draw significant mini trend lines (2/3 TL), vertical trend lines (VTL) and S/R levels. Can use the Pivots points to guide VTL drawing and Fractals to help guide 2/3 TL drawing.
Once the trend direction and any potential major reversals highlighted, drop down to lower timeframe chart and draw appropriate mini Trend line (2/3 TL) matching the established momentum direction. Take note of potential pull backs from and of the EMAs, in particular the EMA5-12 ribbon, EMA12-36 Ribbon and the 200EMA. Can use the Pivots and/or Fractals points to guide your 2/3 TL drawing.
Set a TradingView alarm on the "PBTOOL alert", with the default settings this normally occurs before or during the Break of the manually drawn TL lines.
Once alerted check to see if the TL is broken and is returning to trend away from the EMA lines, this is indicated by bar colour change to trend directional colour.
You can trade that alert or drop down to even lower time frames and perform the same TL analysis there to find trades at the lower TF. Trading at lower TF you will allow tighter Stop loss settings.
Other than the "SweetSpot Gold R3" indicator, you should not need any other indicator to successfully trade trends for Pullbacks and reversals. If you really want another indicator I suggest a momentum one for example: AO ( Awesome Oscillator ), MACD or Squeeze Momentum.

Spartan Trader FX IndicatorUnofficial (I am not affiliated to www.spartantraderfx.com in any way) combo indicator providing all the indicators needed for their trading system (default coloring as presented in the materials):
EMA 12 line
EMA 36 line
EMA 200 line
EMA 633 line
EMA 200 and EMA 633 volatility zone
EMA 12/36 crossover arrows
heiken ashi color overlay(helpful when trying to see true open and close of candles using regular candlesticks)

Scalping Swing Trading Tool R1-4 by JustUncleLDescription:
This study project is a "Scalping Swing trading Tool" and is an alternative to the "Scalping Pullback Tool R1". It is designed for a two pane TradingView chart layout :
the first pane set to 15min Time Frame;
the second pane set to 1min Time Frame(TF).
The tools incorporates the majority of the indicators needed to analyse and scalp Trends for Swings, PullBacks and reversals on 15min charts and 1min charts.
Incorporated within this tool are the following indicators:
1. The following EMAs are drawn automatically:
Green = EMA89 (15min TF) = EMA75 (1min TF)
Blue = EMA200 (15min TF) = EMA180 (1min TF)
Black = EMA633 (15min TF) = EMA540 (1min TF)
2. The 10EMA (default) High/Low+Close Price Action Channel (PAC), the PAC channel
display is disabled by default.
3. Optionally display Fractals and optional Fractal levels
4. Optional HH, LH, LL, HL finder.
5. Coloured coded Bar high lighting based on the PAC:
blue = bar closed above PAC
red = bar closed below PAC
gray = bar closed inside PAC
lime Line = EMA10 of bar close
6. Pivot points (disables Fractals automatically when selected) with optional labels.
7. EMA5-12 Channel is displayed by default.
8. EMA12-36 Ribbon is displayed by default
9. Optionally display EMA36 and PAC instead of EMA12-36 Ribbon.
Set up and hints:
I am unable to provide a full description here, as Pullback Trading incorporates a full trading Methodology, there are a number of articles and books written on the subject.
Set to two pane TradingView chart, set first pane to 15Min and second to 1min.
Set the chart to Heikin Ashi Candles (optional).
I also add a "Sweetspot Gold2" indicator to the chart as well to help with support and resistance finding and shows where the important "00" lines are.
Use the EMA200 on the 15min pane as the anchor. So when prices above EMA200 we only trade long (buy) and when prices below the EMA200 we only trade short (sell).
On the 15min chart draw any obvious Vertical Trend Lines (VTL), use Pivots point as a guide.
On the 15min chart what we’re looking for price to Pullback into the EMA5-12 Channel or EMA12-36 ribbon, we draw Trendlines uitilising the Pivot points or Fractals to guide your TL drawing.
On the 15min chart look for the trend to resume and break through the drawn TL. The bar color needs to change back to the trend direction colour to confirm as a break.
Now this break can be traded as a 15min trade or now look to the 1min chart.
On the 1min chart draw any Pullback into any of the EMAs.
On the 1min chart look for the trend to resume and break through the drawn TL. The bar color needs to change back to the trend direction colour to confirm as a break.
Now this break can be traded as a 1min trade.
There is also an option to select Pristine (ie Ideal) filtered Fractals, which look like tents or V shape 5-candle patterns. These are actually used to calculate the Pivot points as well.
Other than the "SweetSpot Gold2" indicator, you should not need any other indicator to successfully trade trends for Pullbacks and reversals. If you really want another indicator use the AO (Awesome Oscillator) as it is momentum based.

Murray Math LevelsThe original script was posted on ProRealCode by user supertiti.
The Murray Math lines levels are determined within some principles of Gann levels and candlesticks formations. The Murray Math levels act pretty much like pivot and support/resistance areas.
1. Line 8/8 - 0/8 (Ultimate Support and Ultimate Resistance).
Those lines are the most strong concerning Support and resistance.
2. Line 7/8 (Weak, Place to Stop and Reverse).
This line is weak. If suddenly the price was going too fast and too far and stops around this line it means the price will reverse down very soon. If the price did not stop near this line this price will continue the movement to the line 8/8.
3. Line 1/8 (Weak, Place to Stop and Reverse).
This line is weak. If suddenly the price was going too fast and too far and stops around this line it means the price will reverse up very soon. If the price did not stop near this line this price will continue the movement down to the line 0/8.
4. Line 2/8 and 6/8 (Pivot, Reverse)
Those two lines yield the line 4/8 only to the strength to reverse the price movement.
5. Line 5/8 (Top of Trading Range)
The price is spending the about 40% of the time on the movement between the lines 5/8 and 3/8. If the price is moving near line 5/8 and stopping near the line during the 10 - 12 days so it means that it is necessary to sell in this "bonus zone" (some people are doing like this) but if the price is keeping the tendency to stay above 5/8 line, so it means that the price will be above. But if the price is droping below 5/8 line it means that the price will continue falling to the next level of resistance.
6. Line 3/8 (Bottom of Trading Range).
If the price is below this line and in uptrend it means that it will be very difficult for the price to break this level. If the price broke this line during the uptrend and staying above during the 10- 12 days it means that the price will be above this line during the 40% of its time moving between this line and 5/8 line.
7. Line 4/8 (Major Support/Resistance Line).
It is the major line concerning support and resistance. This level is the better for the new sell or buy. It is the strong level of support of the price is above 4/8. It is the fine resistance line if the price is below this 4/8 line.
Candlestick Trend Indicator v0.5 by JustUncleLRequested Update to this Indicator alert project. In this update I have added the option to be able select which Price Action candles you want included in the display and the generated alarm Alert. Other changes also included in this update:
Also added a Price Action candle for "Last Fractal S/R Break", this also a good continuation indication.
Added option to select a different moving average types for directional MA line.
Modified some default settings, using HullMA instead of Zero Lag EMA and standard MACD settings(12,26,9).
Description:
This is a trend following indicator and alert for Binary Options based on Candlestick patterns and trend line -
NOTE: original system was a forex trading system.
This code combines a number of indicators to create an overall trading strategy.
The indicator recognises and displays some useful candle named defined patterns that are used to support trend continuation:
Bearish + Bullish PinBars
Dark Cloud Cover
Piecing Line
Bullish + Bearish Harami
Bullish + Bearish Engulfing Candle
Bullish + Bearish Last Fractal S/R break
Also recognises main Price Action candles from ChrisMoody (CM), the four(4) price action patterns are colored coded bars:
Yellow = Inside Bar - breakout/continuance
Orange = Outside Bar - breakout/continuance
Aqua/Fuschia = Up/Down Shaved Bars - Buying/Selling pressure
Red/Green = Possible reversal PinBars - Reverse Down / reverse Up
The highlighted candles (maroon and darker green) represent the defined PA patterns that have been confirmed following the current trend direction that is indicated by the Hull MA(20) line (can select a different type of MA, or even disable) and confirmed by MACD direction (can be disabled). The confirmed Alerts are indication by green (buy) and red (sell) dots at the bottom of the chart. An alert is generated from this selection for the alert condition of the alarming system.
The fractal upper/lower break lines are also draw, if the (optional) last fractal break line is broken by a highlighted bar then this indicates a stronger trend conformation.
The MACD indicator MACD DEUTER 2 colour(12,26,9) you can visually see the MACD histogram colours with MACD direction - needs "MACD DEUTER 2 colour" indicator.
This multi-indicator set up is suitable for 1hr, 4hr and daily charts with 1-4 candle expiry.
References and Inspiration from:
Fractal Levels by RicardoSantos
Almost Zero Lag EMA
Candlestick Patterns With EMA by rmwaddelljr
CM_Price-Action-Bars by ChrisMoody
www.forexstrategiesresources.com
"Scalp Jockey - MTF MA Cross Visual Strategizer by JayRogers"

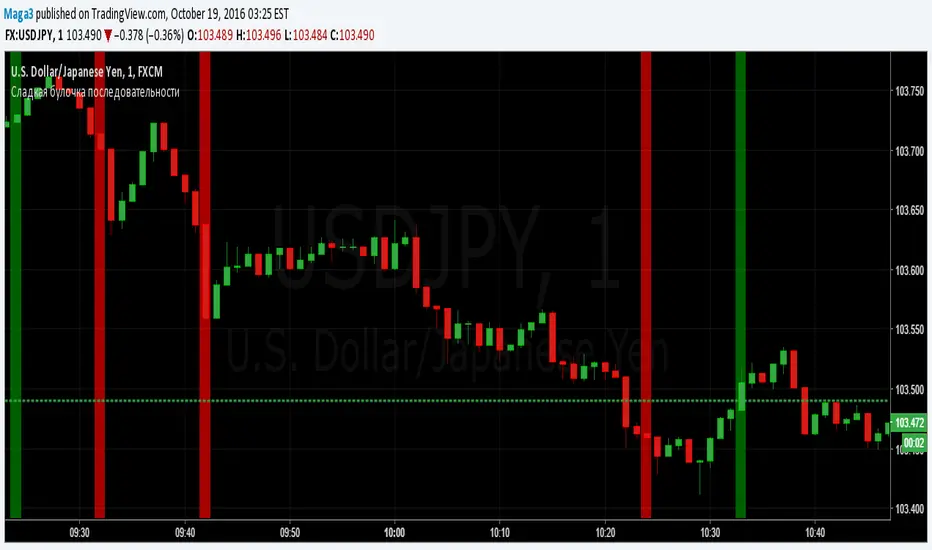
Sladkaya Bulochka PosledovatelnostiSerial number of the same color candles - a popular method of how to find the exact entry zones and determine the trends and kickbacks.
The number of consecutive candles usually starts from 3 and up to 12 in some strategies.
5 candles in sequence - one of the most popular signals. Login at the close of the 5th candle.
---------------------------------------------
Последовательное число свечей одинакового цвета - популярный метод как поиска точных зон входа, так и определения трендов и откатов.
Число последовательных свечей, как правило, начинается с 3 и доходит до 12 в некоторых стратегиях.
5 свечей в последовательности - один из наиболее популярных сигналов. Вход на закрытии 5й свечи.
MACD trend heatmap (by ChartArt)This is an overlay indicator which uses the classic period settings and signals from the MACD (Moving Average Convergence/Divergence) indicator to overlay a heatmap using all the information the MACD generates with its three periods (12,26,9).
The first two moving averages which the MACD uses (12 and 26) can be plotted on the chart like usual EMAs.
In addition to the background color function (the heatmap) and the EMAs, there is an optional bar color alert when the uptrend or the downtrend as measured by the MACD appears to be very strong.

Stoch_VX2Nothing New about a Stochastic but maybe in how you use them ( Other than Over bought / Sold cross over & divergence signals )
Running 3 bands
Standard stoch & tops & bottoms swing band
Optimised variables 12, 5 , 3 or fib 13, 5, 3 / - 12 / 3 / 3 a little bit tighter to combine both smoothness & accuracy. These are my own personal setting inc. Strategy.

MACD Color Trawler (by ChartArt)This version of the MACD indicator is 'trawling' (checking) if the MACD histogram and the zero line crossing with the MACD line are both positive or negative. The idea behind this is to show areas with higher or lower risk.
Features:
1. Enable the bar color
2. Enable the background color
3. Change zero line value
FYI:
"The MACD-Histogram is an indicator of an indicator. In fact, MACD is also an indicator of an indicator. This means that the MACD-Histogram is the fourth derivative of price."
First derivative: 12-day EMA and 26-day EMA
Second derivative: MACD (12-day EMA less the 26-day EMA)
Third derivative: MACD signal line (9-day EMA of MACD)
Fourth derivative: MACD-Histogram (MACD less MACD signal line)
Source: stockcharts.com

EMA50 Flux LT (Daily/Weekly)// This Pine Script® code is subject to the terms of the Mozilla Public License 2.0 at mozilla.org
// © pizzalolodudu
//@version=6
indicator("EMA50 Flux LT (Daily/Weekly)", overlay=true)
// === Inputs ===
lenEMA = input.int(50, "Longueur EMA prix")
obvLen = input.int(20, "OBV MA length")
htf = input.timeframe("W", "Timeframe Flux (HTF)") // Par défaut : Weekly
lineWidth = input.int(6, "Épaisseur EMA", minval=1, maxval=12)
// === EMA50 sur la TF active (ex: Daily chart) ===
ema50 = ta.ema(close, lenEMA)
// === Flux HTF (Weekly ou Monthly) ===
obv_htf = request.security(syminfo.tickerid, htf, ta.cum(math.sign(ta.change(close)) * volume))
obv_ma_htf = request.security(syminfo.tickerid, htf, ta.sma(ta.cum(math.sign(ta.change(close)) * volume), obvLen))
imb_htf = request.security(syminfo.tickerid, htf, (close > open ? 1 : -1))
// === Signaux binaires ===
obv_signal = obv_htf > obv_ma_htf ? 1 : -1
imb_signal = imb_htf > 0 ? 1 : -1
// === Score total revisité ===
score = obv_signal + imb_signal
flux = score > 0 ? 1 : score < 0 ? -1 : 0
// === Couleurs ===
colFlux = flux > 0 ? color.lime : flux < 0 ? color.red : color.orange
colOutline = color.new(color.white, 70)
// === Tracé double couche ===
plot(ema50, color=colOutline, linewidth=lineWidth + 2, title="Contour EMA")
plot(ema50, color=colFlux, linewidth=lineWidth, title="EMA Flux LT")

Custom MACD (Normalized by ATR)This is a modified version of the classic MACD indicator.
Instead of using just the difference between EMA(12) and EMA(26), this version normalizes the MACD line by ATR(26) and scales it by 100:
* 100
This adjustment makes the MACD relative to market volatility, allowing for easier comparison across assets and timeframes.
The idea of normalizing MACD with ATR comes from Alex Spioglou, who suggested this improvement to enhance signal consistency in volatile markets.
Plots include the ATR-normalized MACD line, the signal line, and the histogram, with rising/falling color cues and built-in alert conditions.

Volume Delta Volume Signals by Claudio [hapharmonic]// This Pine Script™ code is subject to the terms of the Mozilla Public License 2.0 at mozilla.org
// © hapharmonic
//@version=6
FV = format.volume
FP = format.percent
indicator('Volume Delta Volume Signals by Claudio ', format = FV, max_bars_back = 4999, max_labels_count = 500)
//------------------------------------------
// Settings |
//------------------------------------------
bool usecandle = input.bool(true, title = 'Volume on Candles',display=display.none)
color C_Up = input.color(#12cef8, title = 'Volume Buy', inline = ' ', group = 'Style')
color C_Down = input.color(#fe3f00, title = 'Volume Sell', inline = ' ', group = 'Style')
// ✅ Nueva entrada para colores de señales
color buySignalColor = input.color(color.new(color.green, 0), "Buy Signal Color", group = "Signals")
color sellSignalColor = input.color(color.new(color.red, 0), "Sell Signal Color", group = "Signals")
string P_ = input.string(position.top_right,"Position",options = ,
group = "Style",display=display.none)
string sL = input.string(size.small , 'Size Label', options = , group = 'Style',display=display.none)
string sT = input.string(size.normal, 'Size Table', options = , group = 'Style',display=display.none)
bool Label = input.bool(false, inline = 'l')
History = input.bool(true, inline = 'l')
// Inputs for EMA lengths and volume confirmation
bool MAV = input.bool(true, title = 'EMA', group = 'EMA')
string volumeOption = input.string('Use Volume Confirmation', title = 'Volume Option', options = , group = 'EMA',display=display.none)
bool useVolumeConfirmation = volumeOption == 'none' ? false : true
int emaFastLength = input(12, title = 'Fast EMA Length', group = 'EMA',display=display.none)
int emaSlowLength = input(26, title = 'Slow EMA Length', group = 'EMA',display=display.none)
int volumeConfirmationLength = input(6, title = 'Volume Confirmation Length', group = 'EMA',display=display.none)
string alert_freq = input.string(alert.freq_once_per_bar_close, title="Alert Frequency",
options= ,group = "EMA",
tooltip="If you choose once_per_bar, you will receive immediate notifications (but this may cause interference or indicator repainting).
\n However, if you choose once_per_bar_close, it will wait for the candle to confirm the signal before notifying.",display=display.none)
//------------------------------------------
// UDT_identifier |
//------------------------------------------
type OHLCV
float O = open
float H = high
float L = low
float C = close
float V = volume
type VolumeData
float buyVol
float sellVol
float pcBuy
float pcSell
bool isBuyGreater
float higherVol
float lowerVol
color higherCol
color lowerCol
//------------------------------------------
// Calculate volumes and percentages |
//------------------------------------------
calcVolumes(OHLCV ohlcv) =>
var VolumeData data = VolumeData.new()
data.buyVol := ohlcv.V * (ohlcv.C - ohlcv.L) / (ohlcv.H - ohlcv.L)
data.sellVol := ohlcv.V - data.buyVol
data.pcBuy := data.buyVol / ohlcv.V * 100
data.pcSell := 100 - data.pcBuy
data.isBuyGreater := data.buyVol > data.sellVol
data.higherVol := data.isBuyGreater ? data.buyVol : data.sellVol
data.lowerVol := data.isBuyGreater ? data.sellVol : data.buyVol
data.higherCol := data.isBuyGreater ? C_Up : C_Down
data.lowerCol := data.isBuyGreater ? C_Down : C_Up
data
//------------------------------------------
// Get volume data |
//------------------------------------------
ohlcv = OHLCV.new()
volData = calcVolumes(ohlcv)
// Plot volumes and create labels
plot(ohlcv.V, color=color.new(volData.higherCol, 90), style=plot.style_columns, title='Total',display = display.all - display.status_line)
plot(ohlcv.V, color=volData.higherCol, style=plot.style_stepline_diamond, title='Total2', linewidth = 2,display = display.pane)
plot(volData.higherVol, color=volData.higherCol, style=plot.style_columns, title='Higher Volume', display = display.all - display.status_line)
plot(volData.lowerVol , color=volData.lowerCol , style=plot.style_columns, title='Lower Volume',display = display.all - display.status_line)
S(D,F)=>str.tostring(D,F)
volStr = S(math.sign(ta.change(ohlcv.C)) * ohlcv.V, FV)
buyVolStr = S(volData.buyVol , FV )
sellVolStr = S(volData.sellVol , FV )
// ✅ MODIFICACIÓN: Porcentaje sin decimales
buyPercentStr = str.tostring(math.round(volData.pcBuy)) + " %"
sellPercentStr = str.tostring(math.round(volData.pcSell)) + " %"
totalbuyPercentC_ = volData.buyVol / (volData.buyVol + volData.sellVol) * 100
sup = not na(ohlcv.V)
if sup
TC = text.align_center
CW = color.white
var table tb = table.new(P_, 6, 6, bgcolor = na, frame_width = 2, frame_color = chart.fg_color, border_width = 1, border_color = CW)
tb.cell(0, 0, text = 'Volume Candles', text_color = #FFBF00, bgcolor = #0E2841, text_halign = TC, text_valign = TC, text_size = sT)
tb.merge_cells(0, 0, 5, 0)
tb.cell(0, 1, text = 'Current Volume', text_color = CW, bgcolor = #0B3040, text_halign = TC, text_valign = TC, text_size = sT)
tb.merge_cells(0, 1, 1, 1)
tb.cell(0, 2, text = 'Buy', text_color = #000000, bgcolor = #92D050, text_halign = TC, text_valign = TC, text_size = sT)
tb.cell(1, 2, text = 'Sell', text_color = #000000, bgcolor = #FF0000, text_halign = TC, text_valign = TC, text_size = sT)
tb.cell(0, 3, text = buyVolStr, text_color = CW, bgcolor = #074F69, text_halign = TC, text_valign = TC, text_size = sT)
tb.cell(1, 3, text = sellVolStr, text_color = CW, bgcolor = #074F69, text_halign = TC, text_valign = TC, text_size = sT)
tb.cell(0, 5, text = 'Net: ' + volStr, text_color = CW, bgcolor = #074F69, text_halign = TC, text_valign = TC, text_size = sT)
tb.merge_cells(0, 5, 1, 5)
tb.cell(0, 4, text = buyPercentStr, text_color = CW, bgcolor = #074F69, text_halign = TC, text_valign = TC, text_size = sT)
tb.cell(1, 4, text = sellPercentStr, text_color = CW, bgcolor = #074F69, text_halign = TC, text_valign = TC, text_size = sT)
cellCount = 20
filledCells = 0
for r = 5 to 1 by 1
for c = 2 to 5 by 1
if filledCells < cellCount * (totalbuyPercentC_ / 100)
tb.cell(c, r, text = '', bgcolor = C_Up)
else
tb.cell(c, r, text = '', bgcolor = C_Down)
filledCells := filledCells + 1
filledCells
if Label
sp = ' '
l = label.new(bar_index, ohlcv.V,
text=str.format('Net: {0}\nBuy: {1} ({2})\nSell: {3} ({4})\n{5}/\\\n {5}l\n {5}l',
volStr, buyVolStr, buyPercentStr, sellVolStr, sellPercentStr, sp),
style=label.style_none, textcolor=volData.higherCol, size=sL, textalign=text.align_left)
if not History
(l ).delete()
//------------------------------------------
// Draw volume levels on the candlesticks |
//------------------------------------------
float base = na,float value = na
bool uc = usecandle and sup
if volData.isBuyGreater
base := math.min(ohlcv.O, ohlcv.C)
value := base + math.abs(ohlcv.O - ohlcv.C) * (volData.pcBuy / 100)
else
base := math.max(ohlcv.O, ohlcv.C)
value := base - math.abs(ohlcv.O - ohlcv.C) * (volData.pcSell / 100)
barcolor(sup ? color.new(na, na) : ohlcv.C < ohlcv.O ? color.red : color.green,display = usecandle? display.all:display.none)
UseC = uc ? volData.higherCol:color.new(na, na)
plotcandle(uc?base:na, uc?base:na, uc?value:na, uc?value:na,
title='Body', color=UseC, bordercolor=na, wickcolor=UseC,
display = usecandle ? display.all - display.status_line : display.none, force_overlay=true,editable=false)
plotcandle(uc?ohlcv.O:na, uc?ohlcv.H:na, uc?ohlcv.L:na, uc?ohlcv.C:na,
title='Fill', color=color.new(UseC,80), bordercolor=UseC, wickcolor=UseC,
display = usecandle ? display.all - display.status_line : display.none, force_overlay=true,editable=false)
//------------------------------------------------------------
// Plot the EMA and filter out the noise with volume control. |
//------------------------------------------------------------
float emaFast = ta.ema(ohlcv.C, emaFastLength)
float emaSlow = ta.ema(ohlcv.C, emaSlowLength)
bool signal = emaFast > emaSlow
color c_signal = signal ? C_Up : C_Down
float volumeMA = ta.sma(ohlcv.V, volumeConfirmationLength)
bool crossover = ta.crossover(emaFast, emaSlow)
bool crossunder = ta.crossunder(emaFast, emaSlow)
isVolumeConfirmed(source, length, ma) =>
math.sum(source > ma ? source : 0, length) >= math.sum(source < ma ? source : 0, length)
bool ISV = isVolumeConfirmed(ohlcv.V, volumeConfirmationLength, volumeMA)
bool crossoverConfirmed = crossover and (not useVolumeConfirmation or ISV)
bool crossunderConfirmed = crossunder and (not useVolumeConfirmation or ISV)
PF = MAV ? emaFast : na
PS = MAV ? emaSlow : na
p1 = plot(PF, color = c_signal, editable = false, force_overlay = true, display = display.pane)
plot(PF, color = color.new(c_signal, 80), linewidth = 10, editable = false, force_overlay = true, display = display.pane)
plot(PF, color = color.new(c_signal, 90), linewidth = 20, editable = false, force_overlay = true, display = display.pane)
plot(PF, color = color.new(c_signal, 95), linewidth = 30, editable = false, force_overlay = true, display = display.pane)
plot(PF, color = color.new(c_signal, 98), linewidth = 45, editable = false, force_overlay = true, display = display.pane)
p2 = plot(PS, color = c_signal, editable = false, force_overlay = true, display = display.pane)
plot(PS, color = color.new(c_signal, 80), linewidth = 10, editable = false, force_overlay = true, display = display.pane)
plot(PS, color = color.new(c_signal, 90), linewidth = 20, editable = false, force_overlay = true, display = display.pane)
plot(PS, color = color.new(c_signal, 95), linewidth = 30, editable = false, force_overlay = true, display = display.pane)
plot(PS, color = color.new(c_signal, 98), linewidth = 45, editable = false, force_overlay = true, display = display.pane)
fill(p1, p2, top_value=crossover ? emaFast : emaSlow,
bottom_value =crossover ? emaSlow : emaFast,
top_color =color.new(c_signal, 80),
bottom_color =color.new(c_signal, 95)
)
// ✅ Usar colores configurables para señales
plotshape(crossoverConfirmed and MAV, style=shape.triangleup , location=location.belowbar, color=buySignalColor , size=size.small, force_overlay=true,display =display.pane)
plotshape(crossunderConfirmed and MAV, style=shape.triangledown, location=location.abovebar, color=sellSignalColor, size=size.small, force_overlay=true,display =display.pane)
string msg = '---------\n'+"Buy volume ="+buyVolStr+"\nBuy Percent = "+buyPercentStr+"\nSell volume = "+sellVolStr+"\nSell Percent = "+sellPercentStr+"\nNet = "+volStr+'\n---------'
if crossoverConfirmed
alert("Price (" + str.tostring(close) + ") Crossed over MA\n" + msg, alert_freq)
if crossunderConfirmed
alert("Price (" + str.tostring(close) + ") Crossed under MA\n" + msg, alert_freq)

SMC Volatility Liquidity Prothis one’s a confluence signaler. it fires “BUY CALL” / “BUY PUT” labels only when four things line up at once: trend, volatility squeeze, a liquidity sweep, and MACD momentum. quick breakdown:
what each block does
Trend filter (context)
ema50 > ema200 ⇒ trendUp
ema50 < ema200 ⇒ trendDn
Plots both EMAs for visual context.
Volatility compression (setup)
20-period Bollinger Bands (stdev 2).
bb_squeeze is true when current band width < its 20-SMA ⇒ price is compressed (potential energy building).
Liquidity sweep (trigger)
Tracks 20-bar swing high/low.
Long sweep: high > swingHigh ⇒ price just poked above the prior 20-bar high (took buy-side liquidity).
Short sweep: low < swingLow ⇒ price just poked below the prior 20-bar low (took sell-side liquidity).
MACD momentum (confirmation)
Standard MACD(12,26,9) histogram.
Bullish: hist > 0 and rising versus previous bar.
Bearish: hist < 0 and falling.
the actual entry signals
LongEntry = trendUp AND bb_squeeze AND liquiditySweepLong AND macdBullish
→ prints a green “BUY CALL” label below the bar.
ShortEntry = trendDn AND bb_squeeze AND liquiditySweepShort AND macdBearish
→ prints a red “BUY PUT” label above the bar.
alerts & dashboard
Alerts: fires when those long/short conditions hit so you can set TradingView alerts on them.
On-chart dashboard (bottom-right):
Trend (Bullish/Bearish/Neutral)
Squeeze (Yes/No)
Liquidity (Long/Short/None)
Momentum (Bullish/Bearish/Neutral)
Current Signal (BUY CALL / BUY PUT / WAIT)
(btw the comment says “2 columns × 5 rows” but the table is actually 5 columns × 2 rows—values under each label across the row.)
what it’s trying to capture (in plain english)
Trade with the higher-timeframe bias (EMA 50 over 200).
Enter as volatility compresses (bands tight) and a sweep grabs stops beyond a 20-bar extreme.
Only pull the trigger when momentum agrees (MACD hist direction & side of zero).
caveats / tips
It’s an indicator, not a strategy—no entries/exits/backtests baked in.
Signals are strict (4 filters), so you’ll get fewer but “cleaner” prints; still not magical.
The liquidity-sweep check uses the prior bar’s 20-bar high/low ( ), so on bar close it won’t repaint; intrabar alerts may feel jumpy if you alert “on every tick.”
Consider adding:
Exit logic (e.g., ATR stop + take-profit, or opposite signal).
Minimum squeeze duration (e.g., bb_squeeze true for N bars) to avoid one-bar dips in width.
Cool-down after a signal to prevent clustering.
Session/time or volume filter if you only want liquid hours.
if you want, I can convert this into a backtestable strategy() version with ATR-based stops/targets and a few toggles, so you can see stats right away.

MACD (The Moving Average Convergence Divergence)The Moving Average Convergence Divergence (MACD) is a momentum indicator used in technical analysis to identify trends, measure their strength, and signal potential reversals. It is calculated by subtracting the 26-period Exponential Moving Average (EMA) from the 12-period EMA, creating the MACD line. A 9-period EMA of the MACD line, known as the signal line, is then plotted to generate buy or sell signals. Positive MACD values suggest upward momentum, while negative values indicate downward momentum. Traders often watch for crossovers, divergences, and movements relative to the zero line to make informed decisions.

BOCS AdaptiveBOCS Adaptive Strategy - Automated Volatility Breakout System
WHAT THIS STRATEGY DOES:
This is an automated trading strategy that detects consolidation patterns through volatility analysis and executes trades when price breaks out of these channels. Take-profit and stop-loss levels are calculated dynamically using Average True Range (ATR) to adapt to current market volatility. The strategy closes positions partially at the first profit target and exits the remainder at the second target or stop loss.
TECHNICAL METHODOLOGY:
Price Normalization Process:
The strategy begins by normalizing price to create a consistent measurement scale. It calculates the highest high and lowest low over a user-defined lookback period (default 100 bars). The current close price is then normalized using the formula: (close - lowest_low) / (highest_high - lowest_low). This produces values between 0 and 1, allowing volatility analysis to work consistently across different instruments and price levels.
Volatility Detection:
A 14-period standard deviation is applied to the normalized price series. Standard deviation measures how much prices deviate from their average - higher values indicate volatility expansion, lower values indicate consolidation. The strategy uses ta.highestbars() and ta.lowestbars() functions to track when volatility reaches peaks and troughs over the detection length period (default 14 bars).
Channel Formation Logic:
When volatility crosses from a high level to a low level, this signals the beginning of a consolidation phase. The strategy records this moment using ta.crossover(upper, lower) and begins tracking the highest and lowest prices during the consolidation. These become the channel boundaries. The duration between the crossover and current bar must exceed 10 bars minimum to avoid false channels from brief volatility spikes. Channels are drawn using box objects with the recorded high/low boundaries.
Breakout Signal Generation:
Two detection modes are available:
Strong Closes Mode (default): Breakout occurs when the candle body midpoint math.avg(close, open) exceeds the channel boundary. This filters out wick-only breaks.
Any Touch Mode: Breakout occurs when the close price exceeds the boundary.
When price closes above the upper channel boundary, a bullish breakout signal generates. When price closes below the lower boundary, a bearish breakout signal generates. The channel is then removed from the chart.
ATR-Based Risk Management:
The strategy uses request.security() to fetch ATR values from a specified timeframe, which can differ from the chart timeframe. For example, on a 5-minute chart, you can use 1-minute ATR for more responsive calculations. The ATR is calculated using ta.atr(length) with a user-defined period (default 14).
Exit levels are calculated at the moment of breakout:
Long Entry Price = Upper channel boundary
Long TP1 = Entry + (ATR × TP1 Multiplier)
Long TP2 = Entry + (ATR × TP2 Multiplier)
Long SL = Entry - (ATR × SL Multiplier)
For short trades, the calculation inverts:
Short Entry Price = Lower channel boundary
Short TP1 = Entry - (ATR × TP1 Multiplier)
Short TP2 = Entry - (ATR × TP2 Multiplier)
Short SL = Entry + (ATR × SL Multiplier)
Trade Execution Logic:
When a breakout occurs, the strategy checks if trading hours filter is satisfied (if enabled) and if position size equals zero (no existing position). If volume confirmation is enabled, it also verifies that current volume exceeds 1.2 times the 20-period simple moving average.
If all conditions are met:
strategy.entry() opens a position using the user-defined number of contracts
strategy.exit() immediately places a stop loss order
The code monitors price against TP1 and TP2 levels on each bar
When price reaches TP1, strategy.close() closes the specified number of contracts (e.g., if you enter with 3 contracts and set TP1 close to 1, it closes 1 contract). When price reaches TP2, it closes all remaining contracts. If stop loss is hit first, the entire position exits via the strategy.exit() order.
Volume Analysis System:
The strategy uses ta.requestUpAndDownVolume(timeframe) to fetch up volume, down volume, and volume delta from a specified timeframe. Three display modes are available:
Volume Mode: Shows total volume as bars scaled relative to the 20-period average
Comparison Mode: Shows up volume and down volume as separate bars above/below the channel midline
Delta Mode: Shows net volume delta (up volume - down volume) as bars, positive values above midline, negative below
The volume confirmation logic compares breakout bar volume to the 20-period SMA. If volume ÷ average > 1.2, the breakout is classified as "confirmed." When volume confirmation is enabled in settings, only confirmed breakouts generate trades.
INPUT PARAMETERS:
Strategy Settings:
Number of Contracts: Fixed quantity to trade per signal (1-1000)
Require Volume Confirmation: Toggle to only trade signals with volume >120% of average
TP1 Close Contracts: Exact number of contracts to close at first target (1-1000)
Use Trading Hours Filter: Toggle to restrict trading to specified session
Trading Hours: Session input in HHMM-HHMM format (e.g., "0930-1600")
Main Settings:
Normalization Length: Lookback bars for high/low calculation (1-500, default 100)
Box Detection Length: Period for volatility peak/trough detection (1-100, default 14)
Strong Closes Only: Toggle between body midpoint vs close price for breakout detection
Nested Channels: Allow multiple overlapping channels vs single channel at a time
ATR TP/SL Settings:
ATR Timeframe: Source timeframe for ATR calculation (1, 5, 15, 60, etc.)
ATR Length: Smoothing period for ATR (1-100, default 14)
Take Profit 1 Multiplier: Distance from entry as multiple of ATR (0.1-10.0, default 2.0)
Take Profit 2 Multiplier: Distance from entry as multiple of ATR (0.1-10.0, default 3.0)
Stop Loss Multiplier: Distance from entry as multiple of ATR (0.1-10.0, default 1.0)
Enable Take Profit 2: Toggle second profit target on/off
VISUAL INDICATORS:
Channel boxes with semi-transparent fill showing consolidation zones
Green/red colored zones at channel boundaries indicating breakout areas
Volume bars displayed within channels using selected mode
TP/SL lines with labels showing both price level and distance in points
Entry signals marked with up/down triangles at breakout price
Strategy status table showing position, contracts, P&L, ATR values, and volume confirmation status
HOW TO USE:
For 2-Minute Scalping:
Set ATR Timeframe to "1" (1-minute), ATR Length to 12, TP1 Multiplier to 2.0, TP2 Multiplier to 3.0, SL Multiplier to 1.5. Enable volume confirmation and strong closes only. Use trading hours filter to avoid low-volume periods.
For 5-15 Minute Day Trading:
Set ATR Timeframe to match chart or use 5-minute, ATR Length to 14, TP1 Multiplier to 2.0, TP2 Multiplier to 3.5, SL Multiplier to 1.2. Volume confirmation recommended but optional.
For Hourly+ Swing Trading:
Set ATR Timeframe to 15-30 minute, ATR Length to 14-21, TP1 Multiplier to 2.5, TP2 Multiplier to 4.0, SL Multiplier to 1.5. Volume confirmation optional, nested channels can be enabled for multiple setups.
BACKTEST CONSIDERATIONS:
Strategy performs best during trending or volatility expansion phases
Consolidation-heavy or choppy markets produce more false signals
Shorter timeframes require wider stop loss multipliers due to noise
Commission and slippage significantly impact performance on sub-5-minute charts
Volume confirmation generally improves win rate but reduces trade frequency
ATR multipliers should be optimized for specific instrument characteristics
COMPATIBLE MARKETS:
Works on any instrument with price and volume data including forex pairs, stock indices, individual stocks, cryptocurrency, commodities, and futures contracts. Requires TradingView data feed that includes volume for volume confirmation features to function.
KNOWN LIMITATIONS:
Stop losses execute via strategy.exit() and may not fill at exact levels during gaps or extreme volatility
request.security() on lower timeframes requires higher-tier TradingView subscription
False breakouts inherent to breakout strategies cannot be completely eliminated
Performance varies significantly based on market regime (trending vs ranging)
Partial closing logic requires sufficient position size relative to TP1 close contracts setting
RISK DISCLOSURE:
Trading involves substantial risk of loss. Past performance of this or any strategy does not guarantee future results. This strategy is provided for educational purposes and automated backtesting. Thoroughly test on historical data and paper trade before risking real capital. Market conditions change and strategies that worked historically may fail in the future. Use appropriate position sizing and never risk more than you can afford to lose. Consider consulting a licensed financial advisor before making trading decisions.
ACKNOWLEDGMENT & CREDITS:
This strategy is built upon the channel detection methodology created by AlgoAlpha in the "Smart Money Breakout Channels" indicator. Full credit and appreciation to AlgoAlpha for pioneering the normalized volatility approach to identifying consolidation patterns and sharing this innovative technique with the TradingView community. The enhancements added to the original concept include automated trade execution, multi-timeframe ATR-based risk management, partial position closing by contract count, volume confirmation filtering, and real-time position monitoring.

RSI(7) + MACD ZoneTitle: RSI(7) + MACD Zone Combo
Description:
This indicator combines RSI (7) and MACD (12,26,9) into a single panel with a unified scale for easier analysis.
RSI (7) is plotted in white and automatically turns red when the market reaches overbought (>70) or oversold (<30) conditions.
MACD is normalized to align with the RSI scale (0–100).
A value of 50 represents MACD = 0.
Above 50 (teal) indicates positive momentum.
Below 50 (red) indicates negative momentum.
This combination allows traders to quickly identify when short-term RSI conditions align with overall momentum shifts from MACD.
How to use:
Look for potential buy opportunities when RSI is oversold (<30) and MACD is above 50 (positive momentum).
Look for potential sell opportunities when RSI is overbought (>70) and MACD is below 50 (negative momentum).
Use in conjunction with price action and risk management — not as a standalone signal.

Trader Marks Trailing SL + TP (BE @ 60%)This script provides a unique stop-loss and take-profit management tool designed for swing traders.
It introduces a two-stage stop-loss logic that is not available in standard TradingView tools:
Break-Even Protection: Once a defined profit threshold (e.g. 66%) is reached, the stop-loss automatically moves to break-even.
ATR-Based Trailing Stop: After a chosen delay (e.g. 12 hours), the script activates a dynamic trailing stop that follows market volatility using the ATR.
Flexible Ratchet Mechanism: The stop-loss can be locked at new profit levels and will never move backwards.
This combination allows traders to secure profits while still giving the trade room to develop. The indicator is especially useful for swing trading on 4H and daily timeframes but can be applied to other styles as well.
How to use:
Enter your entry price, stop-loss, and take-profit levels.
Choose your trailing mode: Exact S/L+ (simple) or Advanced (Delay + BE + Ratchet).
Adjust parameters such as ATR length or activation delay to match your strategy.
The script helps you balance risk and reward by ensuring that once the trade moves in your favor, you cannot lose the initial risk, while still benefiting from extended market moves.

Stochastic [Paifc0de]Stochastic — clean stochastic oscillator with visual masking, neutral markers, and basic filters
What it does
This indicator plots a standard stochastic oscillator (%K with smoothing and %D) and adds practical quality-of-life features for lower timeframes: optional visual masking when %K hugs overbought/oversold, neutral K–D cross markers, session-gated edge triangles (K crossing 20/80), and simple filters (minimum %K slope, minimum |K–D| gap, optional %D slope agreement, mid-zone mute, and a cooldown between markers). Display values are clamped to 0–100 to keep the panel scale stable. The tool is for research/education and does not generate entries/exits or financial advice.
Default preset: 20 / 10 / 10
K Length = 20
Classic lookback used in many textbooks. On intraday charts it balances responsiveness and stability: short enough to react to momentum shifts, long enough to avoid constant whipsaws. In practice it captures ~the last 20 bars’ position of close within the high–low range.
K Smoothing = 10
A 10-period SMA applied to the raw %K moderates the “saw-tooth” effect that raw stochastic can exhibit in choppy phases. The smoothing reduces over-reaction to micro spikes while preserving the main rhythm of swings; visually, %K becomes a continuous path that is easier to read.
D Length = 10
%D is the moving average of smoothed %K. With 10, %D becomes a clearly slower guide line. The larger separation between %K(10-SMA) and %D(10-SMA of %K) produces cleaner crosses and fewer spurious toggles than micro settings (e.g., 3/3/3). On M5–M15 this pair often yields readable cross cycles without flooding the chart.
How the 20/10/10 trio behaves
In persistent trends, %K will spend more time near 20 or 80; the 10-period smoothing delays flips slightly and emphasizes only meaningful turn attempts.
In ranges, %K oscillates around mid-zone (40–60). With 10/10 smoothing, cross signals cluster less densely; combining with the |K–D| gap filter helps keep only decisive crosses.
If your symbol is unusually volatile or illiquid, reduce K Length (e.g., 14) or reduce K Smoothing (e.g., 7) to keep responsiveness. If crosses feel late, decrease D Length (e.g., 7). If noise is excessive, increase K Smoothing first, then consider raising D Length.
Visuals
OB/OS lines: default 80/20 reference levels and a midline at 50.
Masking near edges: %K can be temporarily hidden when it is pressing an edge, approaching it with low slope, or going nearly flat near the boundary. This keeps the panel readable during “stuck at the edge” phases.
Soft glow (optional): highlights %K’s active path; can be turned off.
Light/Dark palette: quick toggle to match your chart theme.
Scale safety: all plotted values (lines, fills, markers) are clamped to 0–100 to prevent the axis from expanding beyond the stochastic range.
Markers and filters
Neutral K–D cross markers: circles in the mid-zone when %K crosses %D.
Edge triangles: show when %K crosses 20 or 80; can be restricted to a session window (02:00–12:00 ET).
Filters (optional):
Min %K slope: require a minimum absolute slope so very flat crosses are ignored.
Min |K–D| gap: demand separation between lines at the cross moment.
%D slope agreement: keep crosses that align with %D’s direction.
Mid-zone mute: suppress crosses inside a user-defined 40–60 band (defaults).
Cooldown: minimum bars between successive markers.
Parameters (quick guide)
K Length / K Smoothing / D Length: core stochastic settings. Start with 20/10/10; tune K Smoothing first if you see too much jitter.
Overbought / Oversold (80/20): adjust for assets that tend to trend (raise to 85/15) or mean-revert (lower to 75/25).
Slope & gap filters: increase on very noisy symbols; reduce if you miss too many crosses.
Session window (triangles only): use if you want edge markers only during active hours.
Marker size and offset: cosmetic; they do not affect calculations.
Alerts
K–D Cross Up (filtered) and K–D Cross Down (filtered): fire when a cross passes your filters/cooldown.
Edge Up / Edge Down: fire when %K crosses the 20/80 levels.
All alerts confirm on bar close.
Notes & attribution
Original implementation and integration by Paifc0de; no third-party code is copied.
This indicator is for research/education and does not provide entries/exits or financial advice.

MACD COM PONTOS//@version=5
indicator(title="MACD COM PONTOS", shorttitle="MACD COM PONTOS")
//Plot Inputs
res = input.timeframe("", "Indicator TimeFrame")
fast_length = input.int(title="Fast Length", defval=12)
slow_length = input.int(title="Slow Length", defval=26)
src = input.source(title="Source", defval=close)
signal_length = input.int(title="Signal Smoothing", minval = 1, maxval = 999, defval = 9)
sma_source = input.string(title="Oscillator MA Type", defval="EMA", options= )
sma_signal = input.string(title="Signal Line MA Type", defval="EMA", options= )
// Show Plots T/F
show_macd = input.bool(true, title="Show MACD Lines", group="Show Plots?", inline="SP10")
show_macd_LW = input.int(3, minval=0, maxval=5, title = "MACD Width", group="Show Plots?", inline="SP11")
show_signal_LW= input.int(2, minval=0, maxval=5, title = "Signal Width", group="Show Plots?", inline="SP11")
show_Hist = input.bool(true, title="Show Histogram", group="Show Plots?", inline="SP20")
show_hist_LW = input.int(5, minval=0, maxval=5, title = "-- Width", group="Show Plots?", inline="SP20")
show_trend = input.bool(true, title = "Show MACD Lines w/ Trend Color", group="Show Plots?", inline="SP30")
show_HB = input.bool(false, title="Show Highlight Price Bars", group="Show Plots?", inline="SP40")
show_cross = input.bool(false, title = "Show BackGround on Cross", group="Show Plots?", inline="SP50")
show_dots = input.bool(true, title = "Show Circle on Cross", group="Show Plots?", inline="SP60")
show_dots_LW = input.int(5, minval=0, maxval=5, title = "-- Width", group="Show Plots?", inline="SP60")
//show_trend = input(true, title = "Colors MACD Lines w/ Trend Color", group="Show Plots?", inline="SP5")
// MACD Lines colors
col_macd = input.color(#FF6D00, "MACD Line ", group="Color Settings", inline="CS1")
col_signal = input.color(#2962FF, "Signal Line ", group="Color Settings", inline="CS1")
col_trnd_Up = input.color(#4BAF4F, "Trend Up ", group="Color Settings", inline="CS2")
col_trnd_Dn = input.color(#B71D1C, "Trend Down ", group="Color Settings", inline="CS2")
// Histogram Colors
col_grow_above = input.color(#26A69A, "Above Grow", group="Histogram Colors", inline="Hist10")
col_fall_above = input.color(#B2DFDB, "Fall", group="Histogram Colors", inline="Hist10")
col_grow_below = input.color(#FF5252, "Below Grow", group="Histogram Colors",inline="Hist20")
col_fall_below = input.color(#FFCDD2, "Fall", group="Histogram Colors", inline="Hist20")
// Alerts T/F Inputs
alert_Long = input.bool(true, title = "MACD Cross Up", group = "Alerts", inline="Alert10")
alert_Short = input.bool(true, title = "MACD Cross Dn", group = "Alerts", inline="Alert10")
alert_Long_A = input.bool(false, title = "MACD Cross Up & > 0", group = "Alerts", inline="Alert20")
alert_Short_B = input.bool(false, title = "MACD Cross Dn & < 0", group = "Alerts", inline="Alert20")
// Calculating
fast_ma = request.security(syminfo.tickerid, res, sma_source == "SMA" ? ta.sma(src, fast_length) : ta.ema(src, fast_length))
slow_ma = request.security(syminfo.tickerid, res, sma_source == "SMA" ? ta.sma(src, slow_length) : ta.ema(src, slow_length))
macd = fast_ma - slow_ma
signal = request.security(syminfo.tickerid, res, sma_signal == "SMA" ? ta.sma(macd, signal_length) : ta.ema(macd, signal_length))
hist = macd - signal
// MACD Trend and Cross Up/Down conditions
trend_up = macd > signal
trend_dn = macd < signal
cross_UP = signal >= macd and signal < macd
cross_DN = signal <= macd and signal > macd
cross_UP_A = (signal >= macd and signal < macd) and macd > 0
cross_DN_B = (signal <= macd and signal > macd) and macd < 0
// Condition that changes Color of MACD Line if Show Trend is turned on..
trend_col = show_trend and trend_up ? col_trnd_Up : trend_up ? col_macd : show_trend and trend_dn ? col_trnd_Dn: trend_dn ? col_macd : na
//Var Statements for Histogram Color Change
var bool histA_IsUp = false
var bool histA_IsDown = false
var bool histB_IsDown = false
var bool histB_IsUp = false
histA_IsUp := hist == hist ? histA_IsUp : hist > hist and hist > 0
histA_IsDown := hist == hist ? histA_IsDown : hist < hist and hist > 0
histB_IsDown := hist == hist ? histB_IsDown : hist < hist and hist <= 0
histB_IsUp := hist == hist ? histB_IsUp : hist > hist and hist <= 0
hist_col = histA_IsUp ? col_grow_above : histA_IsDown ? col_fall_above : histB_IsDown ? col_grow_below : histB_IsUp ? col_fall_below :color.silver
// Plot Statements
//Background Color
bgcolor(show_cross and cross_UP ? col_trnd_Up : na, editable=false)
bgcolor(show_cross and cross_DN ? col_trnd_Dn : na, editable=false)
//Highlight Price Bars
barcolor(show_HB and trend_up ? col_trnd_Up : na, title="Trend Up", offset = 0, editable=false)
barcolor(show_HB and trend_dn ? col_trnd_Dn : na, title="Trend Dn", offset = 0, editable=false)
//Regular Plots
plot(show_Hist and hist ? hist : na, title="Histogram", style=plot.style_columns, color=color.new(hist_col ,0),linewidth=show_hist_LW)
plot(show_macd and signal ? signal : na, title="Signal", color=color.new(col_signal, 0), style=plot.style_line ,linewidth=show_signal_LW)
plot(show_macd and macd ? macd : na, title="MACD", color=color.new(trend_col, 0), style=plot.style_line ,linewidth=show_macd_LW)
hline(0, title="0 Line", color=color.new(color.gray, 0), linestyle=hline.style_dashed, linewidth=1, editable=false)
plot(show_dots and cross_UP ? macd : na, title="Dots", color=color.new(trend_col ,0), style=plot.style_circles, linewidth=show_dots_LW, editable=false)
plot(show_dots and cross_DN ? macd : na, title="Dots", color=color.new(trend_col ,0), style=plot.style_circles, linewidth=show_dots_LW, editable=false)
//Alerts
if alert_Long and cross_UP
alert("Symbol = (" + syminfo.tickerid + ") TimeFrame = (" + timeframe.period + ") Current Price (" + str.tostring(close) + ") MACD Crosses Up.", alert.freq_once_per_bar_close)
if alert_Short and cross_DN
alert("Symbol = (" + syminfo.tickerid + ") TimeFrame = (" + timeframe.period + ") Current Price (" + str.tostring(close) + ") MACD Crosses Down.", alert.freq_once_per_bar_close)
//Alerts - Stricter Condition - Only Alerts When MACD Crosses UP & MACD > 0 -- Crosses Down & MACD < 0
if alert_Long_A and cross_UP_A
alert("Symbol = (" + syminfo.tickerid + ") TimeFrame = (" + timeframe.period + ") Current Price (" + str.tostring(close) + ") MACD > 0 And Crosses Up.", alert.freq_once_per_bar_close)
if alert_Short_B and cross_DN_B
alert("Symbol = (" + syminfo.tickerid + ") TimeFrame = (" + timeframe.period + ") Current Price (" + str.tostring(close) + ") MACD < 0 And Crosses Down.", alert.freq_once_per_bar_close)
//End Code
