Flunki T-WAP minus MA Oscillator
Yo,
Possible the last of these for now, and mostly for the sake of completeness..
This is..
Another simple oscillator that show the difference in price between a selectable timeframe TWAP and a Moving Average of that TWAP
This is shown as a histogram.
Use numeric TWAP values for minutes (30, 60 ,720 whatever) and D, 3D, W, M for higher values
There is also a global timeframe which will set the timeframe for a global alternate timeframe (instead of current chart resolution)
On top of that is a Moving Average of the histogram value, shown as a blue / red line with an option to highlight this MA crossing zero, and an option to colour bars to this line.
The major difference between this Oscillator, and the other script (Flunki VWAP minus MA Oscillator)
(I treid to insert a link but it's invisible so it would seem, anyway.. )
is that VWAP is usually calculated daily, so there is a sharp move upon the daily close, as VWAP starts a new day. Using TWAP this does not occur, so gives smoother transitions ; also the timeframe for TWAP is selectable for additional wap fun.
Simple idea : Code open
Enjoy !
스크립트에서 "股价站上60月线"에 대해 찾기

Flunki TWAP minus MTF TWAP Oscillator
Heys,
Herewith a another simple oscillator that show the difference in price between a selectable timeframe TWAP and another alternative selectable timeframe TWAP
This is shown as a histogram.
Use numeric TWAP values for minutes (30, 60 ,720 whatever) and D, 3D, W, M for higher values
There is also a global timeframe which will set the timeframe for a global alternate timeframe (instead of current chart resolution)
On top of that is a Moving Average of the histogram value, shown as a blue / red line with an option to highlight this MA crossing zero, and an option to colour bars to this line.
Simple idea : Code open
Enjoy !
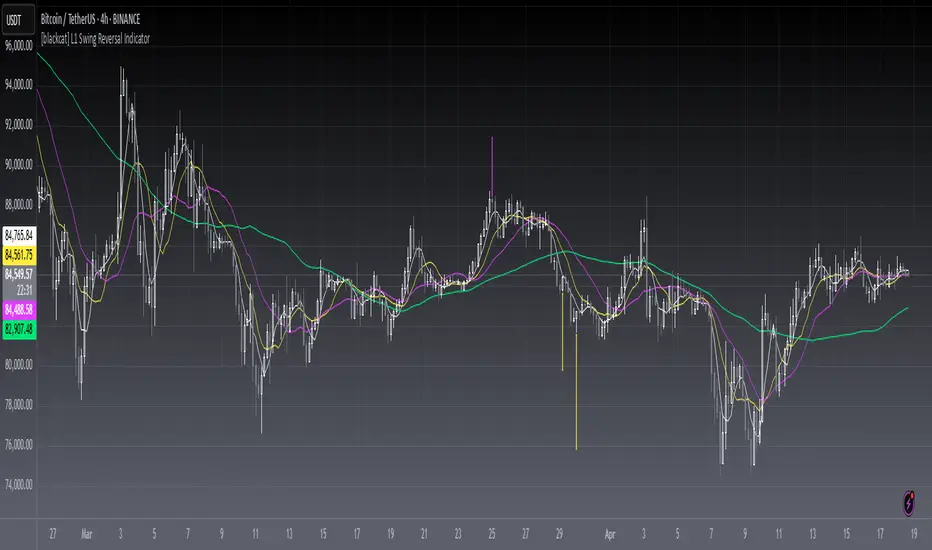
[blackcat] L1 Swing Reversal IndicatorLevel: 1
Background
Many asked me about swing reversal indicators. There are many but less of them can guarantee high win rate. Because market is complex, the reversals can be nested together, which means sub level reversals will be contained in higher level waves. This can be well explained by Elloit wave theory.
Function
Here it is a simple moving average based swing reversal indicator as an example for many others to improve it. Although it simple, it could be very powerful to dedicated trading pairs in specific time frame. One can adjust N1~N4 as SMA peiords from short to long to customized this indicator or even by trying different moving average types to enhance its accuracy.
Key Signal
N1~N4 --> SMA look back periods
OB --> Overbought Threshold
OS --> Oversold Threshold
Pros and Cons
Simpe but powerful. More feedbacks are appreciated.
Remarks
Easy to be customized or integrated to your trading system.
Readme
In real life, I am a prolific inventor. I have successfully applied for more than 60 international and regional patents in the past 12 years. But in the past two years or so, I have tried to transfer my creativity to the development of trading strategies. Tradingview is the ideal platform for me. I am selecting and contributing some of the hundreds of scripts to publish in Tradingview community. Welcome everyone to interact with me to discuss these interesting pine scripts.
The scripts posted are categorized into 5 levels according to my efforts or manhours put into these works.
Level 1 : interesting script snippets or distinctive improvement from classic indicators or strategy. Level 1 scripts can usually appear in more complex indicators as a function module or element.
Level 2 : composite indicator/strategy. By selecting or combining several independent or dependent functions or sub indicators in proper way, the composite script exhibits a resonance phenomenon which can filter out noise or fake trading signal to enhance trading confidence level.
Level 3 : comprehensive indicator/strategy. They are simple trading systems based on my strategies. They are commonly containing several or all of entry signal, close signal, stop loss, take profit, re-entry, risk management, and position sizing techniques. Even some interesting fundamental and mass psychological aspects are incorporated.
Level 4 : script snippets or functions that do not disclose source code. Interesting element that can reveal market laws and work as raw material for indicators and strategies. If you find Level 1~2 scripts are helpful, Level 4 is a private version that took me far more efforts to develop.
Level 5 : indicator/strategy that do not disclose source code. private version of Level 3 script with my accumulated script processing skills or a large number of custom functions. I had a private function library built in past two years. Level 5 scripts use many of them to achieve private trading strategy.
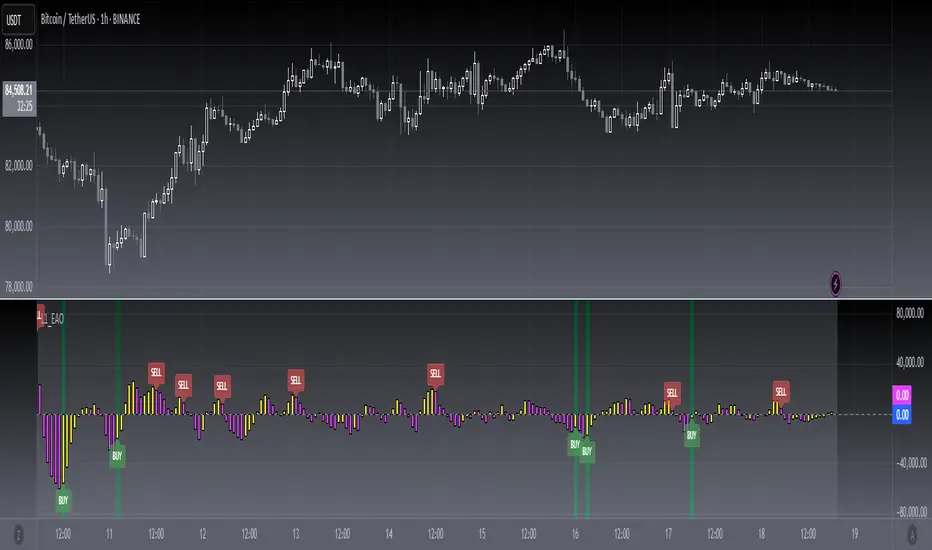
[blackcat] L1 Enhanced Awesome OscillatorLevel: 1
Background
The awesome oscillator is just that, an oscillator by Bill Williams. In contrast to the slow stochastics, which ranges from +100 to -100, the fantastic oscillator is limitless. On the surface, one might think that the fantastic oscillator is made up of a complicated algorithm developed by a Whiz Kid from M.I.T. You will be surprised to learn that the indicator is a basic calculation of two simple moving averages. I made some improvements on it by introducing some novel moving average functions and choppiness index as L1 Enhanced Awesome Oscillator.
Function
Yellow bars for bull and fuchsia bars for bear with candles. Buying and selling signal is provided. Divergence signal is provided. Choppiness index is used as a green background color, which indicates trends when it under green color. The choppiness index is used to filter out entry signals.
Key Signal
yellow candle --> bull
fuchsia candle --> bear
yellow DIV label --> bottom divergence
fuchsia DIV label --> top divergence
red SELL label --> short entry
green BUY label --> long entry
Remarks
Feedbacks are appreciated.
Readme
In real life, I am a prolific inventor. I have successfully applied for more than 60 international and regional patents in the past 12 years. But in the past two years or so, I have tried to transfer my creativity to the development of trading strategies. Tradingview is the ideal platform for me. I am selecting and contributing some of the hundreds of scripts to publish in Tradingview community. Welcome everyone to interact with me to discuss these interesting pine scripts.
The scripts posted are categorized into 5 levels according to my efforts or manhours put into these works.
Level 1 : interesting script snippets or distinctive improvement from classic indicators or strategy. Level 1 scripts can usually appear in more complex indicators as a function module or element.
Level 2 : composite indicator/strategy. By selecting or combining several independent or dependent functions or sub indicators in proper way, the composite script exhibits a resonance phenomenon which can filter out noise or fake trading signal to enhance trading confidence level.
Level 3 : comprehensive indicator/strategy. They are simple trading systems based on my strategies. They are commonly containing several or all of entry signal, close signal, stop loss, take profit, re-entry, risk management, and position sizing techniques. Even some interesting fundamental and mass psychological aspects are incorporated.
Level 4 : script snippets or functions that do not disclose source code. Interesting element that can reveal market laws and work as raw material for indicators and strategies. If you find Level 1~2 scripts are helpful, Level 4 is a private version that took me far more efforts to develop.
Level 5 : indicator/strategy that do not disclose source code. private version of Level 3 script with my accumulated script processing skills or a large number of custom functions. I had a private function library built in past two years. Level 5 scripts use many of them to achieve private trading strategy.
Gann RetracementThe indicator is based on W. D. Gann's method of retracement studies. Gann looked at stock retracement action in terms of Halves (1/2), Thirds (1/3, 2/3), Fifths (1/5, 2/5, 3/5, and 4/5) and more importantly the Eighths (1/8, 2/8, 3/8, 4/8, 5/8, 6/8, and 7/8). Needless to say, {2, 3, 5, 8} are the only Fibonacci numbers between 1 to 10. These ratios can easily be visualized in the form of division of a Circle as follows :
Divide the circle in 12 equal parts of 30 degree each to produce the Thirds :
30 x 4 = 120 is 1/3 of 360
30 x 8 = 240 is 2/3 of 360
The 30 degree retracement captures fundamental geometric shapes like a regular Triangle (120-240-360), a Square (90-180-270-360), and a regular Hexagon (60-120-180-240-300-360) inscribed inside of the circle.
Now, divide the circle in 10 equal parts of 36 degree each to produce the Fifths :
36 x 2 = 72 is 1/5 of 360
36 x 4 = 144 is 2/5 of 360
36 x 6 = 216 is 3/5 of 360
36 x 8 = 288 is 4/5 of 360
where, (72-144-216-288-360) is a regular Pentagon.
Finally, divide the circle in 8 equal parts of 45 degree each to produce the Eighths :
45 x 1 = 45 is 1/8 of 360
45 x 2 = 90 is 2/8 of 360
45 x 3 = 135 is 3/8 of 360
45 x 4 = 180 is 4/8 of 360
45 x 5 = 225 is 5/8 of 360
45 x 6 = 270 is 6/8 of 360
45 x 7 = 315 is 7/8 of 360
where, (45-90-135-180-225-270-315-360) is a regular Octagon.
How to Use this indicator ?
The indicator generates Gann retracement levels between any two significant price points, such as a high and a low.
Input :
Swing High (significant high price point, such as a top)
Swing Low (significant low price point, such as a bottom)
Degree (degree of retracement)
Output :
Gann retracement levels (color coded as follows) :
Swing High and Swing Low (BLUE)
50% retracement (ORANGE)
Retracements between Swing Low and 50% level (RED)
Retracements between 50% level and Swing High (LIME)

Quantitative Qualitative Estimation QQE
The QQE indicator is a momentum based indicator to determine trend and sideways.
The Qualitative Quantitative Estimation (QQE) indicator works like a smoother version of the popular Relative Strength Index (RSI) indicator. QQE expands on RSI by adding two volatility based trailing stop lines. These trailing stop lines are composed of a fast and a slow moving Average True Range (ATR). These ATR lines are smoothed making this indicator less susceptible to short term volatility.
The most common method of using QQE is to look for crosses of the fast and slow moving trailing stop lines during periods when the QQE line reflects overbought or oversold conditions
Qualitative Quantitative Estimation made up of a smoothed Relative Strength Index (RSI) indicator plus fast and slow volatility-based trailing levels.
Qualitative Quantitative Estimation can be used in two directions:
1.Determine the trend, i.e. if the line is above the 50 level, the trend is ascending, if below - descending;
2.Search for signals at the moment of crossing of the QQE FAST (maroon) and QQE SLOW (blue) lines.
The QQE itself is generally considered to indicate an up-trend ifQQE FAST is above QQE SLOW, and a down-trend if below QQE SLOW.
Often a middle-range between 40 and 60 is set and if the indicator is in that range, then the market is considered to be tracking sideways, or in no trend.
You will need to set only one parameter – “SF” "RSI SMoothing Factor", an analogue of the period in RSI.
By the way, judging from the open source information, the algorithm used the standard strength index with a period of 14 for calculations.
Various signals can be created from the indicator such as:
-Buy when QQE FAST crosses above QQE SLOW below 50 level or just buy when QQE lines crosses above 50 level.
-Sell when QQE FAST crosses below QQE SLOW above 50 level or just sell when QQE lines crosses below 50 level.
WARNING: QQE IS A RSI BASED INDICATOR SO THAT IT CAN TRIGGER FALSE SIGNALS DURING DIVERGENCES!
Kıvanç Özbilgiç

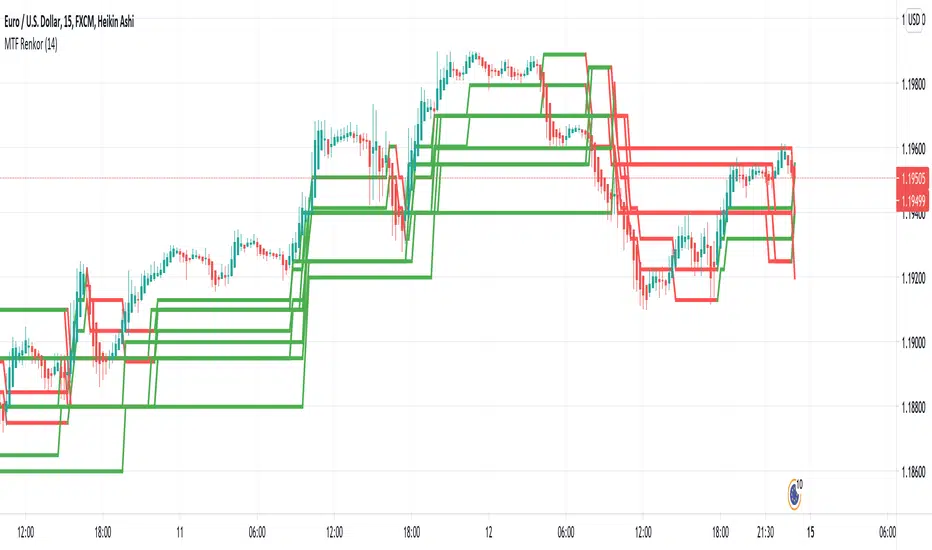
MTF RenkoThis indicator Should be opened on a 15 min chart
It will display the Renko Highs and lows of:
30 min chart
45 min chart
60 min chart
and
120 min chart
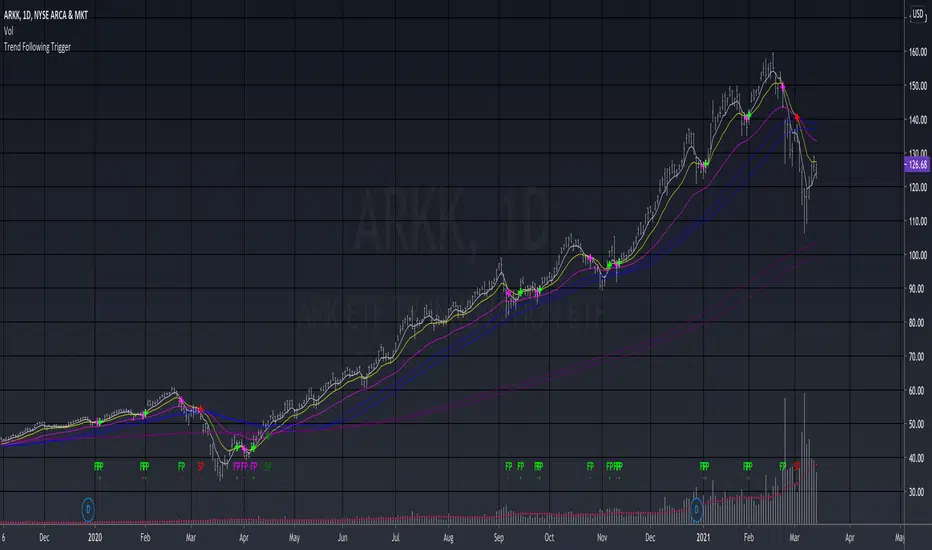
Trend Following TriggerThis is a basic trend following system that using 5, 13, 34 EMAs cross-overs as triggers.
The 5,13 EMA pair is tracking the short-term momentum , when 5 EMA crosses over 13 EMA up or down, the script will develop a bullish "fast pivot" point or "FP" , which can be used as the first entry of a position.
The 13, 34 EMA pair is tracking the mid-term trend , when the 13 EMA crosses over 34 EMA up or down, the script will develop a bullish "slow pivot" point or "SP" , which can be used as the second entry of a position.
And the exit would be when a bearish "Slow Pivot" is created.
Note that the basic assumption of trend following is that you should trade with the trend, not against the trend. Thus I added the 50, 60 MA pair, as well as 200, 220 MA pair for long-term trend reference, which is an idea that I learned from the Vegas Tunneling Trading System.
Example,
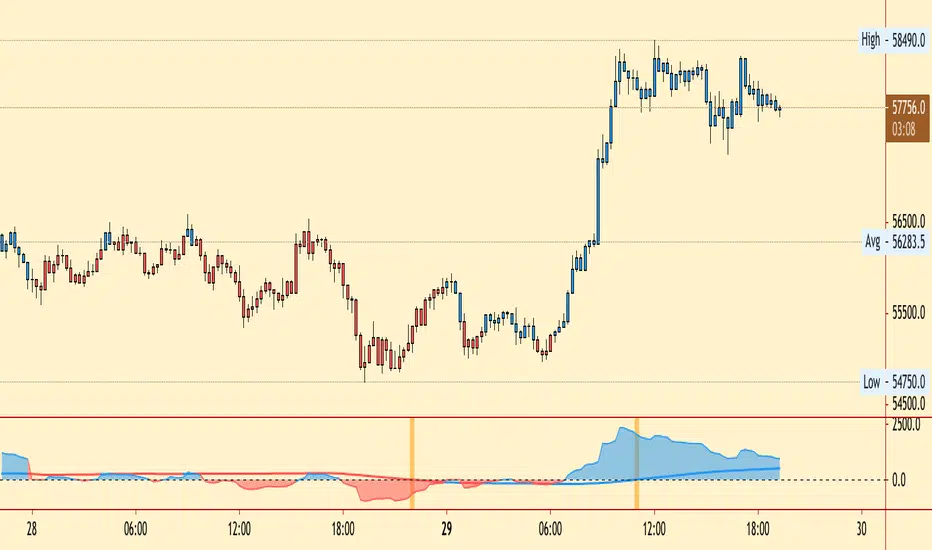
Percentage S&RThis indicator can be used to provide "hidden" Support and Resistance levels, which can be useful for profit-taking and stop-loss levels on swing trades.
The middle white line is the midpoint of the range of the previous 60 candles.
The grey lines above equal the midpoint line +5%, +10%, +15% and +20%.
The grey lines below equal the midpoint line -5%, -10%, -15% and -20%.
This indicator is similar to a Moving Average Envelope, but without the lag.
Doesn't work as well on the extreme low or high time frames. 1 hour - Daily charts seem to be best.

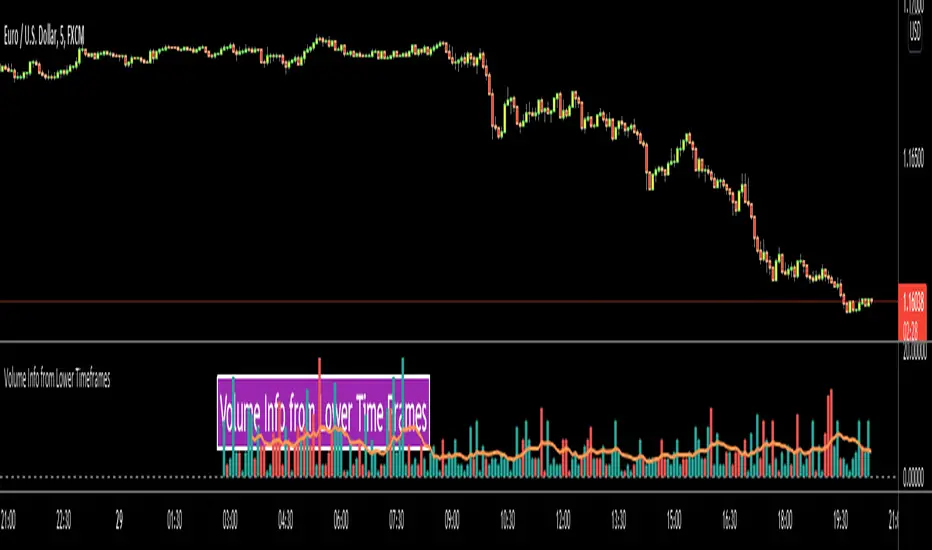
Volume Info from Lower Time FramesHello Traders,
We are now able to get info from lower time frames, Many Thanks to Pine Team .This script gets volume info from lower time frames and give alert if there is extreme volumes on last X lower time frame candles (if last X volumes are higher than volume moving average). so that if you set alerts on different securities then you will be able get alert if there is extreme volume moves and you can check the chart immediately.
The options:
Timeframe in Seconds : you can set lower time frames in seconds. by default it's 5 seconds. if you set it 60 then it will show 1min volumes, if you set it 1 then it will show 1 seconds volumes
MA Length : The script draws simple moving average using this length info. by default it's 20.
Number of Bars to Check for Alert : by default it's 5. meaning that if last 5 candles is greater than moving average and if you set alert then you get the alert "Extreme Volume"
Other options are for colors and line width.
As you can see in following example, chart time frame is 1 hour and the script shows volume info of 5 seconds candles:
Enjoy!
Matrix Library (Linear Algebra, incl Multiple Linear Regression)What's this all about?
Ever since 1D arrays were added to Pine Script, many wonderful new opportunities have opened up. There has been a few implementations of matrices and matrix math (most notably by TradingView-user tbiktag in his recent Moving Regression script: ). However, so far, no comprehensive libraries for matrix math and linear algebra has been developed. This script aims to change that.
I'm not math expert, but I like learning new things, so I took it upon myself to relearn linear algebra these past few months, and create a matrix math library for Pine Script. The goal with the library was to make a comprehensive collection of functions that can be used to perform as many of the standard operations on matrices as possible, and to implement functions to solve systems of linear equations. The library implements matrices using arrays, and many standard functions to manipulate these matrices have been added as well.
The main purpose of the library is to give users the ability to solve systems of linear equations (useful for Multiple Linear Regression with K number of independent variables for example), but it can also be used to simulate 2D arrays for any purpose.
So how do I use this thing?
Personally, what I do with my private Pine Script libraries is I keep them stored as text-files in a Libraries folder, and I copy and paste them into my code when I need them. This library is quite large, so I have made sure to use brackets in comments to easily hide any part of the code. This helps with big libraries like this one.
The parts of this script that you need to copy are labeled "MathLib", "ArrayLib", and "MatrixLib". The matrix library is dependent on the functions from these other two libraries, but they are stripped down to only include the functions used by the MatrixLib library.
When you have the code in your script (pasted somewhere below the "study()" call), you can create a matrix by calling one of the constructor functions. All functions in this library start with "matrix_", and all constructors start with either "create" or "copy". I suggest you read through the code though. The functions have very descriptive names, and a short description of what each function does is included in a header comment directly above it. The functions generally come in the following order:
Constructors: These are used to create matrices (empy with no rows or columns, set shape filled with 0s, from a time series or an array, and so on).
Getters and setters: These are used to get data from a matrix (like the value of an element or a full row or column).
Matrix manipulations: These functions manipulate the matrix in some way (for example, functions to append columns or rows to a matrix).
Matrix operations: These are the matrix operations. They include things like basic math operations for two indices, to transposing a matrix.
Decompositions and solvers: Next up are functions to solve systems of linear equations. These include LU and QR decomposition and solvers, and functions for calculating the pseudo-inverse or inverse of a matrix.
Multiple Linear Regression: Lastly, we find an implementation of a multiple linear regression, including all the standard statistics one can expect to find in most statistical software packages.
Are there any working examples of how to use the library?
Yes, at the very end of the script, there is an example that plots the predictions from a multiple linear regression with two independent (explanatory) X variables, regressing the chart data (the Y variable) on these X variables. You can look at this code to see a real-world example of how to use the code in this library.
Are there any limitations?
There are no hard limiations, but the matrices uses arrays, so the number of elements can never exceed the number of elements supported by Pine Script (minus 2, since two elements are used internally by the library to store row and column count). Some of the operations do use a lot of resources though, and as a result, some things can not be done without timing out. This can vary from time to time as well, as this is primarily dependent on the available resources from the Pine Script servers. For instance, the multiple linear regression cannot be used with a lookback window above 10 or 12 most of the time, if the statistics are reported. If no statistics are reported (and therefore not calculated), the lookback window can usually be extended to around 60-80 bars before the servers time out the execution.
Hopefully the dev-team at TradingView sees this script and find ways to implement this functionality diretly into Pine Script, as that would speed up many of the operations and make things like MLR (multiple linear regression) possible on a bigger lookback window.
Some parting words
This library has taken a few months to write, and I have taken all the steps I can think of to test it for bugs. Some may have slipped through anyway, so please let me know if you find any, and I'll try my best to fix them when I have time to do so. This library is intended to help the community. Therefore, I am releasing the library as open source, in the hopes that people may improving on it, or using it in their own work. If you do make something cool with this, or if you find ways to improve the code, please let me know in the comments.

Grid Bot RSIGrid Bot Simulator. Based on RSI levels.
How it works:
Prices are divided into grids, or trade zones, that are based on RSI levels. Buys will trigger when the RSI crosses into a higher zone, after descending. Sells will trigger when the RSI crosses into a lower zone, after ascending. After triggering, a new signal will not be produced until the RSI progresses into better zone.
Standard Settings :
RSI Length
Number of Grids
RSI Type : Standard RSI or Jurik RSX (based on Everget’s formula)
Show All Grids
Experimental Features (Adjust in settings menu) :
No Trade Zone : RSI Levels where no trades will be signaled. Adjust to prevent over-buying/selling in narrow markets. Default: 35-65:
No Trade Zone (40-60)
Aggression Level : Increase aggressiveness to stack buys/sells at extreme RSI levels:
Aggression = high
Aggression = low
Market Direction : If market is trending up, the bot will skip every other sell ( = more buys than sells). If down, will skip every other buy (more sells than buys). Default: neutral.
Market Direction: down
Market Direction: neutral

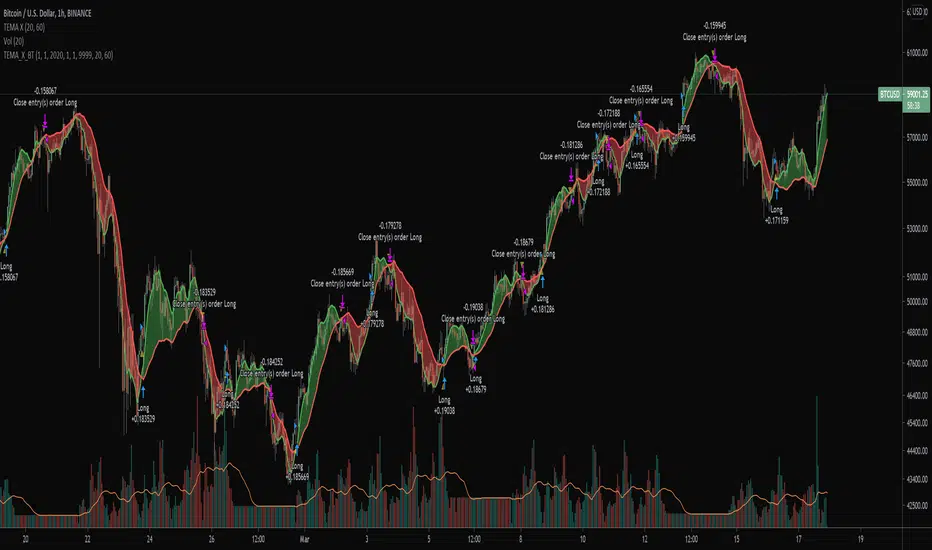
TEMA Cross BacktestA simple strategy backtest using two Triple Exponential Moving Averages (TEMA) crossing up and down. The default is a 20 TEMA crossing above 60 TEMA generates a long signal. Short signals are turned off by default, but included in the code at the last 2 lines (remove the '//').
Parts of script borrowed from other public scripts.
RSI Classic Strategy (by Coinrule)One of the questions hobbyist traders more often ask is: what is the perfect trading indicator?
Every indicator is just a tool, so its efficiency is proportional to your ability to read its signals and translate them into an actionable trading strategy. The RSI is likely the most flexible and easy to use among the technical indicators.
This trading strategy tries to catch short-term swings on the coins of your choice with a simple yet profitable setup.
Buy when the RSI is lower than 30 (you can adjust it to 35 in times of steep uptrend).
Sell when the RSI is greater than 65 (the target may range between 60 and 75 depending on the volatility of the coin).
Note that the buy signal comes when the indicator crosses below 30 and not when it crosses above 30 as it happens on the built-in RSI strategy on Tradingview.
The present script overperforms the built-in strategy, even adding trading fees and using a lower amount of capital for each trade (30%). That means that the system can deliver higher net-profits with lower risk levels.
A typical example of market conditions where this strategy works perfectly is as follows.
The first initial breakout indicates that a new leg up in the trend may start. Bitcoin starts to trade within a range which you can identify when it reaches the point 3. That is the perfect time to start the rule because
- trading within a channel anticipates possible swings up and down
- the trend is on the upside, providing low downside risk in buying the dips.
This strategy works well with selected coins of your choice, and it's a great fit on leverage exchanges like Binance Futures.
If you prefer to run it across all available coins on the market, instead, you may choose an optimized version.

New Map For TradersUsing previous principles, This setup plots 60 moving averages on the chart. The averages are colored using a normalized oscillation technique (FFT).
To achieve the same display as above, put the same indicator twice and set the 'osx' parameter of one to 0 and the other to 2.
Feel free to play with the 'mul' parameter in ranges between 1-90. Most useful ranges will be 4-16 in my opinion.
Leave me a message if you'd like to explore the behaviors of the fractal dimension further ;)

Initial Balance Markets Time ZonesThe below script is based on Initial Balance.
Initial Balance is based on the highest and lowest points of Price Action (PA) within the first 60 minutes of trading. There is so much information available online, reference Initial Balance, that I have not provided a reference.
Most indicators I have seen have been solely based on UTC 0000 Initial Balance. My aim with this indicator was to be able to visualize how other time zones market openings Initial Balance affect PA.
The three market openings I chose to code in are:
London 0800 to 0900
New York 1430 to 1530
Asia 0000 to 0100
Within the script I have given the user the option to select to see with a green or red background when PA is above all zones Initial Balance high (green) or PA is below all zones Initial Balance low (red).
Alerts are also coded in, to prompt the user that PA has gone above or below as per above.
The Initial Balance high and lows also offer another form of areas of confluence.
Below are some examples of IB in action:
LTC
NULS
UNFI
DEXE
