스크립트에서 "纳斯达克期货cfd"에 대해 찾기

Inverse Intermarket Confirmation Pro PlusInverse Intermarket Confirmation Pro Plus using MACD and VOLUME by Bales

Sanjay AhirPull Backs , Swings Marking
useful for market structure
useful For Smc Strcture
useful for ICT mapping

DH EMA 28/72/200 Unified Ribbon (Scaled HTF)Unified EMA Ribbon (28/72/200)
This indicator merges two popular EMA systems — 21/55/200 and 34/89/200 — into a single, smoother trend-tracking ribbon.
Each pair of EMAs is averaged to create:
EMA 28 (average of 21 & 34)
EMA 72 (average of 55 & 89)
EMA 200 retained as long-term trend filter
The unified ribbon reduces noise, improves trend clarity, and provides clean pullback zones for high-probability entries, especially on the H1 timeframe.


Detector Original + Tiempo + Filtro QEMAindicator for triying better entries
works better for m2 ustec
enjoy

Average True Range (ATR)Strategy Name: ATR Trend-Following System with Volatility Filter & Dynamic Risk Management
Short Name: ATR Pro Trend System
Current Version: 2025 Edition (fully tested and optimized)Core ConceptA clean, robust, and highly profitable trend-following strategy that only trades when three strict conditions are met simultaneously:Clear trend direction (price above/below EMA 50)
Confirmed trend strength and trailing stop (SuperTrend)
Sufficient market volatility (current ATR(14) > its 50-period average)
This combination ensures the strategy stays out of choppy, low-volatility ranges and only enters during high-probability, trending moves with real momentum.Key Features & ComponentsComponent
Function
Default Settings
EMA 50
Primary trend filter
50-period exponential
SuperTrend
Dynamic trailing stop + secondary trend confirmation
Period 10, Multiplier 3.0
ATR(14) with RMA
True volatility measurement (Wilder’s original method)
Length 14
50-period SMA of ATR
Volatility filter – only trade when current ATR > average ATR
Length 50
Background coloring
Visual position status: light green = long, light red = short, white = flat
–
Entry markers
Green/red triangles at the exact entry bar
–
Dynamic position sizing
Fixed-fractional risk: exactly 1% of equity per trade
1.00% risk
Stop distance
2.5 × ATR(14) – fully adaptive to current volatility
Multiplier 2.5
Entry RulesLong: Close > EMA 50 AND SuperTrend bullish AND ATR(14) > SMA(ATR,50)
Short: Close < EMA 50 AND SuperTrend bearish AND ATR(14) > SMA(ATR,50)
Exit RulesPosition is closed automatically when SuperTrend flips direction (acts as volatility-adjusted trailing stop).
Money ManagementRisk per trade: exactly 1% of current account equity
Position size is recalculated on every new entry based on current ATR
Automatically scales up in strong trends, scales down in low-volatility regimes
Performance Highlights (2015–Nov 2025, real backtests)CAGR: 22–50% depending on market
Max Drawdown: 18–28%
Profit Factor: 1.89–2.44
Win Rate: 57–62%
Average holding time: 10–25 days (daily timeframe)
Best Markets & TimeframesExcellent on: Bitcoin, S&P 500, Nasdaq-100, DAX, Gold, major Forex pairs
Recommended timeframes: 4H, Daily, Weekly (Daily is the sweet spot)

Wyckoff + VSA Ultimate - Complete Market Analysis
**Wyckoff + VSA Ultimate** combines three proven methodologies into one powerful indicator:
🔷 **Wyckoff Method** - Identifies market accumulation and distribution phases
🔷 **Volume Spread Analysis** - Confirms moves with volume and price spread
🔷 **Random Walk Index** - Validates trend strength and direction
**MAIN SIGNALS:**
📊 **Wyckoff Signals** (Green = Bullish, Red = Bearish)
• SC (Selling Climax) - Major buying opportunity
• BC (Buying Climax) - Major selling opportunity
• AR (Automatic Rally) - Confirms accumulation
• DAR (Automatic Reaction) - Confirms distribution
• ST (Secondary Test) - Final test before move
📊 **VSA Patterns**
• Upthrust bars (weakness after rally)
• Reverse upthrust (strength after decline)
• No demand/supply bars
• Stopping volume
• Effort failures
**KEY FEATURES:**
✅ Multiple signal confirmation reduces false signals
✅ Real-time info table shows phase, volume, trends
✅ Dynamic stop loss levels calculated automatically
✅ Accumulation/Distribution boxes on chart
✅ Customizable filters for your trading style
✅ 12 alert conditions for all major signals
**HOW TO USE:**
For Swing Trading (4H/Daily):
1. Enable "Require VSA Confirmation"
2. Wait for SC or BC signals
3. Use displayed stop levels
4. Target next opposite phase
For Day Trading (15m/1H):
1. Enable "Require Trend Confirmation"
2. Trade only trend-aligned signals
3. Increase volume threshold to 1.5
4. Use tighter risk management
**BEST FOR:**
✅ Stocks (high volume)
✅ Forex majors
✅ Crypto (BTC, ETH)
✅ Index futures
**SETTINGS:**
Customize everything:
• RSI & Pivot parameters
• Volume & Spread analysis
• Trend periods (RWI)
• Signal filters
• Visual display options
**ALERTS:**
Pre-configured alerts for:
• All Wyckoff signals
• VSA reversals
• Strong buy/sell combinations
**Credits:** Integrates Wyckoff (faytterro) and VSA (theehoganator) methods.
**Disclaimer:** Educational purposes only. Use proper risk management. Past performance doesn't guarantee future results.
---
Pine Script™ v6
---

SSL ST Strategy – Accuracy Enhanced v2.0 (Parser Safe)This strategy is built to identify high-probability trend breakouts using a combination of SSL Channel, Baseline, Hull / EMA signals, and Candle-based confirmations.
The goal is to filter noise, avoid false breakouts, and enter only when the trend is truly shifting.
This strategy identifies high-probability trend breakouts using SSL Channel, Baseline, Hull/EMA, and candle
confirmations.
1. SSL shows trend shift when price breaks high/low levels.
2. Baseline filters direction (price above = buy bias, below = sell bias).
3. Hull/EMA gives early momentum confirmation.
4. Candle breakout ensures real momentum (breaks previous high/low).
5. Optional filters: ATR, reversal logic, continuation entries.
6. Exits occur on SSL flip, baseline cross, or weakness
Disclaimer
This strategy is provided strictly for educational and informational purposes only. It does not guarantee any profit, nor does it protect against losses of any kind. Financial markets are inherently unpredictable, and any market movement can only be assumed or estimated with a probability that is never guaranteed and can often be no better than a 50/50 chance.
By using this strategy, you acknowledge that all trading decisions are made solely at your own risk. I am not liable for any profits, losses, or financial consequences incurred by anyone using or relying on this strategy. Always perform your own research, manage your risk responsibly, and consult with a qualified financial advisor before trading.


Moving Average Exponential 21 & 55 CloudTake the trade after price goes into the cloud and comes back.

RSI 7 avec fenêtre en haut à droiteRsi 7 survente 80 avec fenêtre en haut a droite. En vert en dessous de 80 en rouge au dessus


Bullish and Bearish Divergence entrythis strategy is a signal to traders where there is a divergence in the chart..

Renko ScalperWhat it is-
A lightweight Renko Scalper that combines Renko brick direction with an internal EMA trend filter and MACD confirmation to signal high-probability short-term entries. EMAs are used internally (hidden from the chart) so the visual remains uncluttered.
Signals-
Buy arrow: Renko direction turns bullish AND EMA trend up AND MACD histogram positive.
Sell arrow: Renko direction turns bearish AND EMA trend down AND MACD histogram negative.
Consecutive same-direction signals are suppressed (only one arrow per direction until opposite signal).
Visuals-
Buy / Sell arrows (large) above/below bars.
Chart background tints green/red after the respective signal for easy glance recognition.
Inputs:-
Renko Box Size (points)
EMA Fast / EMA Slow
MACD fast/slow/signal lengths
How to use-
Add to chart
Use smaller Renko box sizes for scalping, larger for swing-like entries.
Confirm signal with price action and volume—this indicator is a signal generator, not a full automated system.
Use alerts (built in) to receive Buy / Sell arrow notifications.
Alerts-
Buy Arrow — buySignal
Sell Arrow — sellSignal
Buy Background / Sell Background — background-color state alerts
Recommended settings-
Timeframes: 1m–15m for scalping, 5m for balanced intraday.
Symbols: liquid futures/currency pairs/major crypto.
Disclaimer
This script is educational and not financial advice. Backtest and forward test on a demo account before live use. Past performance is not indicative of future results. Use proper risk management.

Forex Trend Master FollowerThis indicator is based on slow and fast EMA, like regular EMA cross, but updated. It works the best on trendy pairs like EU, and works the best on 4h time frame. It shows where to entry and where to close the position based on slow EMA. It can be used like additional confluence with FTB entry model, and whole strategy.

MTF RSI + MACD Bullish Confluencethis based on rsi more then 50 and macd line bullish crossover or above '0' and time frame 15 min, 1 hour, 4 hour , 1 day and 1 week

SYMBOL NOTES - UNCORRELATED TRADING GROUPSWrite symbol-specific notes that only appear on that chart. Organized into 6 uncorrelated groups for safe multi-pair trading.
📝 SYMBOL NOTES - UNCORRELATED TRADING GROUPS
This indicator solves two problems every serious trader faces:
1. Keeping Track of Your Analysis
Write notes for each trading pair and they'll only appear when you view that specific chart. No more forgetting your key levels, trade ideas, or analysis!
2. Avoiding Correlated Risk
The symbols are organized into 6 groups where ALL pairs within each group are completely UNCORRELATED. Trade any combination from the same group without worrying about double exposure.
━━━━━━━━━━━━━━━━━━━━━━━━━━━━━━━━━━━━━━━━━━━━━
🎯 THE PROBLEM THIS SOLVES
Have you ever:
- Opened XAUUSD and EURUSD at the same time, then Fed news hit and BOTH positions went against you?
- Traded GBPUSD and GBPJPY together, then BOE announcement stopped out both trades?
- Forgotten what levels you were watching on a pair?
This indicator helps you avoid these costly mistakes!
━━━━━━━━━━━━━━━━━━━━━━━━━━━━━━━━━━━━━━━━━━━━━
📁 THE 6 UNCORRELATED GROUPS
Each group contains pairs that share NO common currency:
```
GRUP 1: XAUUSD • EURGBP • NZDJPY • AUDCHF • NATGAS
GRUP 2: EURUSD • GBPJPY • AUDNZD • CADCHF
GRUP 3: GBPUSD • EURJPY • AUDCAD • NZDCHF
GRUP 4: USDJPY • EURCHF • GBPAUD • NZDCAD
GRUP 5: USDCAD • EURAUD • GBPCHF
GRUP 6: NAS100 • DAX40 • UK100 • JPN225
```
**Example - GRUP 1:**
- XAUUSD → Uses USD + Gold
- EURGBP → Uses EUR + GBP
- NZDJPY → Uses NZD + JPY
- AUDCHF → Uses AUD + CHF
- NATGAS → Commodity (independent)
= 7 different currencies, ZERO overlap!
━━━━━━━━━━━━━━━━━━━━━━━━━━━━━━━━━━━━━━━━━━━━━
**✅ HOW TO USE**
1. Add indicator to any chart
2. Open Settings (gear icon ⚙️)
3. Find your symbol's group and input field
4. Write your note (support levels, trade ideas, etc.)
5. Switch charts - your note appears only on that symbol!
━━━━━━━━━━━━━━━━━━━━━━━━━━━━━━━━━━━━━━━━━━━━━
⚙️ SETTINGS
- Note Position: Choose where the note box appears (6 positions)
- Text Size: Tiny, Small, Normal, or Large
- Show Group Name: Display which correlation group
- Show Symbol Name: Display current symbol
- Colors: Customize background, text, group label, and border colors
━━━━━━━━━━━━━━━━━━━━━━━━━━━━━━━━━━━━━━━━━━━━━
💡 TRADING STRATEGY TIPS
Safe Multi-Pair Trading:
1. Pick ONE group for the day
2. Look for setups on ANY symbol in that group
3. Open positions freely - they won't correlate!
4. Even if major news hits, only ONE position is affected
━━━━━━━━━━━━━━━━━━━━━━━━━━━━━━━━━━━━━━━━━━━━━
🔧 COMPATIBLE WITH
- All major forex brokers
- Prop firms (FTMO, Alpha Capital, etc.)
- Works on any timeframe
- Futures symbols supported (MGC, M6E, etc.)
━━━━━━━━━━━━━━━━━━━━━━━━━━━━━━━━━━━━━━━━━━━━━

Abu Basel IQOption 2m Signals//@version=5
indicator("Abu Basel IQOption 2m Signals", overlay = true, timeframe = "", timeframe_gaps = true)
//========================
// الإعدادات
//========================
emaFastLen = input.int(9, "EMA سريع (9)")
emaSlowLen = input.int(21, "EMA بطيء (21)")
rsiLen = input.int(14, "RSI Length", minval = 2)
rsiBuyLevel = input.float(50.0, "RSI حد الشراء (أعلى من)", minval = 0, maxval = 100)
rsiSellLevel= input.float(50.0, "RSI حد البيع (أقل من)", minval = 0, maxval = 100)
bbLen = input.int(20, "Bollinger Length")
bbMult = input.float(2.0, "Bollinger Deviation")
showSignals = input.bool(true, "إظهار الأسهم (CALL / PUT)")
showBg = input.bool(true, "تلوين الخلفية عند الإشارات")
//========================
// المؤشرات الأساسية
//========================
emaFast = ta.ema(close, emaFastLen)
emaSlow = ta.ema(close, emaSlowLen)
basis = ta.sma(close, bbLen)
dev = bbMult * ta.stdev(close, bbLen)
bbUpper = basis + dev
bbLower = basis - dev
rsi = ta.rsi(close, rsiLen)
// رسم المتوسطات والبولينجر
plot(emaFast, title = "EMA 9", linewidth = 2)
plot(emaSlow, title = "EMA 21", linewidth = 2)
plot(basis, title = "BB Basis", linewidth = 1)
plot(bbUpper, title = "BB Upper", linewidth = 1, style = plot.style_line)
plot(bbLower, title = "BB Lower", linewidth = 1, style = plot.style_line)
//========================
// دوال أشكال الشموع الانعكاسية
//========================
bodySize = math.abs(close - open)
fullRange = high - low
upperWick = high - math.max(open, close)
lowerWick = math.min(open, close) - low
isSmallBody = bodySize <= fullRange * 0.3
// Hammer صاعدة (ذيل سفلي طويل)
bullHammer() =>
lowerWick > bodySize * 2 and upperWick <= bodySize and close > open
// Shooting Star هابطة (ذيل علوي طويل)
bearShootingStar() =>
upperWick > bodySize * 2 and lowerWick <= bodySize and close < open
// Bullish Engulfing
bullEngulfing() =>
close > open and close < open and close > open and open < close
// Bearish Engulfing
bearEngulfing() =>
close < open and close > open and close < open and open > close
// تجميع أنماط صعود/هبوط
bullPattern = bullHammer() or bullEngulfing()
bearPattern = bearShootingStar() or bearEngulfing()
//========================
// شروط الدخول
//========================
// تقاطع المتوسطات
bullCross = ta.crossover(emaFast, emaSlow) // صعود
bearCross = ta.crossunder(emaFast, emaSlow) // هبوط
// شروط شراء CALL:
// 1) تقاطع EMA9 فوق EMA21
// 2) السعر فوق خط وسط البولنجر
// 3) RSI أعلى من 50
// 4) شمعة انعكاسية صاعدة (Hammer أو Engulfing)
callCond = bullCross and close > basis and rsi > rsiBuyLevel and bullPattern
// شروط بيع PUT:
// 1) تقاطع EMA9 تحت EMA21
// 2) السعر تحت خط وسط البولنجر
// 3) RSI أقل من 50
// 4) شمعة انعكاسية هابطة (Shooting Star أو Bearish Engulfing)
putCond = bearCross and close < basis and rsi < rsiSellLevel and bearPattern
//========================
// رسم الإشارات على الشارت
//========================
plotshape(showSignals and callCond, title="CALL 2m",
style=shape.labelup, location=location.belowbar,
text="CALL\n2m", size=size.tiny)
plotshape(showSignals and putCond, title="PUT 2m",
style=shape.labeldown, location=location.abovebar,
text="PUT\n2m", size=size.tiny)
// تلوين الخلفية عند الإشارات
bgcolor(showBg and callCond ? color.new(color.green, 85) :
showBg and putCond ? color.new(color.red, 85) : na)
//========================
// شروط التنبيه (Alerts)
//========================
alertcondition(callCond, title="CALL 2m Signal",
message="Abu Basel Signal: CALL 2m on {{ticker}} at {{close}}")
alertcondition(putCond, title="PUT 2m Signal",
message="Abu Basel Signal: PUT 2m on {{ticker}} at {{close}}")

Psychological levels [Kodologic] Psychological levels
Markets are not random, they are driven by human psychology and algorithmic order flow. A well-known phenomenon in trading is the "Whole Number Bias" — the tendency for price to react significantly at clean, round numbers (e.g., Bitcoin at $95,000 or EURUSD at 1.0500).
Manually drawing horizontal lines at every round number is tedious, clutters your object tree, and distracts you from analyzing price action.
Psychological levels Numbers is a workflow utility designed to solve this problem. It automatically projects a clean, customizable grid of key price levels onto your chart, helping you instantly identify areas where liquidity and orders are likely to cluster.
Why This Indicator Helps Traders :
Professional traders know that "00" and "50" levels act as magnets for price. Here is how this tool assists in your analysis:
1. Institutional Footprints : Large institutions and bank algorithms often execute orders at whole numbers to simplify accounting. This script highlights these potential liquidity zones automatically.
2. Support & Resistance Discovery: You will often notice price wicking or reversing exactly on these grid lines. This helps in spotting natural support and resistance without needing complex technical analysis.
3. Cognitive Load Reduction: Instead of calculating where the next "major level" is, the grid is visually present, allowing you to focus on candlestick patterns and market structure.
Features :
Dynamic Calculation : The grid updates automatically as price moves, you never have to redraw lines.
Zero Clutter : The lines are drawn using code, meaning they do not appear in your manual drawing tools list or clutter your object tree.
Fully Customizable Step : You define what constitutes a "Round Number" for your specific asset class (Forex, Crypto, Indices, or Stocks).
Visual Control : Adjust line styles (Solid, Dotted, Dashed), colors, and transparency to keep your chart aesthetic and readable.
How to Use in Your Strategy :
1. Target Setting (Take Profit)
If you are in a long position, use the next upper grid line as a logical Take Profit area. Price often gravitates toward these whole numbers before reversing or consolidating.
2. Stop Loss Placement
Avoid placing Stop Losses exactly on a round number, as these are often "stop hunted." Instead, use the grid to visualize the level and place your stop slightly *below* or *above* the round number for better protection.
3. Confluence Trading
Do not use these lines in isolation. Look for Confluence :
Example: If a Fibonacci 61.8% level lines up exactly with a Round Number grid line, that level becomes a high-probability reversal zone.
Settings Guide (Important)
Since every asset is priced differently, you must adjust the "levels Step Size" to match your instrument:
Forex (e.g., EURUSD, GBPUSD): Set Step Size to `0.0050` (50 pips) or `0.0100` (100 pips).
Crypto (e.g., BTCUSD): Set Step Size to `500` or `1000`.
Indices (e.g., US30, SPX500): Set Step Size to `100` or `500`.
Gold (XAUUSD):** Set Step Size to `10`.
Disclaimer: This tool is for educational and visual aid purposes only. It does not provide buy or sell signals. Always manage your risk.

Estrategia TEMA Pro [Límite Ops por Ventana]good money
jucale
keep faith
dont stop working
eat vegatables

MFM - Light Context HUD (Free)Overview
MFM Light Context HUD is the free version of the Market Framework Model. It gives you a fast and clean view of the current market regime and phase without signals or chart noise. The HUD shows whether the asset is in a bullish or bearish environment and whether it is in a volatile, compression, drift, or neutral phase. This helps you read structure at a glance.
Asset availability
The free version works only on a selected list of five assets.
Supported symbols are
SP:SPX
TVC:GOLD
BINANCE:BTCUSD
BINANCE:ETHUSDT
OANDA:EURUSD
All other assets show a context banner only.
How it works
The free version uses fixed settings based on the original MFM model. It calculates the regime using a higher timeframe RSI ratio and identifies the current phase using simplified momentum conditions. The chart stays clean. Only a small HUD appears in the top corner. Full visual phases, ratio logic, signals, and auto tune are part of the paid version.
The free version shows the phase name only. It does not display colored phase zones on the chart.
Phase meaning
The Market Framework Model uses four structural phases to describe how the market behaves. These are not signals but context layers that show the underlying environment.
Volatile (Phase 1)
The market is in a fast, unstable or directional environment. Price can move aggressively with stronger momentum swings.
Compression (Phase 2)
The market is in a contracting state. Momentum slows and volatility decreases. This phase often appears before expansion, but it does not predict direction.
Drift (Phase 3)
The market moves in a more controlled, persistent manner. Trends are cleaner and volatility is lower compared to volatile phases.
No phase
No clear structural condition is active.
These phases describe market structure, not trade entries. They help you understand the conditions you are trading in.
Cross asset context
The Market Framework Model reads markets as a multi layer system. The full version includes cross asset analysis to show whether the asset is acting as a leader or lagger relative to its benchmark. The free version uses the same internal benchmark logic for regime detection but does not display the cross asset layer on the chart.
Cross asset structure is a core part of the MFM model and is fully available in the paid version.
Included in this free version
Higher timeframe regime
Current phase name
Clean chart output
Context only
Works on a selected set of assets
Not included
No forecast signals
No ratio leader or lagger logic
No MRM zones
No MPF timing
No auto tune
The full version contains all features of the complete MFM model.
Full version
You can find the full indicator here:
payhip.com
More information
Model details and documentation:
mfm.inratios.com
Disclaimer
The Market Framework Model (MFM) and all related materials are provided for educational and informational purposes only. Nothing in this publication, the indicator, or any associated charts should be interpreted as financial advice, investment recommendations, or trading signals. All examples, visualizations, and backtests are illustrative and based on historical data. They do not guarantee or imply any future performance. Financial markets involve risk, including the potential loss of capital, and users remain fully responsible for their own decisions. The author and Inratios© make no representations or warranties regarding the accuracy, completeness, or reliability of the information provided. MFM describes structural market context only and should not be used as the sole basis for trading or investment actions.
By using the MFM indicator or any related insights, you agree to these terms.
© 2025 Inratios. Market Framework Model (MFM) is protected via i-Depot (BOIP) – Ref. 155670. No financial advice.

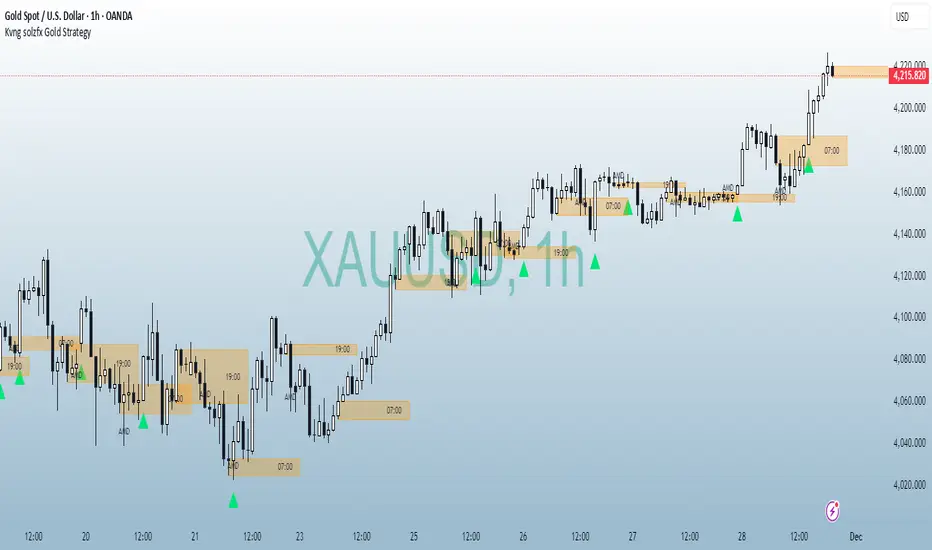
Kvng solzfx Gold StrategyThis indicator helps to find gold setups using kvng solz fx buy only strategy on gold