Indicator ***TuYa*** V8.2 – HH/HL MTF + Peak Mid ZoneIndicator TuYa V8.0 – HH/HL MTF + Peak Mid Zone
TuYa V8.0 combines multi-timeframe market structure with a Peak Reaction midline to create clean, rule-based reversal and trend entries – designed primarily for 1-minute execution with 1-hour bias.
🧠 Core Concept
This indicator fuses three ideas:
HTF Peak Reaction Midline (1H)
Uses a Peak Reaction style logic on the higher timeframe (HTF, default: 1H).
Identifies a reaction high and reaction low, then calculates their midpoint → the Peak Mid Zone.
This midline acts as a dynamic sentiment divider (above = premium / below = discount).
Multi-Timeframe HH/HL/LH/LL Structure
HTF structure (1H): detects HH, HL, LH, LL using pivot highs/lows.
LTF structure (1m): detects HH, HL, LH, LL on the execution timeframe (chart TF, intended for 1m).
HTF → LTF Confirmation Window
After a 1H structure event (HH, HL, LL, LH), the indicator opens a confirmation window of up to N LTF candles (default: 10 x 1m bars).
Within that window, the required 1m structure event must occur to confirm an entry.
🎯 Signal Logic
All entries are generated on the LTF (e.g. 1m chart), using HTF (e.g. 1H) bias + Peak Mid Zone:
1️⃣ Price ABOVE Peak Mid (Bullish premium zone)
Reversal SELL
HTF: HH (Higher High)
Within N 1m bars: LTF HH
→ SELL signal (fading HTF strength near premium)
Trend/Bullish BUY
HTF: HL (Higher Low)
Within N 1m bars: LTF LL
→ BUY signal (buying dips in an uptrend above midline)
2️⃣ Price BELOW Peak Mid (Bearish discount zone)
Reversal BUY
HTF: LL (Lower Low)
Within N 1m bars: LTF LL
→ BUY signal (catching potential reversal from discount)
Trend/Bearish SELL
HTF: LH (Lower High)
Within N 1m bars: LTF HH
→ SELL signal (shorting strength in a downtrend below midline)
Signals are plotted as small BUY/SELL triangles on the chart and exposed via alert conditions.
🧾 Filters & Options
⏳ HTF → LTF Delay Window
Input: “Max 1m bars after HTF trigger” (default: 10)
After a 1H HH/HL/LL/LH event, the indicator waits up to N LTF candles for the matching 1m structure pattern.
If no match occurs within the window, no signal is generated.
📉 RSI No-Trade Zone (HTF)
Toggle: Use RSI no-trade zone
Inputs:
RSI Length (HTF)
No-trade lower bound (default 45)
No-trade upper bound (default 65)
If HTF RSI is inside the defined band (e.g. 45–65), signals are blocked (no-trade regime), helping to avoid noisy mid-range conditions.
You can turn this filter ON/OFF and adjust the band dynamically.
🧱 5m OB / Direction Filter (Optional)
Toggle: Use 5m OB direction filter
Timeframe: Configurable (default: 5m).
Uses a simple directional proxy on the OB timeframe:
For BUY signals → require a bullish candle on OB timeframe.
For SELL signals → require a bearish candle on OB timeframe.
When enabled, this adds an extra layer of confluence by aligning entries with the short-term directional context.
⚙️ Key Inputs (Summary)
Timeframes
HTF (Peak Reaction & Structure): default 60 (1H)
Peak Reaction
Lookback bars (HTF)
ATR multiplier for zones
Show/Hide Peak Mid line
Structure
Pivot left/right bars (for HH/HL/LH/LL swings)
Toggle structure labels (HTF & LTF)
Confirmation
Max LTF bars after HTF trigger (default 10, fully configurable)
RSI Filter
Use filter (on/off)
RSI length
No-trade range (low/high)
5m OB Filter
Use filter (on/off)
OB timeframe (default 5m)
📡 Alerts & Automation
The script includes alertconditions for both BUY and SELL signals, with JSON-formatted alert messages suitable for routing to external bridges (e.g. bots, MT5/MT4, n8n, etc.).
Each alert includes:
Symbol
Side (BUY / SELL)
Price / Entry
SL & TP placeholders (from hidden plots, ready to be wired to your own logic)
Time
Performance tag
CommentCode (for strategy/type tagging on the receiver side)
You can attach these alerts to a webhook and let your execution engine handle SL/TP and order management.
📌 How to Use
Attach the indicator to a 1-minute chart.
Set HTF timeframe to 60 (or your preferred higher timeframe).
Optionally enable:
RSI regime filter
5m OB direction filter
Watch for:
Price relative to the Peak Mid line
BUY/SELL triangles that respect HTF structure + LTF confirmation + filters.
For automation, create alerts using the built-in conditions and your preferred JSON alert template.
⚠️ Disclaimer
This tool is for educational and informational purposes only.
It is not financial advice and does not guarantee profits. Always test thoroughly in replay / paper trading before using with live funds, and trade at your own risk.
스크립트에서 "纳斯达克期货cfd"에 대해 찾기

XAUUSD 1m SMC Zones (BOS + Flexible TP Modes + Trailing Runner)//@version=6
strategy("XAUUSD 1m SMC Zones (BOS + Flexible TP Modes + Trailing Runner)",
overlay = true,
initial_capital = 10000,
pyramiding = 10,
process_orders_on_close = true)
//━━━━━━━━━━━━━━━━━━━
// 1. INPUTS
//━━━━━━━━━━━━━━━━━━━
// TP / SL
tp1Pips = input.int(10, "TP1 (pips)", minval = 1)
fixedSLpips = input.int(50, "Fixed SL (pips)", minval = 5)
runnerRR = input.float(3.0, "Runner RR (TP2 = SL * RR)", step = 0.1, minval = 1.0)
// Daily risk
maxDailyLossPct = input.float(5.0, "Max daily loss % (stop trading)", step = 0.5)
maxDailyProfitPct = input.float(20.0, "Max daily profit % (stop trading)", step = 1.0)
// HTF S/R (1H)
htfTF = input.string("60", "HTF timeframe (minutes) for S/R block")
// Profit strategy (Option C)
profitStrategy = input.string("Minimal Risk | Full BE after TP1", "Profit Strategy", options = )
// Runner stop mode (your option 4)
runnerStopMode = input.string( "BE only", "Runner Stop Mode", options = )
// ATR trail settings (only used if ATR mode selected)
atrTrailLen = input.int(14, "ATR Length (trail)", minval = 1)
atrTrailMult = input.float(1.0, "ATR Multiplier (trail)", step = 0.1, minval = 0.1)
// Pip size (for XAUUSD: 1 pip = 0.10 if tick = 0.01)
pipSize = syminfo.mintick * 10.0
tp1Points = tp1Pips * pipSize
slPoints = fixedSLpips * pipSize
baseQty = input.float (1.0, "Base order size" , step = 0.01, minval = 0.01)
//━━━━━━━━━━━━━━━━━━━
// 2. DAILY RISK MANAGEMENT
//━━━━━━━━━━━━━━━━━━━
isNewDay = ta.change(time("D")) != 0
var float dayStartEquity = na
var bool dailyStopped = false
equityNow = strategy.initial_capital + strategy.netprofit
if isNewDay or na(dayStartEquity)
dayStartEquity := equityNow
dailyStopped := false
dailyPnL = equityNow - dayStartEquity
dailyPnLPct = dayStartEquity != 0 ? (dailyPnL / dayStartEquity) * 100.0 : 0.0
if not dailyStopped
if dailyPnLPct <= -maxDailyLossPct
dailyStopped := true
if dailyPnLPct >= maxDailyProfitPct
dailyStopped := true
canTradeToday = not dailyStopped
//━━━━━━━━━━━━━━━━━━━
// 3. 1H S/R ZONES (for direction block)
//━━━━━━━━━━━━━━━━━━━
htOpen = request.security(syminfo.tickerid, htfTF, open)
htHigh = request.security(syminfo.tickerid, htfTF, high)
htLow = request.security(syminfo.tickerid, htfTF, low)
htClose = request.security(syminfo.tickerid, htfTF, close)
// Engulf logic on HTF
htBullPrev = htClose > htOpen
htBearPrev = htClose < htOpen
htBearEngulf = htClose < htOpen and htBullPrev and htOpen >= htClose and htClose <= htOpen
htBullEngulf = htClose > htOpen and htBearPrev and htOpen <= htClose and htClose >= htOpen
// Liquidity sweep on HTF previous candle
htSweepHigh = htHigh > ta.highest(htHigh, 5)
htSweepLow = htLow < ta.lowest(htLow, 5)
// Store last HTF zones
var float htResHigh = na
var float htResLow = na
var float htSupHigh = na
var float htSupLow = na
if htBearEngulf and htSweepHigh
htResHigh := htHigh
htResLow := htLow
if htBullEngulf and htSweepLow
htSupHigh := htHigh
htSupLow := htLow
// Are we inside HTF zones?
inHtfRes = not na(htResHigh) and close <= htResHigh and close >= htResLow
inHtfSup = not na(htSupLow) and close >= htSupLow and close <= htSupHigh
// Block direction against HTF zones
longBlockedByZone = inHtfRes // no buys in HTF resistance
shortBlockedByZone = inHtfSup // no sells in HTF support
//━━━━━━━━━━━━━━━━━━━
// 4. 1m LOCAL ZONES (LIQUIDITY SWEEP + ENGULF + QUALITY SCORE)
//━━━━━━━━━━━━━━━━━━━
// 1m engulf patterns
bullPrev1 = close > open
bearPrev1 = close < open
bearEngulfNow = close < open and bullPrev1 and open >= close and close <= open
bullEngulfNow = close > open and bearPrev1 and open <= close and close >= open
// Liquidity sweep by previous candle on 1m
sweepHighPrev = high > ta.highest(high, 5)
sweepLowPrev = low < ta.lowest(low, 5)
// Local zone storage (one active support + one active resistance)
// Quality score: 1 = engulf only, 2 = engulf + sweep (we only trade ≥2)
var float supLow = na
var float supHigh = na
var int supQ = 0
var bool supUsed = false
var float resLow = na
var float resHigh = na
var int resQ = 0
var bool resUsed = false
// New resistance zone: previous bullish candle -> bear engulf
if bearEngulfNow
resLow := low
resHigh := high
resQ := sweepHighPrev ? 2 : 1
resUsed := false
// New support zone: previous bearish candle -> bull engulf
if bullEngulfNow
supLow := low
supHigh := high
supQ := sweepLowPrev ? 2 : 1
supUsed := false
// Raw "inside zone" detection
inSupRaw = not na(supLow) and close >= supLow and close <= supHigh
inResRaw = not na(resHigh) and close <= resHigh and close >= resLow
// QUALITY FILTER: only trade zones with quality ≥ 2 (engulf + sweep)
highQualitySup = supQ >= 2
highQualityRes = resQ >= 2
inSupZone = inSupRaw and highQualitySup and not supUsed
inResZone = inResRaw and highQualityRes and not resUsed
// Plot zones
plot(supLow, "Sup Low", color = color.new(color.lime, 60), style = plot.style_linebr)
plot(supHigh, "Sup High", color = color.new(color.lime, 60), style = plot.style_linebr)
plot(resLow, "Res Low", color = color.new(color.red, 60), style = plot.style_linebr)
plot(resHigh, "Res High", color = color.new(color.red, 60), style = plot.style_linebr)
//━━━━━━━━━━━━━━━━━━━
// 5. MODERATE BOS (3-BAR FRACTAL STRUCTURE)
//━━━━━━━━━━━━━━━━━━━
// 3-bar swing highs/lows
swHigh = high > high and high > high
swLow = low < low and low < low
var float lastSwingHigh = na
var float lastSwingLow = na
if swHigh
lastSwingHigh := high
if swLow
lastSwingLow := low
// BOS conditions
bosUp = not na(lastSwingHigh) and close > lastSwingHigh
bosDown = not na(lastSwingLow) and close < lastSwingLow
// Zone “arming” and BOS validation
var bool supArmed = false
var bool resArmed = false
var bool supBosOK = false
var bool resBosOK = false
// Arm zones when first touched
if inSupZone
supArmed := true
if inResZone
resArmed := true
// BOS after arming → zone becomes valid for entries
if supArmed and bosUp
supBosOK := true
if resArmed and bosDown
resBosOK := true
// Reset BOS flags when new zones are created
if bullEngulfNow
supArmed := false
supBosOK := false
if bearEngulfNow
resArmed := false
resBosOK := false
//━━━━━━━━━━━━━━━━━━━
// 6. ENTRY CONDITIONS (ZONE + BOS + RISK STATE)
//━━━━━━━━━━━━━━━━━━━
flatOrShort = strategy.position_size <= 0
flatOrLong = strategy.position_size >= 0
longSignal = canTradeToday and not longBlockedByZone and inSupZone and supBosOK and flatOrShort
shortSignal = canTradeToday and not shortBlockedByZone and inResZone and resBosOK and flatOrLong
//━━━━━━━━━━━━━━━━━━━
// 7. ORDER LOGIC – TWO PROFIT STRATEGIES
//━━━━━━━━━━━━━━━━━━━
// Common metrics
atrTrail = ta.atr(atrTrailLen)
// MINIMAL MODE: single trade, BE after TP1, optional trailing
// HYBRID MODE: two trades (Scalp @ TP1, Runner @ TP2)
// Persistent tracking
var float longEntry = na
var float longTP1 = na
var float longTP2 = na
var float longSL = na
var bool longBE = false
var float longRunEntry = na
var float longRunTP1 = na
var float longRunTP2 = na
var float longRunSL = na
var bool longRunBE = false
var float shortEntry = na
var float shortTP1 = na
var float shortTP2 = na
var float shortSL = na
var bool shortBE = false
var float shortRunEntry = na
var float shortRunTP1 = na
var float shortRunTP2 = na
var float shortRunSL = na
var bool shortRunBE = false
isMinimal = profitStrategy == "Minimal Risk | Full BE after TP1"
isHybrid = profitStrategy == "Hybrid | Scalp TP + Runner TP"
//━━━━━━━━━━ LONG ENTRIES ━━━━━━━━━━
if longSignal
if isMinimal
longEntry := close
longSL := longEntry - slPoints
longTP1 := longEntry + tp1Points
longTP2 := longEntry + slPoints * runnerRR
longBE := false
strategy.entry("Long", strategy.long)
supUsed := true
supArmed := false
supBosOK := false
else if isHybrid
longRunEntry := close
longRunSL := longRunEntry - slPoints
longRunTP1 := longRunEntry + tp1Points
longRunTP2 := longRunEntry + slPoints * runnerRR
longRunBE := false
// Two separate entries, each 50% of baseQty (for backtest)
strategy.entry("LongScalp", strategy.long, qty = baseQty * 0.5)
strategy.entry("LongRun", strategy.long, qty = baseQty * 0.5)
supUsed := true
supArmed := false
supBosOK := false
//━━━━━━━━━━ SHORT ENTRIES ━━━━━━━━━━
if shortSignal
if isMinimal
shortEntry := close
shortSL := shortEntry + slPoints
shortTP1 := shortEntry - tp1Points
shortTP2 := shortEntry - slPoints * runnerRR
shortBE := false
strategy.entry("Short", strategy.short)
resUsed := true
resArmed := false
resBosOK := false
else if isHybrid
shortRunEntry := close
shortRunSL := shortRunEntry + slPoints
shortRunTP1 := shortRunEntry - tp1Points
shortRunTP2 := shortRunEntry - slPoints * runnerRR
shortRunBE := false
strategy.entry("ShortScalp", strategy.short, qty = baseQty * 50)
strategy.entry("ShortRun", strategy.short, qty = baseQty * 50)
resUsed := true
resArmed := false
resBosOK := false
//━━━━━━━━━━━━━━━━━━━
// 8. EXIT LOGIC – MINIMAL MODE
//━━━━━━━━━━━━━━━━━━━
// LONG – Minimal Risk: 1 trade, BE after TP1, runner to TP2
if isMinimal and strategy.position_size > 0 and not na(longEntry)
// Move to BE once TP1 is touched
if not longBE and high >= longTP1
longBE := true
// Base SL: BE or initial SL
float dynLongSL = longBE ? longEntry : longSL
// Optional trailing after BE
if longBE
if runnerStopMode == "Structure trail" and not na(lastSwingLow) and lastSwingLow > longEntry
dynLongSL := math.max(dynLongSL, lastSwingLow)
if runnerStopMode == "ATR trail"
trailSL = close - atrTrailMult * atrTrail
dynLongSL := math.max(dynLongSL, trailSL)
strategy.exit("Long Exit", "Long", stop = dynLongSL, limit = longTP2)
// SHORT – Minimal Risk: 1 trade, BE after TP1, runner to TP2
if isMinimal and strategy.position_size < 0 and not na(shortEntry)
if not shortBE and low <= shortTP1
shortBE := true
float dynShortSL = shortBE ? shortEntry : shortSL
if shortBE
if runnerStopMode == "Structure trail" and not na(lastSwingHigh) and lastSwingHigh < shortEntry
dynShortSL := math.min(dynShortSL, lastSwingHigh)
if runnerStopMode == "ATR trail"
trailSLs = close + atrTrailMult * atrTrail
dynShortSL := math.min(dynShortSL, trailSLs)
strategy.exit("Short Exit", "Short", stop = dynShortSL, limit = shortTP2)
//━━━━━━━━━━━━━━━━━━━
// 9. EXIT LOGIC – HYBRID MODE
//━━━━━━━━━━━━━━━━━━━
// LONG – Hybrid: Scalp + Runner
if isHybrid
// Scalp leg: full TP at TP1
if strategy.opentrades > 0
strategy.exit("LScalp TP", "LongScalp", stop = longRunSL, limit = longRunTP1)
// Runner leg
if strategy.position_size > 0 and not na(longRunEntry)
if not longRunBE and high >= longRunTP1
longRunBE := true
float dynLongRunSL = longRunBE ? longRunEntry : longRunSL
if longRunBE
if runnerStopMode == "Structure trail" and not na(lastSwingLow) and lastSwingLow > longRunEntry
dynLongRunSL := math.max(dynLongRunSL, lastSwingLow)
if runnerStopMode == "ATR trail"
trailRunSL = close - atrTrailMult * atrTrail
dynLongRunSL := math.max(dynLongRunSL, trailRunSL)
strategy.exit("LRun TP", "LongRun", stop = dynLongRunSL, limit = longRunTP2)
// SHORT – Hybrid: Scalp + Runner
if isHybrid
if strategy.opentrades > 0
strategy.exit("SScalp TP", "ShortScalp", stop = shortRunSL, limit = shortRunTP1)
if strategy.position_size < 0 and not na(shortRunEntry)
if not shortRunBE and low <= shortRunTP1
shortRunBE := true
float dynShortRunSL = shortRunBE ? shortRunEntry : shortRunSL
if shortRunBE
if runnerStopMode == "Structure trail" and not na(lastSwingHigh) and lastSwingHigh < shortRunEntry
dynShortRunSL := math.min(dynShortRunSL, lastSwingHigh)
if runnerStopMode == "ATR trail"
trailRunSLs = close + atrTrailMult * atrTrail
dynShortRunSL := math.min(dynShortRunSL, trailRunSLs)
strategy.exit("SRun TP", "ShortRun", stop = dynShortRunSL, limit = shortRunTP2)
//━━━━━━━━━━━━━━━━━━━
// 10. RESET STATE WHEN FLAT
//━━━━━━━━━━━━━━━━━━━
if strategy.position_size == 0
longEntry := na
shortEntry := na
longBE := false
shortBE := false
longRunEntry := na
shortRunEntry := na
longRunBE := false
shortRunBE := false
//━━━━━━━━━━━━━━━━━━━
// 11. VISUAL ENTRY MARKERS
//━━━━━━━━━━━━━━━━━━━
plotshape(longSignal, title = "Long Signal", style = shape.triangleup,
location = location.belowbar, color = color.lime, size = size.tiny, text = "L")
plotshape(shortSignal, title = "Short Signal", style = shape.triangledown,
location = location.abovebar, color = color.red, size = size.tiny, text = "S")

Setup Keltner Banda 3 e 5 - MMS + RSI + Distância Tabela
📊 Indicator Overview: Keltner Bands + RSI + Distance Table
This custom TradingView indicator combines three powerful tools into a single, visually intuitive setup:
Keltner Channels (Bands 3x and 5x ATR)
Relative Strength Index (RSI)
Dynamic Table Displaying RSI and Price Distance from Moving Average (MMS)
🔧 Components and Functions
1. Keltner Channels (3x and 5x ATR)
Based on a Simple Moving Average (MMS) and Average True Range (ATR).
Two sets of bands are plotted:
3x ATR Bands: Used for moderate volatility signals.
5x ATR Bands: Used for high volatility extremes.
Visual fills between bands help identify overextended price zones.
2. RSI (Relative Strength Index)
Measures momentum and potential reversal zones.
Customizable overbought (default 70) and oversold (default 30) levels.
RSI values are color-coded in the table:
Green for RSI ≤ 30 (oversold)
Blue for 30 < RSI ≤ 70 (neutral)
Red for RSI > 70 (overbought)
3. Distance Table (Price vs. MMS)
Displays the real-time distance between the current price and the MMS:
In points (absolute difference)
In percentage (relative to MMS)
Helps traders assess how far price has deviated from its mean.
📈 How to Use
Trend Reversal Signals
Look for price crossing back inside the 3x or 5x Keltner Bands.
Confirm with RSI:
RSI > 70 + price re-entering from above = potential short
RSI < 30 + price re-entering from below = potential long
Volatility Zones
Price outside the 5x band indicates extreme movement.
Use this to anticipate mean reversion or breakout continuation.
Table Insights
Monitor RSI and price distance in real time.
Use color cues to quickly assess momentum and stretch.
⚙️ Customization
Adjustable parameters for:
MMS period
ATR multipliers
RSI period and thresholds
Table position on chart
Fill colors between bands
This indicator is ideal for traders who want a clean, data-rich visual tool to track volatility, momentum, and price deviation in one place.

**MACD + RSI + MFI by IspatialResources – Multi-Tool Indicator**
This indicator is a **multi-functional technical analysis tool** that combines the following professional oscillators into a single panel:
* ✅ **Customizable MACD**
* ✅ **Advanced RSI with Moving Average and Bollinger Bands**
* ✅ **Money Flow Index (MFI)**
* ✅ **Module-based enable/disable system**
* ✅ **Fully configurable alerts**
It is designed to help identify **overbought and oversold conditions, trend strength, and momentum shifts**, improving market reading across multiple assets.
---
### 🔹 INCLUDED MODULES
**1️⃣ MACD**
* Fast and slow moving average settings
* Selectable MA type (SMA / EMA)
* Dynamic histogram
* Momentum change alerts
**2️⃣ Advanced RSI**
* Classic RSI with dynamic levels
* Moving average applied to RSI
* Optional **Bollinger Bands on RSI**
* Visual overbought and oversold signals
* Extreme condition alerts
**3️⃣ MFI (Money Flow Index)**
* Buying and selling pressure detection
* Overbought and oversold zones
* Ideal for volume and strength analysis
---
### 🔹 SUPPORTED MARKETS
This indicator can be used on:
* 📈 Cryptocurrencies
* 📊 Stock Indices
* 💱 Forex
* 📉 Stocks
It works on **all timeframes**: intraday, swing trading, and long-term analysis.
---
### 🔹 HOW TO USE IT
* Enable or disable each module from the settings panel.
* Use the **RSI with bands** to detect extreme zones.
* Confirm potential entries with the **MACD**.
* Filter false signals with the **MFI**.
* Combine it with market structure, support, and resistance.
---
### ⚠️ RISK DISCLAIMER
This indicator is **for educational and technical analysis purposes only**.
**It does not constitute financial advice and does not guarantee results.**
Trading involves risk, and each user is responsible for their own decisions.
---
### 👤 AUTHOR
Created by **Ismael** as a personal tool for market analysis and study.
---
🚀 If you find this indicator useful, feel free to support it with a “like” for future updates.

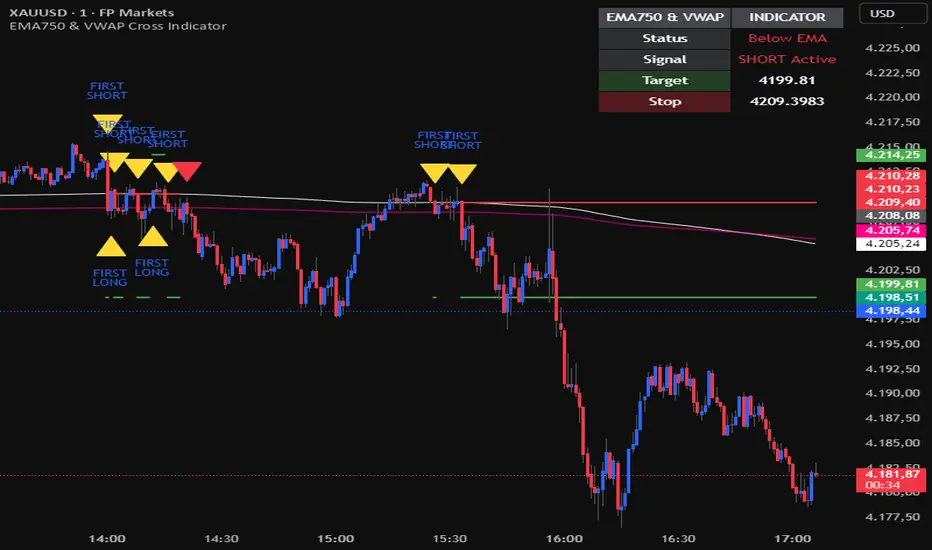
EMA750 & VWAP Cross IndicatorA trend-following indicator that identifies high-probability entry signals based on EMA750 and VWAP crossovers.
How it works:
Monitors price position relative to EMA750 (trend filter)
Generates LONG signals when price crosses above VWAP while above EMA750
Generates SHORT signals when price crosses below VWAP while below EMA750
Highlights the FIRST signal after each EMA cross (yellow markers)
Automatically calculates targets based on recent swing highs/lows
Stop loss set at EMA750 level
Features:
✓ Visual target and stop loss levels
✓ Customizable alerts for first and all signals
✓ Real-time status dashboard
✓ Swing point detection for target calculation
✓ Signal tracking until opposite VWAP cross
Best for: Swing trading and trend-following strategies on higher timeframes.
Trade Setup A+ [v.8 Fixed Lines]🚀 Trade Setup A+ : Liquidity Hunter System (XAUUSD)
This indicator is an "All-in-One" trading system designed specifically for XAUUSD (Gold) Scalping and Swing trading. It combines Smart Money Concepts (SMC) with Price Action to identify high-probability setups by tracking liquidity pools and institutional order blocks.
💎 Key Features (v.8 Updated):
Auto Order Blocks (Clean View):
Automatically detects and draws Bullish (Green) and Bearish (Red) Order Blocks based on swing points.
Clean Look: Limits display to the last 5 active zones to keep the chart clutter-free.
Liquidity Levels (Fixed Lines):
D-High / D-Low: Thin lines representing Previous Day’s High & Low.
W-High / W-Low: Thick lines representing Previous Week’s High & Low (Strong Support/Resistance).
Dual Entry Signals:
Method 1 (Sniper): Shows a Diamond Icon (💎) when price touches an Order Block zone (Reversal setup).
Method 2 (Follow): Shows a Triangle Arrow (🔼/🔽) when price crosses EMA 14 with trend confirmation from EMA 49.
Macro Time Zones:
Highlights high-volume trading sessions (Asia, London, NY) on the background to identify "Killzones".
📈 How to Trade:
BUY Signal: Look for a Green Diamond (Touch OB) or Green Triangle (Price > EMA 14 & 49).
SELL Signal: Look for a Red Diamond (Touch OB) or Orange Triangle (Price < EMA 14).
Best Time: Trade when signals align with highlighted Macro Time zones.
⚠️ Disclaimer: This tool is for educational purposes only. Always use proper risk management.
🚀 Trade Setup A+ : ระบบเทรดล่าสภาพคล่อง (สำหรับทองคำ)
อินดิเคเตอร์ชุดนี้ออกแบบมาเพื่อเทรด XAUUSD (ทองคำ) โดยเฉพาะ ผสมผสานเทคนิค SMC (Smart Money Concepts) และ Price Action เพื่อหาจุดเข้าที่มีความแม่นยำสูง (High Probability) โดยเน้นการดักจับสภาพคล่องของรายใหญ่ค่ะ
💎 ฟีเจอร์หลัก (อัปเดตล่าสุด v.8):
Auto Order Blocks (แบบคลีน):
สร้างกล่องโซนซื้อขาย (Supply/Demand) ให้อัตโนมัติ (สีเขียว = โซน Buy, สีแดง = โซน Sell)
Clean Look: ระบบจะโชว์เฉพาะ 5 กล่องล่าสุดเท่านั้น เพื่อไม่ให้กราฟรกสายตา
Liquidity Levels (เส้นแนวรับต้าน):
D-High / D-Low: เส้นบาง แสดงราคาสูงสุด/ต่ำสุดของ "เมื่อวาน" (Day)
W-High / W-Low: เส้นหนา แสดงราคาสูงสุด/ต่ำสุดของ "สัปดาห์ที่แล้ว" (Week) ซึ่งเป็นแนวรับต้านที่แข็งแกร่ง
สัญญาณเข้าเทรด 2 แบบ (Dual Signals):
วิธีที่ 1 (Sniper): แสดงรูป เพชร (💎) เมื่อราคาวิ่งชนขอบกล่อง Order Block (ดักจุดกลับตัวปลายไส้)
วิธีที่ 2 (Follow Trend): แสดงรูป ลูกศรสามเหลี่ยม (🔼/🔽) เมื่อราคาตัดเส้น EMA ตามเงื่อนไข (Buy ต้องยืนเหนือ EMA 14 และ 49)
Macro Time (ช่วงเวลาทำเงิน):
ระบายสีพื้นหลังบอกช่วงเวลาที่ตลาดวิ่งแรง (Asia, London, NY) เพื่อให้โฟกัสถูกจุด
📈 วิธีใช้งาน:
ขา BUY: รอสัญญาณ เพชรสีเขียว (ชนกล่องรับ) หรือ ลูกศรเขียว (ตามเทรนด์)
ขา SELL: รอสัญญาณ เพชรสีแดง (ชนกล่องต้าน) หรือ ลูกศรส้ม (ตามเทรนด์)
คำแนะนำ: ประสิทธิภาพสูงสุดเมื่อสัญญาณเกิดในช่วงเวลา Macro Time (แถบสีพื้นหลัง)

Regime Filter [BigBeluga] Modified by Claude to move tableThis is a copy of Regime Filter that has been modified by Anthropic's Claude to move the overlay table to different positions.

Setup Keltner BandS MMS + RSI SIGNALS
📊 Keltner Bands with RSI Confirmation – TradingView Script
Introduction
This script combines Keltner Channel logic with Relative Strength Index (RSI) confirmation to provide traders with visual signals and alerts for potential reversals. It is designed for scalping and short-term trading strategies, where precision and quick decision-making are essential.
🔧 How It Works
• Keltner Bands (ATR-based):
• Two sets of bands are plotted around a moving average:
• Band 3 (ATR × 3) – more sensitive, suitable for aggressive entries.
• Band 5 (ATR × 5) – wider, used as a filter or confirmation zone.
• Signals are generated when the price crosses back inside the bands from outside.
• RSI Confirmation:
• RSI is calculated with a customizable period (default: 14).
• Overbought and oversold levels (default: 70/30) are used to filter signals.
• A bearish reversal is confirmed only if RSI is above the overbought level.
• A bullish reversal is confirmed only if RSI is below the oversold level.
📌 Functions and Features
• Visual Signals:
• Triangles plotted above/below candles for Keltner-only signals.
• Additional colored triangles for Keltner + RSI confirmed signals.
• Alerts:
• Configurable alerts for both Keltner-only and RSI-confirmed conditions.
• Messages include the type of reversal and the band level.
• Customizable Parameters:
• Moving average length.
• ATR multipliers (3 and 5).
• RSI length and thresholds.
• Colors for band fills and signals.
🎯 Usage
1. Apply the script to your chart in TradingView.
2. Adjust parameters to fit your trading style (scalping, intraday, swing).
3. Watch for signals:
• Red/green/orange/teal triangles → Keltner-only reversals.
• Maroon/lime/purple/blue triangles → RSI-confirmed reversals.
4. Set alerts to receive notifications when conditions are met.
5. Use RSI confirmation to filter out false signals and increase accuracy.
✅ Benefits
• Clear visualization of reversal zones.
• Dual-layer confirmation (Keltner + RSI).
• Flexible for different timeframes and trading styles.
• Ready-to-use alerts for automation or manual trading.

Borna's ZonesBorna's Zones marks two important time-based zones on the chart: the 08:00 zone and the 09:00 zone.
The 08:00 zone identifies initial liquidity. This zone sets the range where early market participants create significant activity.
The 09:00 zone serves as a reference for confirmation. After 09:00, the indicator helps you identify whether the 08:00 zone should be considered cleared.
Both zones are automatically extended until 11:00, providing clear visual references for potential market reactions.
No trading is recommended after 11:00, as the early morning zones lose relevance.
This indicator is useful for traders who focus on pre-market and early session liquidity, helping to visualize key levels where price may react.

Alert candle Bull/BearThis simple indicator allows you to be notified if the candle closes long or short, according to your timeframe.

GOLD 5m Buy/Sell Pro//@version=5
indicator("GOLD 5m Buy/Sell Pro", overlay = true, timeframe = "5", timeframe_gaps = true)

ZigZag + Fibonacci
⚙️ Main Features
• Automatic ZigZag: Detects the latest high and low pivots based on an adjustable period.
• Dynamic Fibonacci: Automatically draws the 38.2%, 50%, and 61.8% levels based on the last ZigZag movement.
• Display Control:
o Enable or disable the blue line connecting the pivots (ZigZag line).
o Adjust the horizontal length of the Fibonacci lines (in number of bars).
• Customizable Colors:
o Choose different colors for each Fibonacci level.
o Customize the color of the ZigZag line.
________________________________________
🧑🏫 How to Use
1. Add the indicator to your chart on TradingView.
2. Configure the parameters according to your strategy:
o ZigZag Period: defines the sensitivity of the pivots (higher values = wider movements).
o Fibonacci Line Length: how many bars the horizontal lines should extend.
o Show ZigZag Line: check or uncheck to display the blue line between pivots.
o Colors: customize the visual appearance of the Fibonacci levels and ZigZag line.
3. Interpret the Fibonacci levels:
o Use the levels as possible support and resistance zones.
o Combine with other technical signals for more assertive entries and exits.

Manual Zones SafeUse cases:
Support and resistance levels
Supply and demand zones
Price action areas for manual trading strategies

ADX with Customisable LevelsADX with Customisable Levels.
25 for strong trend
50 for Very strong trend
75 for unsustainable strong trend.

Trading Session IL7 Session-Based Intraday Momentum IndicatorOverview
This indicator is designed to support discretionary traders by highlighting intraday momentum phases based on price behavior and trading session context.
It is intended as a confirmation tool and not as a standalone trading system or automated strategy.
Core Concept
The script combines multiple market observations, including:
- Directional price behavior within the current timeframe
- Structural consistency in recent price movement
- Session-based filtering to focus on periods with higher activity and liquidity
Signals are only displayed when internal conditions align, helping traders avoid low-quality setups during sideways or low-momentum market phases.
How to Use
This indicator should be used to confirm existing trade ideas rather than generate trades on its own.
It can help traders:
- Identify periods where momentum is more likely to continue
- Filter out trades during unfavorable market conditions
- Align intraday execution with higher-timeframe bias
Best results are achieved when used alongside key price levels, higher-timeframe structure and proper risk management.
Limitations
This indicator does not predict future price movements.
Signals may change during active candles.
Market conditions may reduce effectiveness during extremely low volatility periods.
Language Notice
The indicator’s user interface labels are displayed in German.
This English description is provided first to comply with TradingView community script publishing rules.

FVG Maxing - Fair Value Gaps, Equilibrium, and Candle Patterns
What this script does
This open-source indicator highlights 3-candle fair value gaps (FVGs) on the active chart timeframe, draws their midpoint ("equilibrium") line, tracks when each gap is mitigated, and optionally marks simple candle patterns (engulfing and doji) for confluence. It is intended as an educational tool to study how price interacts with imbalances.
3-candle bullish and bearish FVG zones drawn as forward-extending boxes.
Equilibrium line at 50% of each gap.
Different styling for mitigated vs unmitigated gaps.
Compact statistics panel showing how many gaps are currently active and filled.
Optional overlays for bullish/bearish engulfing patterns and doji candles.
1. FVG logic (3-candle gaps)
The script focuses on a strict 3-candle definition of a fair value gap:
Three consecutive candles with the same body direction.
The wick of candle 3 is separated from the wick of candle 1 (no overlap).
A bullish gap is created when price moves up fast enough to leave a gap between candle 1 and 3. A bearish gap is the mirror case to the downside.
In Pine, the core detection looks like this:
// Three candles with the same body direction
bull_seq = close > open and close > open and close > open
bear_seq = close < open and close < open and close < open
// Wick gap between candle 1 and candle 3
bull_gap = bull_seq and low > high
bear_gap = bear_seq and high < low
// Final FVG flags
is_bull_fvg = bull_gap
is_bear_fvg = bear_gap
For each detected FVG:
Bullish FVG range: from high up to low (gap below current price).
Bearish FVG range: from low down to high (gap above current price).
Each zone is stored in a custom FVGData structure so it can be updated when price later trades back inside it.
2. Equilibrium line (0.5 of the gap)
Every FVG box gets an optional equilibrium line plotted at the midpoint between its top and bottom:
eq_level = (top + bottom) / 2.0
right_index = extend_boxes ? bar_index + extend_length_bars : bar_index
bx = box.new(bar_index - 2, top, right_index, bottom)
eq_ln = line.new(bar_index - 2, eq_level, right_index, eq_level)
line.set_style(eq_ln, line.style_dashed)
line.set_color(eq_ln, eq_color)
You can use this line as a neutral “fair value” reference inside the zone, or as a simple way to think in terms of premium/discount within each gap.
3. Mitigation rules and styling
Each FVG stays active until price trades back into the gap:
Bullish FVG is considered mitigated when the low touches or moves below the top of the gap.
Bearish FVG is considered mitigated when the high touches or moves above the bottom of the gap.
When that happens, the script:
Marks the internal FVGData entry as mitigated.
Softens the box fill and border colors.
Optionally updates the label text from "BULL EQ / BEAR EQ" to "BULL FILLED / BEAR FILLED".
Can hide mitigated zones almost completely if you only want to see unfilled imbalances.
This allows you to distinguish between current areas of interest and zones that have already been traded through.
4. Candle pattern overlays (engulfing and doji)
For additional confluence, the script can mark simple candle patterns on top of the FVG view:
Bullish engulfing — current candle body fully wraps the previous bearish body and is larger in size.
Bearish engulfing — current candle body fully wraps the previous bullish body and is larger in size.
Doji — candles where the real body is small relative to the full range (high–low).
The detection is based on basic body and range geometry:
curr_body = math.abs(close - open)
prev_body = math.abs(close - open )
curr_range = high - low
body_ratio = curr_range > 0 ? curr_body / curr_range : 1.0
bull_engulfing = close > open and close < open and open <= close and close >= open and curr_body > prev_body
bear_engulfing = close < open and close > open and open >= close and close <= open and curr_body > prev_body
is_doji = curr_range > 0 and body_ratio <= doji_body_ratio
On the chart, they appear as:
Small triangle markers below bullish engulfing candles.
Small triangle markers above bearish engulfing candles.
Small circles above doji candles.
All three overlays are optional and can be turned on or off and recolored in the CANDLE PATTERNS group of inputs.
5. Inputs overview
The script organizes settings into clear groups:
DISPLAY SETTINGS : Show bullish/bearish FVGs, show/hide mitigated zones, box extension length, box border width, and maximum number of boxes.
EQUILIBRIUM : Toggle equilibrium lines, color, and line width.
LABELS : Enable labels, choose whether to label unmitigated and/or mitigated zones, and select label size.
BULLISH COLORS / BEARISH COLORS : Separate fill and border colors for bullish and bearish gaps.
MITIGATED STYLE : Opacity used when a gap is marked as mitigated.
STATISTICS : Toggle the on-chart FVG statistics panel.
CANDLE PATTERNS : Show engulfing patterns, show dojis, colors, and the body-to-range threshold that defines a doji.
6. Statistics panel
An optional table in the corner of the chart summarizes the current state of all tracked gaps:
Total number of FVGs still being tracked.
Number of bullish vs bearish FVGs.
Number of unfilled vs mitigated FVGs.
Simple fill rate: percentage of tracked FVGs that have been marked as mitigated.
This can help you study how a particular market tends to treat gaps over time.
7. How you might use it (examples)
These are usage ideas only, not recommendations:
Study how often your symbol mitigates gaps and where inside the zone price tends to react.
Use higher-timeframe context and then refine entries near the equilibrium line on your trading timeframe.
Combine FVG zones with basic candle patterns (engulfing/doji) as an extra visual anchor, if that fits your process.
Hope you enjoy, give your feedback in the comments!
- officialjackofalltrades

SMC + OB + FVG + Reversal + UT Bot + Hull Suite – by Fatich.id🎯 7 INTEGRATED SYSTEMS:
✓ Mxwll Suite (SMC + Auto Fibs + CHoCH/BOS)
✓ UT Bot (Trend Signals + Label Management)
✓ Hull Suite (Momentum Analysis)
✓ LuxAlgo FVG (Fair Value Gaps)
✓ LuxAlgo Order Blocks (Volume Pivots) ⭐ NEW
✓ Three Bar Reversal (Pattern Recognition)
✓ Reversal Signals (Momentum Count Style)
⚡ KEY FEATURES:
• Smart Money Structure (CHoCH/BOS/I-CHoCH/I-BoS)
• Auto Fibonacci (10 customizable levels)
• Order Block Detection (Auto mitigation)
• Fair Value Gap Tracking
• Session Highlights (NY/London/Asia)
• Volume Activity Dashboard
• Multi-Timeframe Support
• Clean Label Management
🎨 PERFECT FOR:
• Smart Money Concept Traders
• Order Flow & Liquidity Analysis
• Support/Resistance Trading
• Trend Following & Reversals
• Multi-Timeframe Analysis
💡 RECOMMENDED SETTINGS:
Clean Charts: OB Count 3, UT Signals 3, FVG 5
Detailed Analysis: OB Count 5-10, All Signals
Scalping: Low sensitivity, Hull 20-30
Swing Trading: High sensitivity, Hull 55-100

VIX/VXV Ratio (TitsNany)This script plots the VXV/VIX ratio, which compares medium-term volatility (90-day fear) to short-term volatility (30-day fear). When the ratio rises above key levels like 1.16 or 1.24, it signals that traders expect future stress, often preceding market pullbacks. When the ratio falls toward or below 1.0, short-term fear is spiking, which typically occurs during active selloffs or volatility events. In short, elevated readings warn of potential market drops ahead, while sharp declines in the ratio reflect panic already hitting the market.

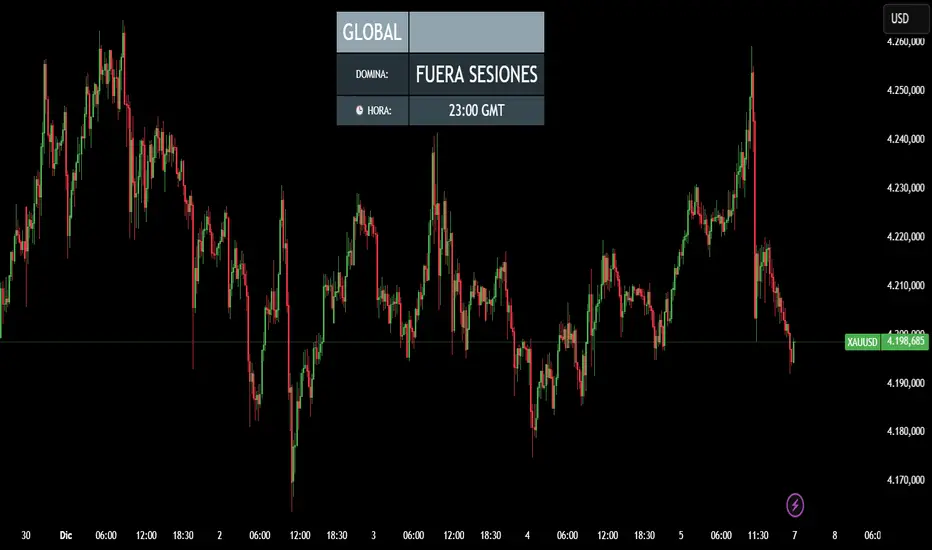
CRR - Reloj Sesiones & DominioIt uses simple rules:
00:00 – 07:00 → Tokyo / ASIA
07:00 – 12:00 → London / EUROPE
12:00 – 21:00 → New York / AMERICA
21:00 – 24:00 → Outside main sessions
Each session is assigned a color:
Tokyo → Blue
London → Yellow
New York → Green
Outside → Gray
2. Displays the current time in GMT format
Example: 14:32 GMT
3. Minimalist on-screen display (HUD)
The top center of the screen shows:
Continent (ASIA / EUROPE / AMERICA)
Which session is currently dominant (TOKYO / LONDON / NEW YORK)
The GMT time
All in a sleek table with dynamic colors based on the session.
🧠 In short:
A smart clock that tells you which session is dominant, which continent you're in, and what time it is in GMT, with a nice on-screen HUD.
CRR - Smart Money Concept (Pro Expo)Detects Market Structure
Finds pivots using Structure Period.
Marks:
HH (Higher High), LH (Lower High)
HL (Higher Low), LL (Lower Low)
Can draw swing points at highs and lows.
Detects Structure Breaks
When the price breaks the last swing:
BMS (Break of Market Structure) → continuation.
ChoCH (Change of Character) → possible trend reversal.
Differentiates between strong and weak movements using filters.
Confirmation Filters (optional)
If useFilters is enabled, to validate breaks it uses:
ATR → the close must cross the level by at least atrMult * ATR.
Volume → the current volume must be > volMult * average volume.
MACD → in the direction of the break.
Gap → avoids some false breakouts due to gaps.
Internal Fibonacci Retracement of the Last Range
Draws 38.2%, 50%, and 61.8% between the last swing high and swing low.
Serves as internal bounce/discount/premium zones.
Current Range
Draws two dashed yellow lines:
Top: last swing High.
Bottom: last swing Low.
Shows you the range where the price is currently trading.
🧩 In short:
This script draws complete SMC structure (HH/HL/LL/LH + BMS + ChoCH), validates breakouts with ATR, volume, MACD, and gaps, and also displays internal Fibonacci retracement + current range, all automatically and cleanly.

CRR - Candlestick Pattern PRO + HUD Analyze each candlestick in detail:
Calculate:
Body size (bodyPct)
Upper wick (upPct)
Lower wick (lowPct)
Total range of the candlestick.
Detect important candlestick patterns:
Hammer
Inverted Hammer
Doji
Strong Bullish Candle
Strong Bearish Candle
Bullish Engulfing
Bearish Engulfing
Optional: Use the EMA 200 as a trend filter
If useTrend is enabled:
Above the EMA200 → “Trend: Bullish”
Below the EMA200 → “Trend: Bearish”
In between → “Trend: Sideways”
Color and mark the candlesticks:
If useColorCandles is active:
Color the candlestick according to the detected pattern.
If showLabels is active:
Write the name of the pattern above or below the candlestick (Hammer, Doji, Engulfing, etc.).
HUD in the upper right corner:
Name of the current pattern (or “None”).
Bias: bullish reversal, bearish reversal, momentum, indecision, etc.
EMA200 status (trend).
Candlestick body and wick percentages.
Pattern “Strength”: Low / Medium / High.
🧠 In simple terms:
This is a professional candlestick pattern radar, with colors, labels, and a HUD that tells you which pattern is present, what the trend is, and how strong the signal is.

CRR Auto 50% Candle A line at 50% of the candle
If a candle is larger than the minimum size you define (minSizePerc),
then calculate the midpoint of the candle (midLevel) and draw a horizontal line:
From the current candle to 44 bars to the right (or the number you choose).
Green if the candle is bullish, red if it is bearish.
2. Signal arrows
If it's a large bullish candle → green arrow pointing up with the text “50”.
If it's a large bearish candle → red arrow pointing down with the text “50”.
3. What is it for?
It marks the 50% level of important candles, which is often:
A mitigation zone.
A level where the price usually returns before continuing.
An institutional equilibrium point.
🧠 In simple terms:
It detects strong candles, draws their 50% level into the future, and marks them with arrows indicating whether they are bullish or bearish. Ideal for SMC.

CRR - Gaps + FVG PROUses ATR
Calculates ATR and, with minAtrR, defines the minimum size for a GAP or FVG to be considered valid.
Detects and draws GAPs between candles
Bullish GAP: low > high (upward gap).
Bearish GAP: high < low (downward gap).
Draws a box between the previous and current candle.
The box can be extended to the right.
If the price fills the gap (touches it), and autoDelGap is active, the box is deleted (mitigated).
Only saves and manages the last bullish GAP and the last bearish GAP.
Detects and draws FVG (3-candle imbalance)
Bullish FVG: high < low → liquidity gap below.
Bearish FVG: low > high → liquidity gap above.
Draws a box for the gap between candle 2 and the current candle.
The box can be extended to the right.
When the price completely enters the zone (fills it), if autoDelFVG is active, the box is deleted (mitigated).
Only monitors the last bullish FVG and the last bearish FVG.
🧠 In simple terms:
It marks GAPs and FVG imbalance zones on the chart, extends them to the right, and automatically deletes them when the price mitigates/fills those zones.
