Yesterday’s High Breakout - Trend Following StrategyYesterday’s High Breakout it is a trading system based on the analysis of yesterday's highs, it works in trend-following mode therefore it opens a long position at the breakout of yesterday's highs even if they occur several times in one day.
There are several methods for exiting a trade, each with its own unique strategy. The first method involves setting Take-Profit and Stop-Loss percentages, while the second utilizes a trailing-stop with a specified offset value. The third method calls for a conditional exit when the candle closes below a reference EMA.
Additionally, operational filters can be applied based on the volatility of the currency pair, such as calculating the percentage change from the opening or incorporating a gap to the previous day's high levels. These filters help to anticipate or delay entry into the market, mitigating the risk of false breakouts.
In the specific case of NULS, a 9% Take-Profit and a 3% Stop-Loss were set, with an activated trailing-stop percentage. To postpone entry and avoid false breakouts, a 1% gap was added to the price of yesterday's highs.
Name : Yesterday's High Breakout - Trend Follower Strategy
Author : @tumiza999
Category : Trend Follower, Breakout of Yesterday's High.
Operating mode : Spot or Futures (only long).
Trade duration : Intraday.
Timeframe : 30M, 1H, 2H, 4H
Market : Crypto
Suggested usage : Short-term trading, when the market is in trend and it is showing high volatility.
Entry : When there is a breakout of Yesterday's High.
Exit : Profit target or Trailing stop, Stop loss or Crossunder EMA.
Configuration :
- Gap to anticipate or postpone the entry before or after the identified level
- Rate of Change for Entry Condition
- Take Profit, Stop Loss and Trailing Stop
- EMA length
Backtesting :
⁃ Exchange: BINANCE
⁃ Pair: NULSUSDT
⁃ Timeframe: 2H
⁃ Fee: 0.075%
⁃ Slippage: 1
- Initial Capital: 10000 USDT
- Position sizing: 10% of Equity
- Start : 2018-07-26 (Out Of Sample from 2022-12-23)
- Bar magnifier: on
Credits : LucF for Pine Coders (f_security function to avoid repainting using security)
Disclaimer : Risk Management is crucial, so adjust stop loss to your comfort level. A tight stop loss can help minimise potential losses. Use at your own risk.
How you or we can improve? Source code is open so share your ideas!
Leave a comment and smash the boost button!
Thanks for your attention, happy to support the TradingView community.
스크립트에서 "涨幅大于1000的股票"에 대해 찾기

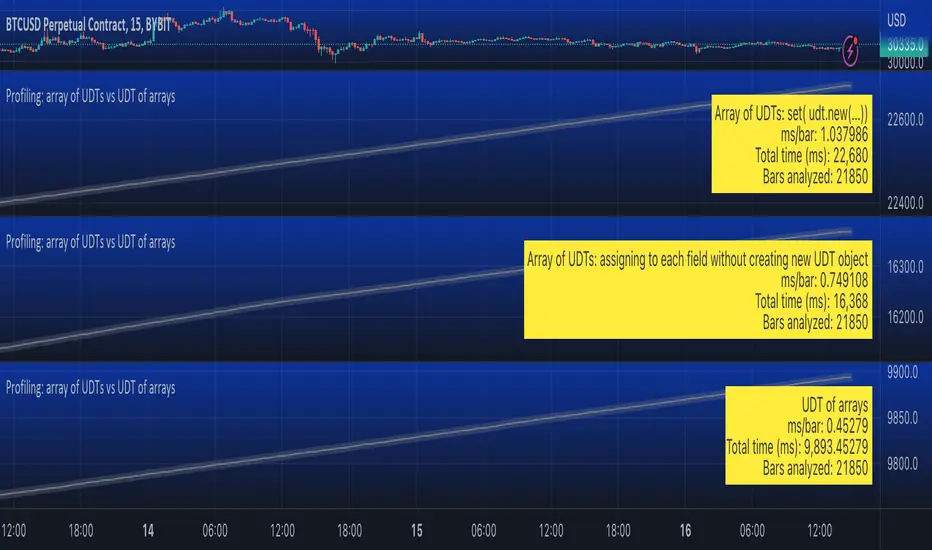
Profiling: array of UDTs vs UDT of arraysUsing Stopwatch Library by PineCoders, I am trying to test which is faster, an array of user-defined type (UDT) objects vs an object with many child arrays.
The task is to store and manipulate array of objects having total 9 values: 4 floats, 4 strings and 1 int.
Option 1: create a UDT with 9 fields and store an array of such UDT objects.
Option 2: create a UDT with 9 arrays individually for each value.
The test task is of three stages:
Populate array(s) with some (timenow) values - in the options you can choose how many values to push into the array/arrays. Note that max size of array(s) is set independently, so you can push 1000 of elements into an array capped at 100 max size and as new elements will be pushed (added to the end) the old exceeding elements will be shifted (removed from the beginning)
Write - write to random elements of the array. Two options for writing to a UDT object: (1) assign to each field independently, (2) create a UDT object and use array.set() function.
Read - read from random elements of the array.
In the options you can how many times per bar to run each of the steps (same number for each step).
I tested by adding three indicators to the chart and choosing different options for each:
1. Array of UDT's where writing is done by creating a new UDT from the values and then using set(udt)
2. Array of UDT's where writing is done by assigning the value of each of the properties of the UDT individually (saving time on creating of a new object).
3. UDT of arrays.
As of 16 Arpil 2023 the UDT of arrays seems about 20-30% faster than the array of UDT's with setting each property without creating new UDT object.
Titans Price IncidenceThe Titans Price Incidence indicator is set to display the historical incidence of highs and lows at each price level.
A longer bar indicates a higher occurrence of highs and lows at that price level.
The interval of each price level is determined by a user-defined "degree", which is a multiple of the counter's minimum tick.
For example, a counter with a minimum tick of 0.00001 and a degree of 200 will result in a price interval of 0.002.
As another example, a counter with a minimum tick of 0.001 and a degree of 10000 will result in a price interval of 10.
For convenience the minimum tick of the counter is included as a plot.
The historical period to study is based on a user-defined "lookback", which is the number of candles to look back over.
Finally it is possible to review the indicator display at a certain candle in the past by entering a "reference".
To display the current price incidence, a reference of 0 should be used.

Mason’s Line IndicatorThe Macon Strategy is an idea conceived by Didier Darcet , co-founder of Gavekal Intelligence Software. Inspired by the Water Level, an instrument used by masons to check the horizontality or verticality of a wall. This method aims to measure the psychology of financial markets and determine if the market is balanced or tilting towards an unfavorable side, focusing on the behavioral risk of markets rather than economic or political factors.
The strategy examines the satisfaction and frustration of investors based on the distance between the low and high points of the market over a period of one year. Investor satisfaction is influenced by the current price of the index and the path taken to reach that price. The distance to the low point provides satisfaction, while the distance to the high point generates frustration. The balance between the two dictates investors’ desire to hold or sell their positions.
To refine the strategy, it is important to consider the opinion of a group of investors rather than just one individual. The members of a hypothetical investor club invest successively throughout the past year. The overall satisfaction of the market on a given day is a democratic expression of all participants.
If the overall satisfaction is below 50%, investors are frustrated and sell their positions. If it is above, they are satisfied and hold their positions. The position of the group of investors relative to the high and low points represents the position of the air bubble in the water level. Market performance is measured day by day based on participant satisfaction or dissatisfaction.
In conclusion, memory, emotions, and decision-making ability are closely linked, and their interaction influences investment decisions. The Macon Strategy highlights the importance of the behavioral dimension in understanding financial market dynamics. By studying investor behavior through this strategy, it is possible to better anticipate market trends and make more informed investment decisions.
Presentation of the Mason’s Line Indicator:
The main strategy of this indicator is to measure the average satisfaction of investors based on the position of an imaginary air bubble in a tube delimited by the market’s highs and lows over a given period. After calculating the satisfaction level, it is then normalized between 0 and 1, and a moving average can be used to visualize trends.
Key features:
Calculation of highs and lows over a user-defined period.
Determination of the position of the air bubble in the tube based on the closing price.
Calculation of the average satisfaction of investors over a selected period.
Normalization of the average satisfaction between 0 and 1.
Visualization of normalized or non-normalized average satisfaction levels, as well as their corresponding moving averages.
User parameters:
Period for min and max (days) : Sets the period over which highs and lows will be calculated (1 to 365 days).
Period for average satisfaction (days) : Determines the period over which the average satisfaction of investors will be calculated (1 to 365 days).
Period for SMA : Sets the period of the simple moving average used to smooth the data (1 to 1000 days).
Bubble_value : Adjustment of the air bubble value, ranging from 0 to 1, in increments of 0.025.
Normalized average satisfaction : Option to choose whether to display the normalized or non-normalized average satisfaction.
Please note that the Mason’s Line Indicator is not a guarantee of future market performance and should be used in conjunction with proper risk management. Always ensure that you have a thorough understanding of the indicator’s methodology and its limitations before making any investment decisions. Additionally, past performance is not indicative of future results.

Typical Sweeps: Pivot high/low boxes. Grade sweeps, Handles/PipsTool to show typical pip-grade/ handle-grade sweep distance above pivot highs and pivot lows
-In consolidation/ranging periods (i.e. most of the time); Highs/Lows may by swept by fairly consistent distances in typical stop raids.
-Idea is from ICT teaching on typical Pip-grade sweeps in FX (10,20,30pips). Designed to work on FX, Indices, Commodities, Bitcoin.
-Above chart shows S&P; sweeping below and then above by 5 handles.
///inputs///
~choose sweep distance handles ($) or pips: will auto-calculate depending on the asset: FX= pips; Indices/stocks/commodities = handles ($)
--(2,5,10,20,30,50,100, 500, 1000)
~choose pivot lookback: larger number for more significant swing highs/lows
~choose number of historical boxes to display
~toggle on/off Pivot high boxes and Pivot low boxes independently
~extend boxes fully to the right (default is not extend)
~toggle on/off text
~text & box formatting options
Bitcoin, hourly chart; Pivot lookback = 15; $100 sweep boxes:
Eur/Usd; 15m chart; Pivot lookback = 30; 10pip sweep boxes; Boxes extended fully to the right:

VS Score [SpiritualHealer117]An experimental indicator that uses historical prices and readings of technical indicators to give the probability that stock and crypto prices will be in a certain range on the next close. This indicator may be helpful for options traders or for traders who want to see the probability of a move.
It classifies returns into five categories:
Extreme Rise - Over 2 standard deviations above normal returns
Rise - Between 0.5 standard deviations and 2 standard deviations above normal returns
Flat - Falling in the range of +/- 0.5 standard deviations of normal returns
Fall - Between 0.5 standard deviations and 2 standard deviations below normal returns
Extreme Fall - Over 2 standard deviations below normal returns
It is an adaptive probability model, which trains on the previous 1000 data points, and is calculated by creating probability vectors for the current reading of the PPO, MA, volume histogram, and previous return, and combining them into one probability vector.

GAVAD - Selling after a Strong MovimentThis strategy search for a moment whe the market make two candles are consistently strong, and open a Sell, searching the imediactly correction, on the new candle. It`s easy to see the bars on the histogram graph. Purple Bars represent the candle variation. when on candle cross ove the Signal line the graph plot an Yellow ci, if the second bar crossover the signal a green circle is ploted and the operation start on start of the next candle.
This strategy can be used in a lot of Stocks and other graphs. many times we need a small time of graph, maybe 1 or 5 minutes because the gain shoud be planned to a midle of the second candle. You need look the stocks you will use.
Stocks > 100 dolars isnt great, markets extremly volatly not too. but, Stocks that have a consistently development are very interisting. Look to markets searching maybe 0.5% or 1%.
For this moment, I make the development of a Brasilian Real x American Dollar. In 15 Minutes.
if you use in small timeframe the results can be better.
On this time we make more than 500 trades with a small lot of contracts, without a big percent profitable, but a small profit in each operation, maybe you search more than. To present a real trading system I insert a spreed to present a correct view of the results.
Each stock, Index, or crypto there is a specific configuration?
my suggestion for new stocks
You need choice a stock and using the setup search set over than 70% gain (percent profitable), using a 1% of gain and loss between 1-2%
as the exemple (WDO)
default I prepare a Brazilian Index
6-signal (6% is variation of a candle of the last candle)
10000- multiplicator (its important to configure diferences betwen a stock and an Indice)
gain 3 (this proportion will be set looking you target, how I say, 1% can be good)
loss 8 (this proportion will be set with you bankroll management, how I say, maybe 2%, you need evaluate)
for maximize operations I use in the 1 or 5 minute graph. Timeframes more large make slowlly results,
(but not unable that you use in a 1 hour or a 1 day.)
I make this script by zero. Maybe the code doesnt so organized, but is very easy to understand. If you have any doubts . leave a comment.
I hope help you.

LiquidationsFirst, thanks to the following Tradingview community members for providing open source indicators that I used to develop this indicator!
Liquidations by volume (spot/futures) - @Thomas_Davison
Pivot and liquidation lines - @lmatl
Let me know if either of you do not approve and I will remove the indicator.
This indicator uses pivot points, volume and a liquidation percentage to determine potential liquidation levels. These are not exact but can give traders an idea of potential support or resistance levels.
Pivot points: Currently the pivot points are set to look left 5 bars and right 2 bars. This will determine the high and lows in the chart.
Volume: Assuming that high volume bars are where more leverage is used, this indicator uses the average volume over a 1000 bar period to determine to determine a baseline. I have arbitrarily set 100x lines to 20% above the average volume, 50x lines 10% above, 25x lines 5% above, 10x lines 2.5% above and 5x lines 1.25% above.
Liquidation: Finally, we are making a few assumptions on how liquidations are calculated. The following table includes the percentage a position can decline before being liquidated.
Short: Long:
100x 0.51% 0.49%
50x 1.55% 1.47%
25x 3.70% 3.38%
10x 5.11% 4.67%
5x 6.705% 6.115%
Let me know if there are any questions or if anyone has any improvements!

Weird Renko StratThis strategy uses Renko, it generates a signal when there is a reversal in Renko. When using historical data, it provides a good entry and an okay exit. However, in a real-time environment, this strategy is subject to repaint and may produce a false signal.
As a result, the backtesting result should not be used as a metric to predict future results. It is highly recommended to forward-test the strategy before using it in real trading. I forward test it from 12/18/2022 to 12/21/2022 in paper trading, using the alert feature in Tradingview. I made 60 trades trading the BTCUSDT BINANCE 3 min with 26 as the param and under the condition that I use 20x margin, compounding my yield, and having 0 trading fee, a steady loss is generated: from $10 to $3.02.
This is quite interesting. As if I flip the signal from "Long" to "Short" and another way too, it will be a steady profit from $10 to $21.85. Hence, if I'm trying to anti-trade the real-time alert signal, the current "4 Days Result" will be good. Nevertheless, I still have to forward-test it for longer to see if it will fail eventually.
Dive into the setting of the strategy
- Margin is the leverage you use. 1 means 1x, 10 means 10x. It affects the backtest yield when you backtest
- Compound Yield button is for compound calculation, disable it to go back to normal backtesting
- Anti Strategy button is to do the opposite direction trade, when the original strat told you to "Long", you "Short" instead. Enable it to use the feature
- Param is the block size for the Renko chart
- Drawdown is just a visual tool for you in case you want to place a stop loss (represent by the semitransparent red area in the chart)
- From date Thru Date is to specify the backtest range of the strategy, This feature is turned off by default. It is controlled by the Max Backtest Timeframe which will be explain below
- Max Backtest Timeframe control the From date Thru Date function, disable it to enable the From Date Thru Date function
Param is the most important input in this strategy as it directly affects performance. It is highly recommended to backtest nearly all the possible parameters before deploying it in real trading. Some factors should be considered:
- Price of the asset (like an asset of 1 USD vs an asset of 10000 USD required different param)
- Timeframe (1-minute param is different than 1-month param)
I believe this is caused by the volatility of the selected timeframe since different timeframe has different volatility. Param should be fine-tuned before usage.
Here is the param I'm using:
BTCUSDT BINANCE 3min: 26
BTCUSDT BINANCE 5min: 28
BTCUSDT BINANCE 1day: 15
Background of the strategy:
- The strategy starts with $10 at the start of backtesting (customizable in setting)
- The trading fee is set to 0.00% which is not common for most of the popular exchanges (customizable in setting)
- The contract size is not a fixed amount, but it uses your balance to buy it at the open price. If you are using the compound mode, your balance will be your current total balance. If you are using the non-compound mode, it will just use the $10 you start with unless you change the amount you start with. If you are using a margin higher than 1, it will calculate the corresponding contract size properly based on your margin. (Only these options are allowed, you are not able to change them without changing the code)

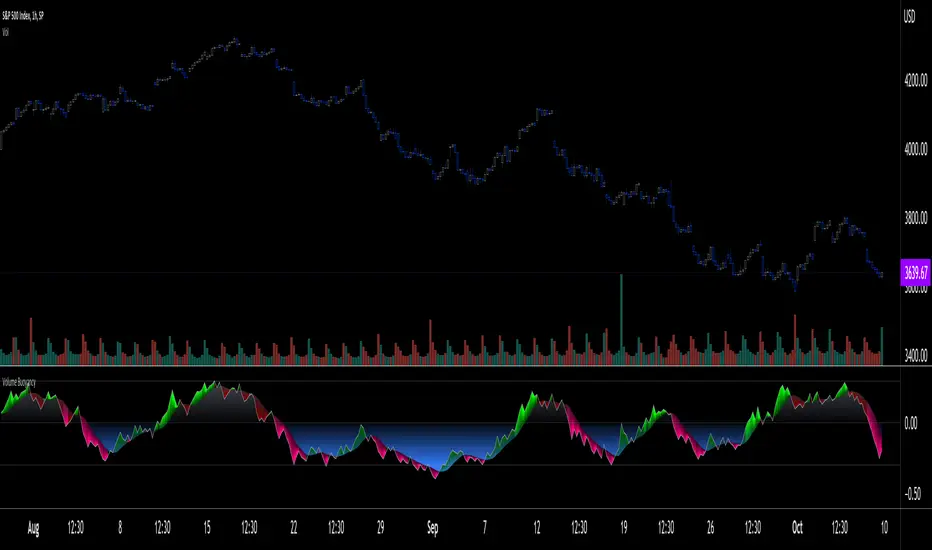
Volume Buoyancy [LucF]█ OVERVIEW
This indicator uses simple analysis of past volume to determine how well it supports recent market activity. What I call Volume buoyancy measures the strength and direction of that support.
█ CONCEPTS
Buoyancy
In physics, buoyancy is the force described in Archemedes' principle :
Any object, wholly or partially immersed in a fluid, is buoyed up by a force equal to the weight of the fluid displaced by the object.
I use the term loosely in this indicator's context, as "Volume buoyancy" here can be directed either up or down, indicating that past volume displays a bullish or bearish bias.
The calculation of buoyancy begins from a target quantity of volume summed over n bars. We then search chart bars backward, adding the volume of up and down bars in two different slots until each slot reaches the target. We then calculate two average distances: one each for the up and down bars whose volume was summed to reach the target. These average distances are then subtracted and the difference is divided by the farthest distance we had to go to find the target in either up or down bars. The last part of the calculations looks like this:
(avgDistanceDn - avgDistanceUp) / barsAnalyzed
When the average distance of down bars is greater than that of up bars, buoyancy will be positive, indicating that past activity favors the upside and vice versa. The force's strength, which in the case of actual buoyancy is the weight of the displaced fluid, in our case is measured by the size of the gap between the average distance of up vs down bars in relation to the farthest distance we had to go in the past. Buoyancy is always between +1 and -1, with values higher/lower than 0.3/-0.3 typically being unsustainable.
█ HOW TO USE THE INDICATOR
Load the indicator on an active chart (see here if you don't know how).
The default configuration displays:
• Buoyancy as a monochrome gray line.
• A channel between buoyancy and its MA, colored in one of four colors. The MA is not plotted by default, but you can see where it is with the channel.
The default settings use an Arnaud Legoux moving average over 20 bars.
• A fill between the MA and the centerline, which can be one of two colors.
• A high level at 0.30, a low level at -0.30 and the centerline at zero.
The default target is the sum of volume in the last 20 bars.
█ FEATURES
The indicator's settings allow you to define:
• A higher timeframe you want the calculations to be made on. Note that you should then ensure your chart's timeframe is always lower than the higher timeframe you specified,
as calculating on a timeframe lower than the chart's does not make much sense because the indicator is then displaying only the value of the last intrabar in the chart bar.
• The number of bars for which to add volume to obtain the target value that will be searched for in past up and down bars.
• The display of the buoyancy and MA lines, the channel between them and the fill between the MA line and the centerline.
• The type and length of the MA.
Using the "Style" tab of the indicator's settings, you can change the type and width of the lines, and the level values.
█ INTERPRETATION
Buoyancy shares the properties and shortcomings of many oscillators:
• It tends to be noisy, which is why the MA line can be helpful.
• The safest way to use it may be as a rough sentiment indicator, i.e., by paying more attention to its bull/bear state above/below the centerline.
• The more intrepid traders will want to use the channel between the main line and the MA, as it will provide earlier information than main line crosses of the centerline.
Decreasing the number of bars for which the source is added to calculate the target value will increase the noise level, somewhat like decreasing an MA's length would, but keep in mind that the number of bars is not the length of an MA.
█ LIMITATIONS
Under some circumstances, the indicator will display zero values because it cannot find the target in past bars. This will happen at the beginning of the dataset when not enough past bars have elapsed, or in the rarer cases anywhere in the dataset, when the target cannot be found in the `MAX_BARS_BACK` number of bars defined in the first line of the indicator's code (the default is 1000).
The calculations use a very primitive interpretation of volume similar to that of OBV , where all the volume of a bar is attributed to either the up or down slot. The indicator nonetheless produces results I think can be useful because we are not so much calculating precise buying/selling pressure as trying to build a big picture of where past activity over many bars appears to be taking price.
Volume data is notoriously high-variance; large values that come into or exit the calculations' scope can produce sudden variations in results, somewhat like the drop-off effect in moving averages.
█ NOTES
• The script can be used with any chart timeframe, including seconds.
• Historical values will always produce the same results. In real time, values will change until the bar closes.
ALMA/EMA/SRSI Strategy + IndicatorBack with another great high hit rate strategy!!
Disclaimer* This strategy was sampled using source code written by @ClassicScott , as referred to in the script, there is a clear line where the source code was scripted by myself.
This Strategy consists of three key factors, the ALMA, EMA crossover, and a Stochastic Rsi
ALMA: The Alma is the step line shown, turning green and red at select times. This average value gives general oversight of the macro movement of price action. and this particular one was coded by Mr.ClassicScott.
EMA crossover: At the input screen you are given an option of the fast and slow ema's. The default is solely for the hit rate and correlation to the Alma of this strategy. The arrows you see depicted on the chart are the crossover events happening.
Stochastic Rsi: The Stochastic Rsi is a stochastic value, using data sampled from the rsi. The use of this indicator in my strategy is to prevent entries when too overbought and oversold, as well as closures and vice versa, to prevent holding bags either way.
Fixed % TP: In the input screen you are given a take profit and stop loss percentage, for good R/R the hit rate will take a notch down, but with no R/R it will be near perfect.
How to use this:
Add it to your chart to get the strategy inputs. (The strategy is really only useful on a 15min TF. However the indicator within it can be used on anything at anytime!)
Watch the yellow and aqua moving averages, these are your ema's and crossover's will trigger signals based on your integer inputs.
Find Correlation between other leading indicators, as well as crossover's down/up and a red/green alma.
DO NOT use the arrows as buy/sell signals. These are simply to show ema's are crossing under or over. Momentum indicator's paired with this can be useful to determine if it could be a buy signal or sell signal.
Cheat Code's Notes:
Almost at 1000 boosts!!! I appreciate the support from everyone and I will keep trying my best to deliver quality strategies for the people.
-Cheat Code
BYBIT:BTCUSDT

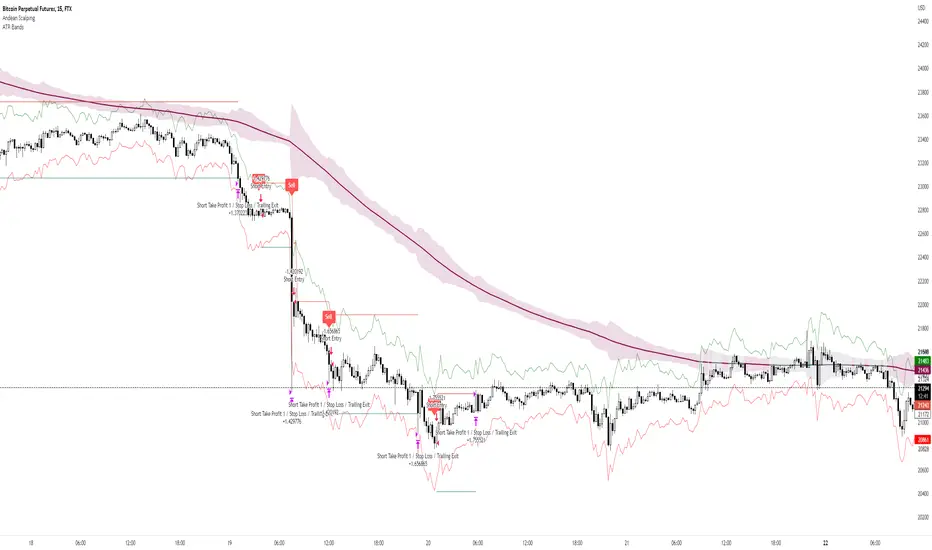
Andean ScalpingAndean Scalping Implementation - BETA
- Uses Andean Oscillator: alpaca.markets
- Implements a threshold moving average (SMA 1000) on the Andean Signal line at 1.1 factor to filter out small moves
- TP/SL using ATR bands at 3x multiplier
Smoothed Heikin Ashi Trend on Chart - TraderHalai BACKTESTSmoothed Heikin Ashi Trend on chart - Backtest
This is a backtest of the Smoothed Heikin Ashi Trend indicator, which computes the reverse candle close price required to flip a Heikin Ashi trend from red to green and vice versa. The original indicator can be found in the scripts section of my profile.
This particular back test uses this indicator with a Trend following paradigm with a percentage-based stop loss.
Note, that backtesting performance is not always indicative of future performance, but it does provide some basis for further development and walk-forward / live testing.
Testing was performed on Bitcoin , as this is a primary target market for me to use this kind of strategy.
Sample Backtesting results as of 10th June 2022:
Backtesting parameters:
Position size: 10% of equity
Long stop: 1% below entry
Short stop: 1% above entry
Repainting: Off
Smoothing: SMA
Period: 10
8 Hour:
Number of Trades: 1046
Gross Return: 249.27 %
CAGR Return: 14.04 %
Max Drawdown: 7.9 %
Win percentage: 28.01 %
Profit Factor (Expectancy): 2.019
Average Loss: 0.33 %
Average Win: 1.69 %
Average Time for Loss: 1 day
Average Time for Win: 5.33 days
1 Day:
Number of Trades: 429
Gross Return: 458.4 %
CAGR Return: 15.76 %
Max Drawdown: 6.37 %
Profit Factor (Expectancy): 2.804
Average Loss: 0.8 %
Average Win: 7.2 %
Average Time for Loss: 3 days
Average Time for Win: 16 days
5 Day:
Number of Trades: 69
Gross Return: 1614.9 %
CAGR Return: 26.7 %
Max Drawdown: 5.7 %
Profit Factor (Expectancy): 10.451
Average Loss: 3.64 %
Average Win: 81.17 %
Average Time for Loss: 15 days
Average Time for Win: 85 days
Analysis:
The strategy is typical amongst trend following strategies with a less regular win rate, but where profits are more significant than losses. Most of the losses are in sideways, low volatility markets. This strategy performs better on higher timeframes, where it shows a positive expectancy of the strategy.
The average win was positively impacted by Bitcoin’s earlier smaller market cap, as the percentage wins earlier were higher.
Overall the strategy shows potential for further development and may be suitable for walk-forward testing and out of sample analysis to be considered for a demo trading account.
Note in an actual trading setup, you may wish to use this with volatility filters, combined with support resistance zones for a better setup.
As always, this post/indicator/strategy is not financial advice, and please do your due diligence before trading this live.
Original indicator links:
On chart version -
Oscillator version -
Update - 27/06/2022
Unfortunately, It appears that the original script had been taken down due to auto-moderation because of concerns with no slippage / commission. I have since adjusted the backtest, and re-uploaded to include the following to address these concerns, and show that I am genuinely trying to give back to the community and not mislead anyone:
1) Include commission of 0.1% - to match Binance's maker fees prior to moving to a fee-less model.
2) Include slippage of 10 ticks (This is a realistic slippage figure from searching online for most crypto exchanges)
3) Adjust account balance to 10,000 - since most of us are not millionaires.
The rest of the backtesting parameters are comparable to previous results:
Backtesting parameters:
Initial capital: 10000 dollars
Position size: 10% of equity
Long stop: 2% below entry
Short stop: 2% above entry
Repainting: Off
Smoothing: SMA
Period: 10
Slippage: 10 ticks
Commission: 0.1%
This script still remains to shows viability / profitablity on higher term timeframes (with slightly higher drawdown), and I have included the backtest report below to document my findings:
8 Hour:
Number of Trades: 1082
Gross Return: 233.02%
CAGR Return: 14.04 %
Max Drawdown: 7.9 %
Win percentage: 25.6%
Profit Factor (Expectancy): 1.627
Average Loss: 0.46 %
Average Win: 2.18 %
Average Time for Loss: 1.33 day
Average Time for Win: 7.33 days
Once again, please do your own research and due dillegence before trading this live. This post is for education and information purposes only, and should not be taken as financial advice.

High volume zone█ OVERVIEW
Show high volume zone in a lower timeframe.
█ CONCEPTS
1- Choose an amount of volume (1 000 by default)
2- Choose a timeframe (1 minute by default)
3- It highlight every zone where volume was > 1000 in less than one minute
█ OTHER SECTIONS
Limitation:
- Unfortunately, I didn't find a way to make it in a lower timeframe than 1 minute with Pinescript
- It is truncate by minute so a high volume between two lower tf candles may not be count
If you have a solution for these, glad to hear it.

Joker Trailing TP BotTrailing Take Profit is used by the traders to increase their gains when the prices moves in a favorable direction. Let’s have a look at what is Trailing Take Profit and how it works.
What Is a Trailing Take Profit?
Trailing Take Profit is a term largely used in crypto, whereas you may encounter the term Trailing Stop in traditional trading describing almost the same thing, So what’s the difference between Trailing Take Profit and Trailing Stop? Trailing Stop is a type of Stop Loss automatically moving in the same direction as the asset’s price. Trailing Take Profit is nothing else than Trailing Stop activated after initial Take Profit is reached.
The main difference between these two is that Trailing Take Profit takes the profit in any case (altough it might be later annihilated by Trailing Stop). Thus, Trailing Take Profit reduces the risks that might’ve occurred using Trailing Stop alone. Trailing Take Profit is bound to the maximum of Take Profit price instead of just a price increase/decrease.
As you might notice, the terms Trailing Take Profit and Stop Loss are quite similar. To avoid confusion, in this article we will be talking about Trailing Take Profit as defined above.
Trailing Take Profit only moves in one direction. It is designed to lock in profit and limit losses. The trailing profit only moves up (in case of a long strategy) once the price has surpassed previous high and a new high has been established. If the trailing take profit moves up, it cannot move back down, thus securing the profit and preventing losses.
Trailing Take Profit allows the trade to remain open and continue to profit as long as the price is moving in the investor’s favor. If the price changes direction and the change surpasses the previously set percentage the order will be closed.
How Does it Work?
For example if you buy BTC at the price of 10000, if you set a Take Profit at 11000 and a Trailing Take Profit at 5% :
If the price goes up to 10500, nothing happens because the Take Profit at 11000 has not been reached.
Then if the BTC price goes up top 11000, a Stop Order at 10450 will be set.
Then if the BTC price goes down to 10500, the Stop Order stays at 104500.
Then if the BTC price goes up to 12000, the Stop Order moves to 11400.
Then if the BTC price goes down to 11000, the Stop Order at 11400 is executed.
You see that without Trailing Take Profit, the buy order would have been sold at 11000. Thus, a trader would miss an earning opportunity at 11400.

Traling.SL.TargetTrailing SL and Target
I have seen few requests in PineScripters telegram group asking questions about implementation of trailing stop-loss (SL) and targets. This script is one of the way to implement the same.
This script is developed based on dark color theme and is best viewed using dark color theme.
How and where can this script be used:
The script is built to demonstrate how one can implement the trailing SL and target, so by referring the script one can mimic the approach and add trailing SL and target implementation in their own strategy.
How it works:
To demonstrate the SL and target implementation, i have considered simple EMA crossover strategy.
Key Input Parameters
Method to use for SL/Target trailing:
1. % Based Target and SL - Used to calculate trailing based on parameters defined under group '% Based Target SL'
2. Fixed point Based Target and SL - Used to calculate trailing based on parameters defined under group 'Fixed point Based Target and SL'
% Based Target and SL:
Initial profit % - This is used to calculate target when trade is initiated
Initial SL % - This is used to calculate SL when trade is initiated
Initiate trailing % - This parameter determines, when to start trailing SL and target.
Trail profit by % - Target would be trailed by % specified as this parameter
Trail SL by % - SL would be trailed by % specified as this parameter
e.g.
Trade type: - Long
Trade price: 10000
initial profit %: 1
Initial SL %: 1
Initiate trailing %: 0.5
Trail profit by %: 0.3
Trail SL by %: 0.4
Calculations based on above:
initial profit %: 10100 (trade price + 1%)
Initial SL %: 9900 (trade price - 1%)
Initiate trailing %: 10049.5 (initial profit - 0.5%)
Trail profit by %: 10130 (initial profit + 0.3%)
Trail SL by %: 9939.6 (initial SL + 0.4%)
For next iteration of Trailing SL and target above calculated values will be taken as a base and next set of values will be calculated. these calculations will continue till the trade is exited either on price reaching profit or SL point.
Fixed point Based Target and SL:
Initial profit target points - To derive initial target, parameter value is added to trade price in case of long trade.
Initial SL points - To derive SL point, parameter value is subtracted from trade price
Initiate trailing points - To derive start of trailing logic, parameter value is subtracted from initial profit point.
Trail profit by points - In case of long trade, parameter value is added to the profit target to derive new trailed profit target.
Trail SL by % - In case of long trade, parameter value is added to the SL initial point to derive new trailed SL.
Calculation of Trailing SL and target will continue till the trade is exited either on price reaching profit or SL point.
Plots displayed on the chart:
Apart from default trade markings i have added 3 shapes on the chart to describe working of Trailing SL and targets.
Diamond shape marks - These are added on the chart when trade is initiated. These shapes gives additional trade information by way of 'tooltip'. This information can be viewed by placing mouse pointer on the shape.
Circle shape marks - These are added on the chart whenever Trailing SL and targets are calculated. These shapes gives additional trade information by way of 'tooltip'. This information can be viewed by placing mouse pointer on the shape. You will also notice a number displayed just above or below circle denoting Trailing iteration.
Labels up and label down shapes - These are dynamically placed on the chart whenever trade is in progress. These labels will display ongoing trades, Target and SL points.

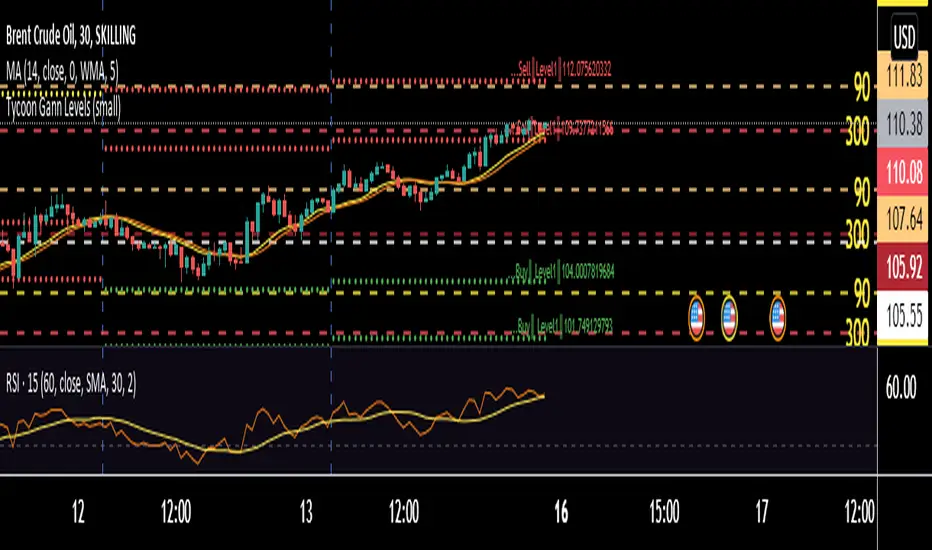
Tycoon Gann Currently this script will work for the stocks and futures price trading in between 1000 - 100000. In our future update we will add another feature that will give you access to all the price digit stocks futures and currencies too .
This is purely based on a secret method of Tycoon Infotek as a research of GANN levels we found in our experience these WD GANN Trend angle based calculations giving us some important hints to watch . Degree offset from previous close price add 90 degree to calculate resistance and substract 90 to get resistance levels . green color dots denotes buying pressure zone and red color denotes selling pressure zones . yellow line indicates neutral sign
These levels not only shows us the Support and resistance . It clearly intimate us the strength of selling and buying pressure naturally occurred once the price reaches the zones.
Time█ OVERVIEW
This library is a Pine Script™ programmer’s tool containing a variety of time related functions to calculate or measure time, or format time into string variables.
█ CONCEPTS
`formattedTime()`, `formattedDate()` and `formattedDay()`
Pine Script™, like many other programming languages, uses timestamps in UNIX format, expressed as the number of milliseconds elapsed since 00:00:00 UTC, 1 January 1970. These three functions convert a UNIX timestamp to a formatted string for human consumption.
These are examples of ways you can call the functions, and the ensuing results:
CODE RESULT
formattedTime(timenow) >>> "00:40:35"
formattedTime(timenow, "short") >>> "12:40 AM"
formattedTime(timenow, "full") >>> "12:40:35 AM UTC"
formattedTime(1000 * 60 * 60 * 3.5, "HH:mm") >>> "03:30"
formattedDate(timenow, "short") >>> "4/30/22"
formattedDate(timenow, "medium") >>> "Apr 30, 2022"
formattedDate(timenow, "full") >>> "Saturday, April 30, 2022"
formattedDay(timenow, "E") >>> "Sat"
formattedDay(timenow, "dd.MM.yy") >>> "30.04.22"
formattedDay(timenow, "yyyy.MM.dd G 'at' hh:mm:ss z") >>> "2022.04.30 AD at 12:40:35 UTC"
These functions use str.format() and some of the special formatting codes it allows for. Pine Script™ documentation does not yet contain complete specifications on these codes, but in the meantime you can find some information in the The Java™ Tutorials and in Java documentation of its MessageFormat class . Note that str.format() implements only a subset of the MessageFormat features in Java.
`secondsSince()`
The introduction of varip variables in Pine Script™ has made it possible to track the time for which a condition is true when a script is executing on a realtime bar. One obvious use case that comes to mind is to enable trades to exit only when the exit condition has been true for a period of time, whether that period is shorter that the chart's timeframe, or spans across multiple realtime bars.
For more information on this function and varip please see our Using `varip` variables publication.
`timeFrom( )`
When plotting lines , boxes , and labels one often needs to calculate an offset for past or future end points relative to the time a condition or point occurs in history. Using xloc.bar_index is often the easiest solution, but some situations require the use of xloc.bar_time . We introduce `timeFrom()` to assist in calculating time-based offsets. The function calculates a timestamp using a negative (into the past) or positive (into the future) offset from the current bar's starting or closing time, or from the current time of day. The offset can be expressed in units of chart timeframe, or in seconds, minutes, hours, days, months or years. This function was ported from our Time Offset Calculation Framework .
`formattedNoOfPeriods()` and `secondsToTfString()`
Our final two offerings aim to confront two remaining issues:
How much time is represented in a given timestamp?
How can I produce a "simple string" timeframe usable with request.security() from a timeframe expressed in seconds?
`formattedNoOfPeriods()` converts a time value in ms to a quantity of time units. This is useful for calculating a difference in time between 2 points and converting to a desired number of units of time. If no unit is supplied, the function automatically chooses a unit based on a predetermined time step.
`secondsToTfString()` converts an input time in seconds to a target timeframe string in timeframe.period string format. This is useful for implementing stepped timeframes relative to the chart time, or calculating multiples of a given chart timeframe. Results from this function are in simple form, which means they are useable as `timeframe` arguments in functions like request.security() .
█ NOTES
Although the example code is commented in detail, the size of the library justifies some further explanation as many concepts are demonstrated. Key points are as follows:
• Pivot points are used to draw lines from. `timeFrom( )` calculates the length of the lines in the specified unit of time.
By default the script uses 20 units of the charts timeframe. Example: a 1hr chart has arrows 20 hours in length.
• At the point of the arrows `formattedNoOfPeriods()` calculates the line length in the specified unit of time from the input menu.
If “Use Input Time” is disabled, a unit of time is automatically assigned.
• At each pivot point a label with a formatted date or time is placed with one of the three formatting helper functions to display the time or date the pivot occurred.
• A label on the last bar showcases `secondsSince()` . The label goes through three stages of detection for a timed alert.
If the difference between the high and the open in ticks exceeds the input value, a timer starts and will turn the label red once the input time is exceeded to simulate a time-delayed alert.
• In the bottom right of the screen `secondsToTfString()` posts the chart timeframe in a table. This can be multiplied from the input menu.
Look first. Then leap.
█ FUNCTIONS
formattedTime(timeInMs, format)
Converts a UNIX timestamp (in milliseconds) to a formatted time string.
Parameters:
timeInMs : (series float) Timestamp to be formatted.
format : (series string) Format for the time. Optional. The default value is "HH:mm:ss".
Returns: (string) A string containing the formatted time.
formattedDate(timeInMs, format)
Converts a UNIX timestamp (in milliseconds) to a formatted date string.
Parameters:
timeInMs : (series float) Timestamp to be formatted.
format : (series string) Format for the date. Optional. The default value is "yyyy-MM-dd".
Returns: (string) A string containing the formatted date.
formattedDay(timeInMs, format)
Converts a UNIX timestamp (in milliseconds) to the name of the day of the week.
Parameters:
timeInMs : (series float) Timestamp to be formatted.
format : (series string) Format for the day of the week. Optional. The default value is "EEEE" (complete day name).
Returns: (string) A string containing the day of the week.
secondsSince(cond, resetCond)
The duration in milliseconds that a condition has been true.
Parameters:
cond : (series bool) Condition to time.
resetCond : (series bool) When `true`, the duration resets.
Returns: The duration in seconds for which `cond` is continuously true.
timeFrom(from, qty, units)
Calculates a +/- time offset in variable units from the current bar's time or from the current time.
Parameters:
from : (series string) Starting time from where the offset is calculated: "bar" to start from the bar's starting time, "close" to start from the bar's closing time, "now" to start from the current time.
qty : (series int) The +/- qty of units of offset required. A "series float" can be used but it will be cast to a "series int".
units : (series string) String containing one of the seven allowed time units: "chart" (chart's timeframe), "seconds", "minutes", "hours", "days", "months", "years".
Returns: (int) The resultant time offset `from` the `qty` of time in the specified `units`.
formattedNoOfPeriods(ms, unit)
Converts a time value in ms to a quantity of time units.
Parameters:
ms : (series int) Value of time to be formatted.
unit : (series string) The target unit of time measurement. Options are "seconds", "minutes", "hours", "days", "weeks", "months". If not used one will be automatically assigned.
Returns: (string) A formatted string from the number of `ms` in the specified `unit` of time measurement
secondsToTfString(tfInSeconds, mult)
Convert an input time in seconds to target string TF in `timeframe.period` string format.
Parameters:
tfInSeconds : (simple int) a timeframe in seconds to convert to a string.
mult : (simple float) Multiple of `tfInSeconds` to be calculated. Optional. 1 (no multiplier) is default.
Returns: (string) The `tfInSeconds` in `timeframe.period` format usable with `request.security()`.

EMA bands + leledc + bollinger bands trend following strategy v2The basics:
In its simplest form, this strategy is a positional trend following strategy which enters long when price breaks out above "middle" EMA bands and closes or flips short when price breaks down below "middle" EMA bands. The top and bottom of the middle EMA bands are calculated from the EMA of candle highs and lows, respectively.
The idea is that entering trades on breakouts of the high EMAs and low EMAs rather than the typical EMA based on candle closes gives a bit more confirmation of trend strength and minimizes getting chopped up. To further reduce getting chopped up, the strategy defaults to close on crossing the opposite EMA band (ie. long on break above high EMA middle band and close below low EMA middle band).
This strategy works on all markets on all timeframes, but as a trend following strategy it works best on markets prone to trending such as crypto and tech stocks. On lower timeframes, longer EMAs tend to work best (I've found good results on EMA lengths even has high up to 1000), while 4H charts and above tend to work better with EMA lengths 21 and below.
As an added filter to confirm the trend, a second EMA can be used. Inputting a slower EMA filter can ensure trades are entered in accordance with longer term trends, inputting a faster EMA filter can act as confirmation of breakout strength.
Bar coloring can be enabled to quickly visually identify a trend's direction for confluence with other indicators or strategies.
The goods:
Waiting for the trend to flip before closing a trade (especially when a longer base EMA is used) often leaves money on the table. This script combines a number of ways to identify when a trend is exhausted for backtesting the best early exits.
"Delayed bars inside middle bands" - When a number of candle's in a row open and close between the middle EMA bands, it could be a sign the trend is weak, or that the breakout was not the start of a new trend. Selecting this will close out positions after a number of bars has passed
"Leledc bars" - Originally introduced by glaz, this is a price action indicator that highlights a candle after a number of bars in a row close the same direction and result in greatest high/low over a period. It often triggers when a strong trend has paused before further continuation, or it marks the end of a trend. To mitigate closing on false Leledc signals, this strategy has two options: 1. Introducing requirement for increased volume on the Leledc bars can help filter out Leledc signals that happen mid trend. 2. Closing after a number of Leledc bars appear after position opens. These two options work great in isolation but don't perform well together in my testing.
"Bollinger Bands exhaustion bars" - These bars are highlighted when price closes back inside the Bollinger Bands and RSI is within specified overbought/sold zones. The idea is that a trend is overextended when price trades beyond the Bollinger Bands. When price closes back inside the bands it's likely due for mean reversion back to the base EMA in which this strategy will ideally re-enter a position. Since the added RSI requirements often make this indicator too strict to trigger a large enough sample size to backtest, I've found it best to use "non-standard" settings for both the bands and the RSI as seen in the default settings.
"Buy/Sell zones" - Similar to the idea behind using Bollinger Bands exhaustion bars as a closing signal. Instead of calculating off of standard deviations, the Buy/Sell zones are calculated off multiples of the middle EMA bands. When trading beyond these zones and subsequently failing back inside, price may be due for mean reversion back to the base EMA. No RSI filter is used for Buy/Sell zones.
If any early close conditions are selected, it's often worth enabling trade re-entry on "middle EMA band bounce". Instead of waiting for a candle to close back inside the middle EMA bands, this feature will re-enter position on only a wick back into the middle bands as will sometimes happen when the trend is strong.
Any and all of the early close conditions can be combined. Experimenting with these, I've found can result in less net profit but higher win-rates and sharpe ratios as less time is spent in trades.
The deadly:
The trend is your friend. But wouldn't it be nice to catch the trends early? In ranging markets (or when using slower base EMAs in this strategy), waiting for confirmation of a breakout of the EMA bands at best will cause you to miss half the move, at worst will result in getting consistently chopped up. Enabling "counter-trend" trades on this strategy will allow the strategy to enter positions on the opposite side of the EMA bands on either a Leledc bar or Bollinger Bands exhaustion bar. There is a filter requiring either a high/low (for Leledc) or open (for BB bars) outside the selected inner or outer Buy/Sell zone. There are also a number of different close conditions for the counter-trend trades to experiment with and backtest.
There are two ways I've found best to use counter-trend trades
1. Mean reverting scalp trades when a trend is clearly overextended. Selecting from the first 5 counter-trend closing conditions on the dropdown list will usually close the trades out quickly, with less profit but less risk.
2. Trying to catch trends early. Selecting any of the close conditions below the first 5 can cause the strategy to behave as if it's entering into a new trend (from the wrong side).
This feature can be deadly effective in profiting from every move price makes, or deadly to the strategy's PnL if not set correctly. Since counter-trend trades open opposite the middle bands, a stop-loss is recommended to reduce risk. If stop-losses for counter-trend trades are disabled, the strategy will hold a position open often until liquidation in a trending market if th trade is offsides. Note that using a slower base EMA makes counter-trend stop-losses even more necessary as it can reduce the effectiveness of the Buy/Sell zone filter for opening the trades as price can spend a long time trending outside the zones. If faster EMAs (34 and below) are used with "Inner" Buy/Zone filter selected, the first few closing conditions will often trigger almost immediately closing the trade at a loss.
The niche:
I've added a feature to default into longs or shorts. Enabling these with other features (aside from the basic long/short on EMA middle band breakout) tends to break the strategy one way or another. Enabling default long works to simulate trying to acquire more of the asset rather than the base currency. Enabling default short can have positive results for those high FDV, high inflation coins that go down-only for months at a time. Otherwise, I use default short as a hedge for coins that I hold and stake spot. I gain the utility and APR of staking while reducing the risk of holding the underlying asset by maintaining a net neutral position *most* of the time.
Disclaimer:
This script is intended for experimenting and backtesting different strategies around EMA bands. Use this script for your live trading at your own risk. I am a rookie coder, as such there may be errors in the code that cause the strategy to behave not as intended. As far as I can tell it doesn't repaint, but I cannot guarantee that it does not. That being said if there's any question, improvements, or errors you've found, drop a comment below!

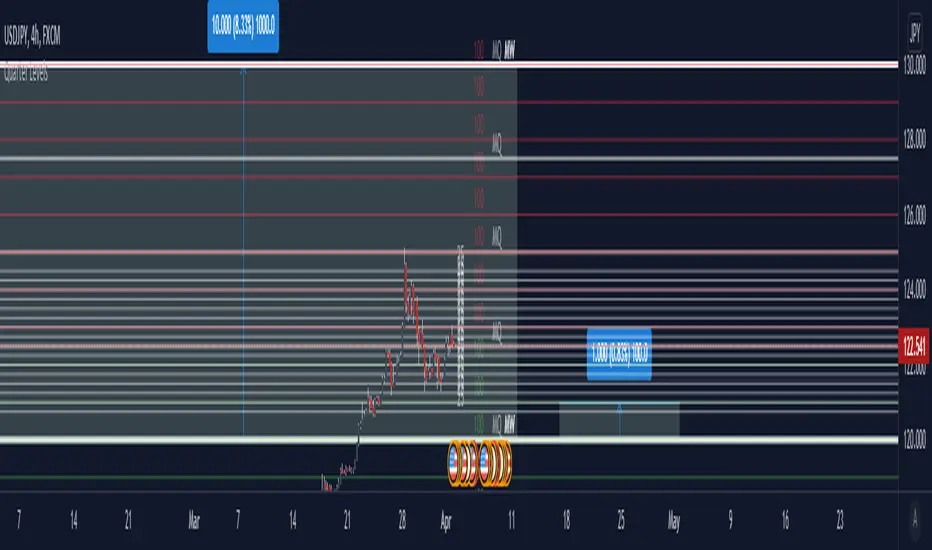
Quarter theory and whole numbersThis is an indicator that marks off Major whole/quarter levels
Between each major whole they are 1000 pips and that can be quarter and give you major quarter levels of 250 pips
Each of the major whole number can be divided into 10 - 100 pip ranges(giving you minor whole number), and you can in turn quarter these to give you 25 pips.
This is the lowest value you would need as price moves in 25 pip.
You can use this on any market as long as you can figure out the conversion from price into pips for you assets (This varies).
@Bogio.01 - Bank Levels - USDThis indicator identifies the historical high and plots bank levels against it. The black lines are 1000 pips apart, the red line is in the middle, and the blue dotted lines are 118 pips away from the black and red lines.

Auto Support & Resistance From Option Strike Price + PercentagesAUTO SUPPORT AND RESISTANCE FROM OPTIONS STRIKE PRICES WITH PERCENTAGE GAPS
This is an auto support and resistance level indicator that uses options strike prices or psychological numbers as the relevant levels. Set your starting level or strike price and input the options strike price gaps for that ticker and 15 lines in either direction will automatically populate on the chart. It also has a table in the bottom right corner that tells you how far the current price is from the next closest support and resistance levels.
Everything is easily customizable in the indicator input settings including turning the lines on/off, turning the percentage gaps table on/off, setting the options strike price gaps, setting the starting level, setting the position of the percentage gaps table, changing support and resistance line colors all at once and updating the linewidth of all of the support and resistance lines at once.
***HOW TO USE***
First, go into the indicator settings and set the starting level to use. If you are trading SPY and it is near 450, then set your starting level at 450. If you are trading SQQQ and it is near 38, set your starting level to 38. If you are trading crypto, set your levels to the nearest psychological or round number such as 40,000 for BTC or 2,500 for ETH or 16.50 for LINK.
Second, set your options strike price gaps. If you are trading SPY, this will be 2.5. If you are trading SQQQ this number would be 1. If you are trading crypto, try using psychological price levels instead of strike prices, such as 500, 1000 or 5000 for BTC and 100, 250 or 500 for ETH. For small priced cryptos, use decimals such as .25, .50, etc.
Once these inputs are filled in, 15 levels in each direction will automatically populate on the chart for you.
If price is above a level, it will paint green. If price is below a level it will paint red. These colors represent support and resistance visually for you on the chart and will change dynamically as price moves above or below these levels. These colors can be customized in the indicator input settings to change all lines by only updating one color.
There is a table of percentage gap updates that will tell you in real time how far away the price is from the nearest support and resistance lines so you always know your risk to reward ratios. Each label will also be colored the same as the corresponding support or resistance line as a visual aid.
***MARKETS***
This indicator can be used as a signal on all markets, including stocks, crypto, futures and forex.
***TIMEFRAMES***
This support and resistance indicator can be used on all timeframes.
***TIPS***
Try using numerous indicators of ours on your chart so you can instantly see the bullish or bearish trend of multiple indicators in real time without having to analyze the data. Some of our favorites are our Auto Fibonacci, Directional Movement Index, Volume Profile, Momentum and Money Flow Index in combination with this auto support and resistance indicator. They all have real time Bullish and Bearish labels as well so you can immediately understand each indicator's trend.

Optimized Trend Tracker Oscillator OTTOOTTO - Optimized Trend Tracker Oscillator is a derivative of Anıl Özekşi's OTT - Optimized Trend Tracker:
It is more sensitive to price movements when compared to its ancestor OTT.
There are 2 more parameters of VIDYA moving average lengths FAST and SLOW.
Fast VIDYA has length of 10 bars and Slow VIDYA has 25.
Correction Constant is a crucial parameter to make the calculation more stable.
you can use 1000 to 100000000 by the powers of ten to obtain more accurate graphic values.
Buy and Sell signals make indicator more meaningful.
