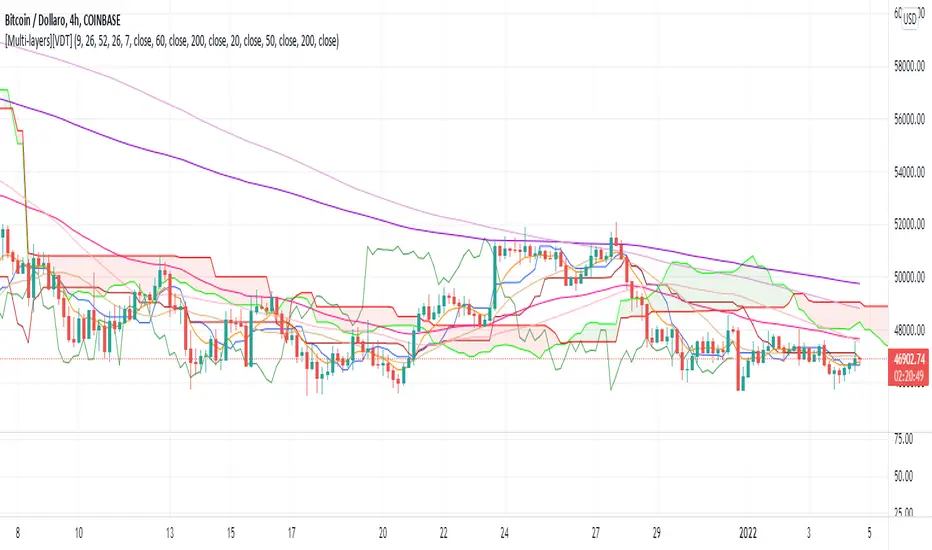
[Multi-layers][VDT]New multi-indicator to merge together three of the most popular indicators used by traders in technical analysis:
1) Ichimoku Cloud, with parameters editable by the trader. Default parameters are: 9-26-52-26
2) 3X Simple Moving Average (SMA), with periods editable by the trader. Default periods are: 20-50-200
3) 3X Exponential Moving Average (EMA), with periods editable by the trader. Default periods are: 7-60-200
Traders can decide whether to print or to hide each indicators separately in the graph, creating three different overlays.
스크립트에서 "流通市值在50亿至200亿之间的股票中,成交量持续放大的个股有哪些?"에 대해 찾기
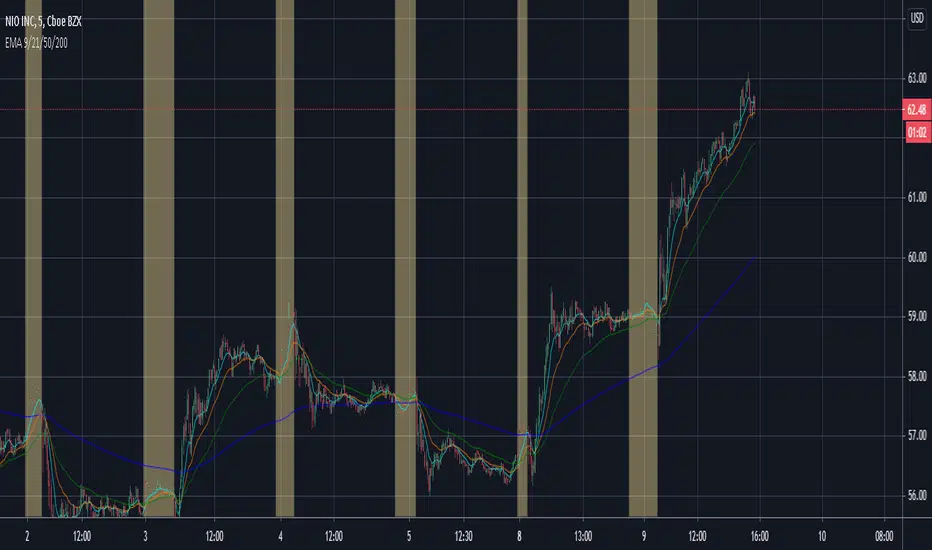
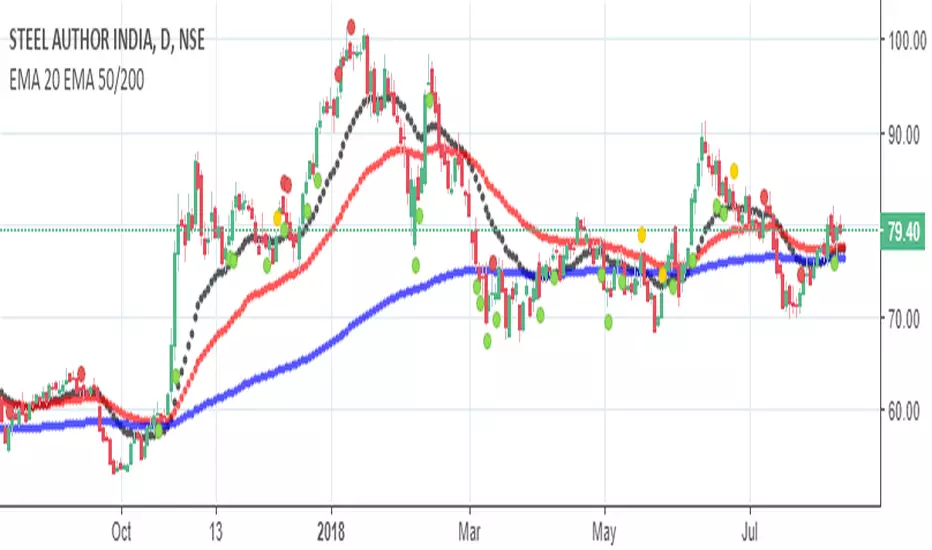
EMAs 20/50/200 with Trend ColoringIt calculates EMA 20, 50, and 200.
For each EMA, it compares the current value with the previous bar (ema > ema ).
If rising → green, if falling → red.
All three EMAs are plotted with different colors dynamically changing by slope.

Timeframe StrategyThis is a multi-timeframe trading strategy inspired by Ross Cameron's style, optimized for scalping and trend-following across various timeframes (1m, 5m, 15m, 1h, and 1D). The strategy integrates a comprehensive set of technical indicators, dynamic risk management, and visual tools.
Core Features
Dynamic Take Profit, Stop Loss & Trailing Stop
> Separate settings per timeframe for:
-TP% (Take Profit)
-SL% (Stop Loss)
-Trailing Stop %
-Cooldown bars
> Configurable via UI inputs.
>Smart Entry Conditions
Bullish entry: EMA9 crossover EMA20 and EMA50 > EMA200
Bearish entry: EMA9 crossunder EMA20 and EMA50 < EMA200
>Additional confirmation filters:
-Volume Filter (enabled/disabled via UI)
-Time Filter (e.g., only between 15:00–20:00 UTC)
-Spike Filter: rejects high-volatility candles
-RSI Filter: above/below 50 for trend confirmation
-ADX Filter (only applied on 1m, e.g., ADX > 15)
-Micro-Volatility Filter: minimum range percentage (1m only)
-Trend Filter (1m only): price must be above/below EMA200
>Trailing Stop Logic
-Configurable for each timeframe.
- Optional via toggle (use_trailing).
>Trade Cooldown Logic
-Prevents consecutive trades within X bars, configurable per timeframe.
>Technical Indicators Used
-EMA 9 / 20 / 50 / 200
-VWAP
-RSI (14)
-ATR (14) for volatility-based spike filtering
-Custom-calculated ADX (14) (manually implemented)
>Visual Elements
🔼/🔽 Entry signals (long/short) plotted on the chart.
📉 Table in bottom-left:
Displays current values of EMA/VWAP/volume/ATR/ADX.
> Optional "Tab info" panel in top-right (toggleable):
-Timeframe & strategy settings
-Live status of filters (volume, time, cooldown, spike, RSI, ADX, range, trend)
-Uses emoji (✅ / ❌) for quick diagnostics.
>User Customization
-Inputs per timeframe for all key parameters.
-Toggle switches for:
-Trailing stop
-Volume filter
-Info table visibility
This strategy is designed for active traders seeking a balance between momentum entry, risk control, and adaptability across timeframes. It's ideal for backtesting quick reversals or breakout setups in fast markets, especially at lower timeframes like 1m or 5m.

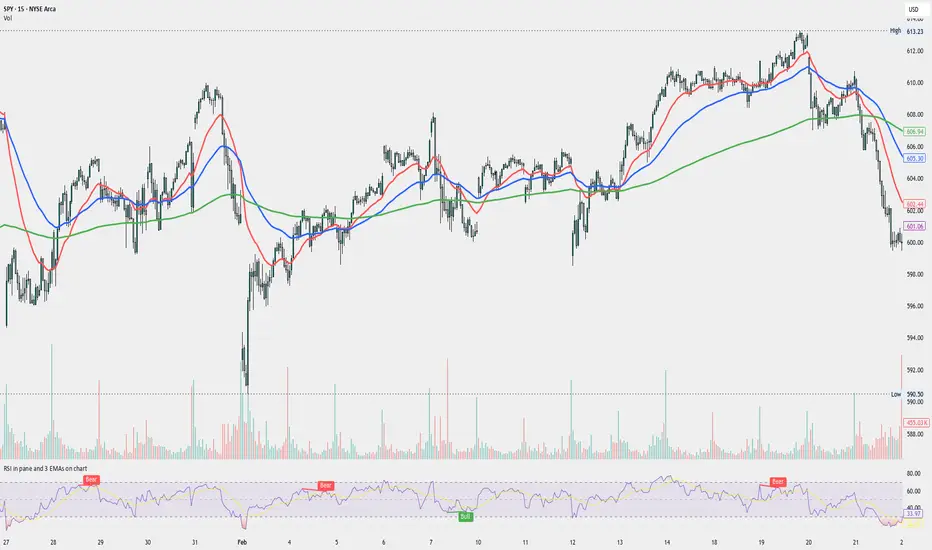
RSI in pane and 3 EMAs on chartCustom RSI in Pane + 3 EMAs on Chart — with Optional RSI Divergence Detection
Combines RSI in a separate pane with 3 EMAs on the chart and optional RSI-based divergence detection. Useful for analyzing both momentum and trend structure.
Features
RSI Pane
Custom RSI calculation (not built-in ta.rsi) with adjustable source and length
Overlay optional moving average (SMA, EMA, SMMA/RMA, WMA, VWMA, or Bollinger Bands) Overbought/oversold gradient fill for visual clarity (70 / 30 zones)
Midline (50) for neutral RSI territory
RSI Divergence Detection
Optional: toggle on/off with one input
Regular Bullish Divergence : Price makes a lower low, RSI makes a higher low
Regular Bearish Divergence : Price makes a higher high, RSI makes a lower high
Customizable lookback for pivot detection
Visual markers and labels plotted on RSI
Built-in alert conditions for both divergence types
3 EMA Trend Indicators on Price Chart
Three customizable EMAs (default: 20, 50, 200)
Color-coded and clearly plotted on main chart
Use to determine short/mid/long-term trend bias
No repainting or smoothing artifacts
Why use this script?
Gives a full view of trend + momentum without cluttering the main price chart, and it helps confirm entries and exits by observing RSI behavior alongside EMAs. The optional divergence detection can act as a signal for potential exhaustion or reversal (not entry signals on their own). It is a Good fit for traders who use RSI zones, divergences, and EMA structure in their decision-making, both for intra-day and swing trades (where it performs best).
How to use
Add this script to your chart. EMAs will appear on the main price chart; RSI and divergence will appear in a separate pane.
Adjust RSI and MA settings to fit your trading style (e.g., fast RSI for scalping, slower for swing)
Enable "Show Divergence" if you want visual alerts and markers
Use alerts to get notified when a divergence occurs without watching the chart
Always check the divergences on different time frames to validate the setup, and do not consider them valid on small time frames (<15 minutes).
Built for traders who want both momentum and trend context in a single tool — without clutter, repainting, or noise. I created this script to streamline my own analysis and avoid switching between multiple indicators. It's not meant to be a "signal generator" but a visual assistant for making better decisions. If you find it useful or have feedback, feel free to reach out.
Triple EMA + Volume/Price SignalsOverview
This script merges three exponential moving averages (EMA) with adaptive volume thresholds to identify high-confidence trends. Unlike basic volume indicators, it triggers signals only when volume exceeds both a user-defined absolute value (e.g., 500k) and a percentage increase (e.g., 5%) – reducing noise in volatile markets.
Key Features
Triple EMA System:
Short (9), Medium (21), and Long (50) EMAs for trend direction.
Bullish Signal: Short EMA > Medium EMA > Long EMA.
Bearish Signal: Short EMA < Medium EMA < Long EMA.
Dual-Threshold Volume Confirmation:
Absolute Volume: Highlight bars where volume exceeds X (e.g., 500,000).
Percentage Increase: Highlight bars where volume rises by Y% (e.g., 5%) vs. prior bar.
Users can enable/disable either threshold.
Customizable Alerts:
Trigger alerts only when both EMA alignment and volume conditions are met.
How It Works
Trend + Volume Synergy:
A bullish EMA crossover alone might be a false breakout. This script requires additional volume confirmation (e.g., 500k volume + 5% spike) to validate the move.
Flexibility: Adjust thresholds for different assets:
Stocks: Higher absolute volume (e.g., 1M shares).
Crypto: Smaller absolute volume but larger % spikes (e.g., 10%).
Usage Examples
Swing Trading:
Set EMA lengths to 20/50/200 and volume thresholds to 500k + 5% on daily charts.
Scalping:
Use 5/13/21 EMAs with 100k volume + 3% spikes on 5-minute charts.

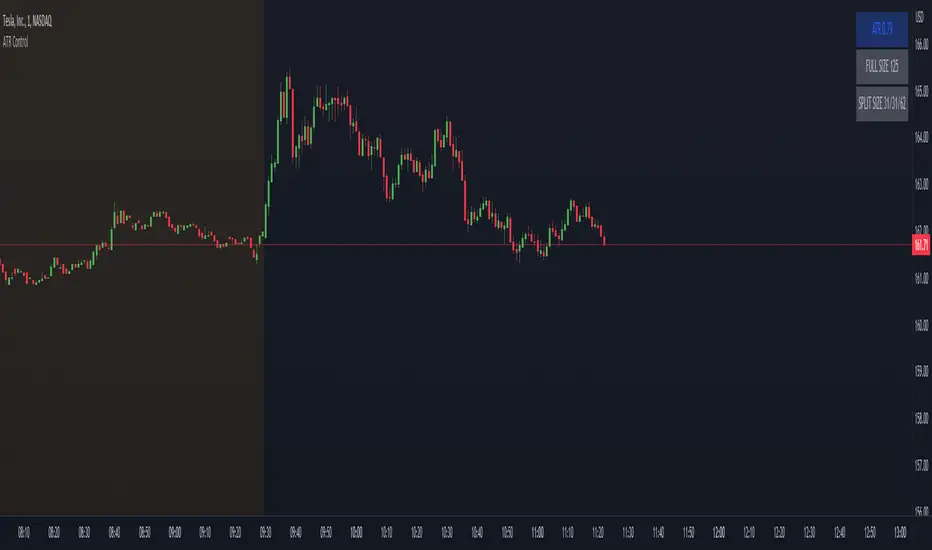
ATR ControlThis indicator shows the following values:
ATR value of the current symbol
Size of the full position based on the maximum risk set
Three sizes that are percents of the full size already present in this indicator
Customizable settings are:
Show/hide single rows
ATR Timeframe
ATR Lenght
First percent of the split to apply
Second percent of the split to apply
Maximum risk
The last percent is automatically calculated using the first two.
Example:
Full size: 500
First percent: 10
Second percent: 40
The third percent is calculated as 100 - first percent - second percent = 50
The split sizes shown are: 50/200/250
EMA Zonen + Projektion (21, 50 + 200)standard 21ema, 50ema and 200ema,
ema Projection for next 3 Bars,
1% Box above to below all emas.

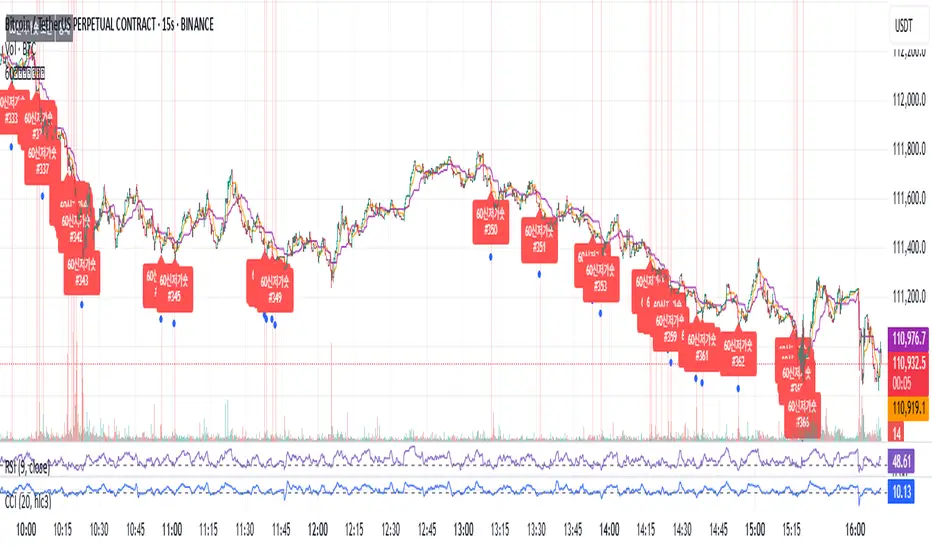
60 신저가 숏_신저가“60-Day New Low Short (New Low)” is a momentum breakdown setup that sells short when price prints a fresh 60-day low, aiming to ride continued weakness after support fails.
Enter on the breakdown close (or next open) with confirmation such as expanding volume, relative weakness vs. a benchmark, and price below the 50/200-day MAs.
Manage risk with a stop above the recent swing high or 20-day high; take profits via ATR-based targets or a trailing stop, and be cautious around earnings/news catalysts.
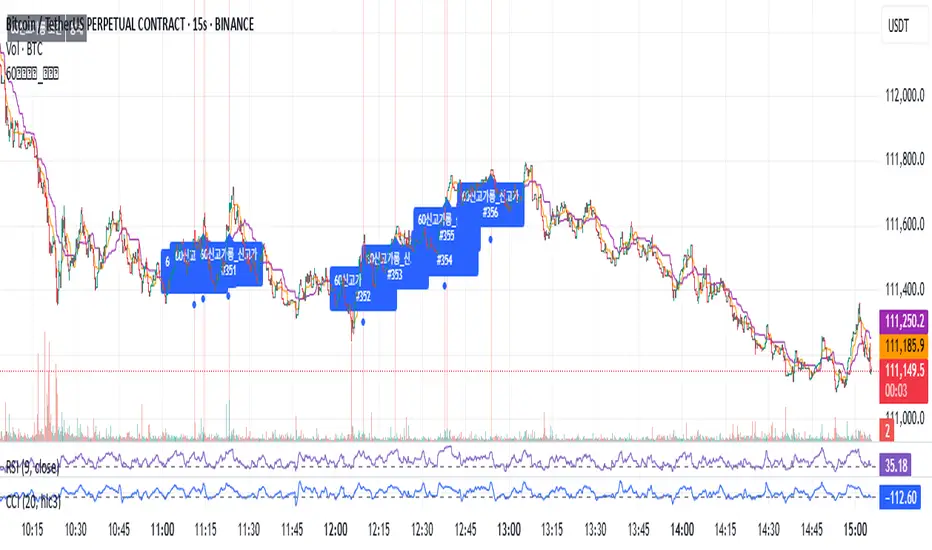
60 신고가 롱_신고가“60-Day New High Long (New High)” is a momentum breakout setup that buys when price prints a fresh 60-day high, expecting continuation once resistance gives way.
Enter on the breakout close (or next open) with confirmation such as expanding volume, relative strength vs. a benchmark, and price above the 50/200-day MAs.
Manage risk with a stop below the recent swing low or 20-day low; take profits via ATR-based targets or a trailing stop, and be cautious around earnings/news catalysts.
60 신저가 숏_신저가“60-Day New Low Short (New Low)” is a momentum breakdown setup that sells short when price prints a fresh 60-day low, aiming to ride continued weakness after support fails.
Enter on the breakdown close (or next open) with confirmation such as expanding volume, relative weakness vs. a benchmark, and price below the 50/200-day MAs.
Manage risk with a stop above the recent swing high or 20-day high; take profits via ATR-based targets or a trailing stop, and be cautious around earnings/news catalysts.

60 신고가 롱“60-Day New High Long” is a momentum breakout strategy that buys when price makes a fresh 60-day high, expecting continuation after resistance gives way.
Enter on the breakout close (or next open) with confirmation such as expanding volume, relative strength vs. a benchmark, and price above the 50/200-day MAs.
Manage risk with a stop below the recent swing low or 20-day low; take profits via ATR-based targets or a trailing stop, and be cautious around binary catalysts (earnings/news).

60 신저가 숏“60-Day New Low Short” is a momentum breakdown setup that sells short when price prints a fresh 60-day low, betting that failed support will extend the downtrend.
Entries are usually taken on the breakdown close (or next open) with confirmation like rising volume, relative weakness, and price below the 50/200-day MAs.
Manage risk with a stop above the recent swing high or 20-day high; take profits via ATR-based targets or a trailing stop, and avoid trades near major catalysts (earnings/news).

EMA20/50/200 + RSI Swing (Trend Filter)Using three different MA to identify the trend and enter when RSI under 70 or over 30

SMA compression goal is to identify when the 20/50/200 SMA are with in a certain % of each other. ideally finding consolidation

Nifty50 Swing Trading Super Indicator# 🚀 Nifty50 Swing Trading Super Indicator - Complete Guide
**Created by:** Gaurav
**Date:** August 8, 2025
**Version:** 1.0 - Optimized for Indian Markets
---
## 📋 Table of Contents
1. (#quick-start-guide)
2. (#indicator-overview)
3. (#installation-instructions)
4. (#parameter-settings)
5. (#signal-interpretation)
6. (#trading-strategy)
7. (#risk-management)
8. (#optimization-tips)
9. (#troubleshooting)
---
## 🎯 Quick Start Guide
### What You Get
✅ **2 Complete Pine Script Indicators:**
- `swing_trading_super_indicator.pine` - Universal version for all markets
- `nifty_optimized_super_indicator.pine` - Specifically optimized for Nifty50 & Indian stocks
✅ **Key Features:**
- Multi-component signal confirmation system
- Optimized for daily and 3-hour timeframes
- Built-in risk management with dynamic stops and targets
- Real-time signal strength monitoring
- Gap analysis for Indian market characteristics
### Immediate Setup
1. Copy the Pine Script code from `nifty_optimized_super_indicator.pine`
2. Paste into TradingView Pine Editor
3. Add to chart on daily or 3-hour timeframe
4. Look for 🚀BUY and 🔻SELL signals
5. Use the information table for signal confirmation
---
## 🔍 Indicator Overview
### Core Components Integration
**🎯 Range Filter (35% Weight)**
- Primary trend identification using adaptive volatility filtering
- Optimized sampling period: 21 bars for Indian market volatility
- Enhanced range multiplier: 3.0 to handle market gaps
- Provides trend direction and strength measurement
**⚡ PMAX (30% Weight)**
- Volatility-adjusted trend confirmation using ATR-based calculations
- Dynamic multiplier adjustment based on market volatility
- 14-period ATR with 2.5 multiplier for swing trading sensitivity
- Offers trailing stop functionality
**🏗️ Support/Resistance (20% Weight)**
- Dynamic level identification using pivot point analysis
- Tighter channel width (3%) for precise Indian market levels
- Enhanced strength calculation with historical interaction weighting
- Provides entry/exit timing and breakout signals
**📊 EMA Alignment (15% Weight)**
- Multi-timeframe moving average confirmation
- Key EMAs: 9, 21, 50, 200 (popular in Indian markets)
- Hierarchical alignment scoring for trend strength
- Additional trend validation layer
### Advanced Features
**🌅 Gap Analysis**
- Automatic detection of significant price gaps (>2%)
- Gap strength measurement and impact on signals
- Specific optimization for Indian market overnight gaps
- Visual gap markers on chart
**⏰ Multi-Timeframe Integration**
- Higher timeframe bias from daily/weekly data
- Configurable daily bias weight (default 70%)
- 3-hour confirmation for precise entry timing
- Prevents counter-trend trades against major timeframe
**🛡️ Risk Management**
- Dynamic stop-loss calculation using multiple methods
- Automatic profit target identification
- Position sizing guidance based on signal strength
- Anti-whipsaw logic to prevent false signals
---
## 📥 Installation Instructions
### Step 1: Access TradingView
1. Open TradingView.com
2. Navigate to Pine Editor (bottom panel)
3. Create a new indicator
### Step 2: Copy the Code
**For Nifty50 & Indian Stocks (Recommended):**
```pinescript
// Copy entire content from nifty_optimized_super_indicator.pine
```
**For Universal Use:**
```pinescript
// Copy entire content from swing_trading_super_indicator.pine
```
### Step 3: Configure and Apply
1. Click "Add to Chart"
2. Select daily or 3-hour timeframe
3. Adjust parameters if needed (defaults are optimized)
4. Enable alerts for signal notifications
### Step 4: Verify Installation
- Check that all components are visible
- Confirm information table appears in top-right
- Test with known trending stocks for signal validation
---
## ⚙️ Parameter Settings
### 🎯 Range Filter Settings
```
Sampling Period: 21 (optimized for Indian market volatility)
Range Multiplier: 3.0 (handles overnight gaps effectively)
Source: Close (most reliable for swing trading)
```
### ⚡ PMAX Settings
```
ATR Length: 14 (standard for daily/3H timeframes)
ATR Multiplier: 2.5 (balanced for swing trading sensitivity)
Moving Average Type: EMA (responsive to price changes)
MA Length: 14 (matches ATR period for consistency)
```
### 🏗️ Support/Resistance Settings
```
Pivot Period: 8 (shorter for Indian market dynamics)
Channel Width: 3% (tighter for precise levels)
Minimum Strength: 3 (higher quality levels only)
Maximum Levels: 4 (focus on strongest levels)
Lookback Period: 150 (sufficient historical data)
```
### 🚀 Super Indicator Settings
```
Signal Sensitivity: 0.65 (balanced for swing trading)
Trend Strength Requirement: 0.75 (high quality signals)
Gap Threshold: 2.0% (significant gap detection)
Daily Bias Weight: 0.7 (strong higher timeframe influence)
```
### 🎨 Display Options
```
Show Range Filter: ✅ (trend visualization)
Show PMAX: ✅ (trailing stops)
Show S/R Levels: ✅ (key price levels)
Show Key EMAs: ✅ (trend confirmation)
Show Signals: ✅ (buy/sell alerts)
Show Trend Background: ✅ (visual trend state)
Show Gap Markers: ✅ (gap identification)
```
---
## 📊 Signal Interpretation
### 🚀 BUY Signals
**Requirements for BUY Signal:**
- Price above Range Filter with upward trend
- PMAX showing bullish direction (MA > PMAX line)
- Support/resistance breakout or favorable positioning
- EMA alignment supporting upward movement
- Higher timeframe bias confirmation
- Overall signal strength > 75%
**Signal Strength Indicators:**
- **90-100%:** Extremely strong - Maximum position size
- **80-89%:** Very strong - Large position size
- **75-79%:** Strong - Standard position size
- **65-74%:** Moderate - Reduced position size
- **<65%:** Weak - Wait for better opportunity
### 🔻 SELL Signals
**Requirements for SELL Signal:**
- Price below Range Filter with downward trend
- PMAX showing bearish direction (MA < PMAX line)
- Resistance breakdown or unfavorable positioning
- EMA alignment supporting downward movement
- Higher timeframe bias confirmation
- Overall signal strength > 75%
### ⚖️ NEUTRAL Signals
**Characteristics:**
- Conflicting signals between components
- Low overall signal strength (<65%)
- Range-bound market conditions
- Wait for clearer directional bias
### 📈 Information Table Guide
**Component Status:**
- **BULL/BEAR:** Current signal direction
- **Strength %:** Component contribution strength
- **Status:** Additional context (STRONG/WEAK/ACTIVE/etc.)
**Overall Signal:**
- **🚀 STRONG BUY:** All systems aligned bullish
- **🔻 STRONG SELL:** All systems aligned bearish
- **⚖️ NEUTRAL:** Mixed or weak signals
---
## 💼 Trading Strategy
### Daily Timeframe Strategy
**Setup:**
1. Apply indicator to daily chart of Nifty50 or Indian stocks
2. Wait for 🚀BUY or 🔻SELL signal with >75% strength
3. Confirm higher timeframe bias alignment
4. Check for significant support/resistance levels
**Entry:**
- Enter on signal bar close or next bar open
- Use 3-hour chart for precise entry timing
- Avoid entries during major news events
- Consider gap analysis for overnight positions
**Position Sizing:**
- **>90% Strength:** 3-4% of portfolio
- **80-89% Strength:** 2-3% of portfolio
- **75-79% Strength:** 1-2% of portfolio
- **<75% Strength:** Avoid or minimal size
### 3-Hour Timeframe Strategy
**Setup:**
1. Confirm daily timeframe bias first
2. Apply indicator to 3-hour chart
3. Look for signals aligned with daily trend
4. Use for entry/exit timing optimization
**Entry Refinement:**
- Wait for 3H signal confirmation
- Enter on pullbacks to key levels
- Use tighter stops for better risk/reward
- Monitor intraday support/resistance
### Risk Management Rules
**Stop Loss Placement:**
1. **Primary:** Use indicator's dynamic stop level
2. **Secondary:** Below/above nearest support/resistance
3. **Maximum:** 2-3% of portfolio per trade
4. **Trailing:** Move stops with PMAX line
**Profit Taking:**
1. **Target 1:** First resistance/support level (50% position)
2. **Target 2:** Second resistance/support level (30% position)
3. **Runner:** Trail remaining 20% with PMAX
**Position Management:**
- Review positions at daily close
- Adjust stops based on new signals
- Exit if trend changes to opposite direction
- Reduce size during high volatility periods
---
## 🎯 Optimization Tips
### For Nifty50 Trading
- Use daily timeframe for primary signals
- Monitor sector rotation impact
- Consider index futures for better liquidity
- Watch for RBI policy and global cues impact
### For Individual Stocks
- Verify stock follows Nifty correlation
- Check sector-specific news and events
- Ensure adequate liquidity for position size
- Monitor earnings calendar for volatility
### Market Condition Adaptations
**Trending Markets:**
- Increase position sizes for strong signals
- Use wider stops to avoid whipsaws
- Focus on trend continuation signals
- Reduce counter-trend trading
**Range-Bound Markets:**
- Reduce position sizes
- Use tighter stops and quicker profits
- Focus on support/resistance bounces
- Increase signal strength requirements
**High Volatility Periods:**
- Reduce overall exposure
- Use smaller position sizes
- Increase stop-loss distances
- Wait for clearer signals
### Performance Monitoring
- Track win rate and average profit/loss
- Monitor signal quality over time
- Adjust parameters based on market changes
- Keep trading journal for pattern recognition
---
## 🔧 Troubleshooting
### Common Issues
**Q: Signals appear too frequently**
A: Increase "Trend Strength Requirement" to 0.8-0.9
**Q: Missing obvious trends**
A: Decrease "Signal Sensitivity" to 0.5-0.6
**Q: Too many false signals**
A: Enable "3H Confirmation" and increase strength requirements
**Q: Indicator not loading**
A: Check Pine Script version compatibility (requires v5)
### Parameter Adjustments
**For More Sensitive Signals:**
- Decrease Signal Sensitivity to 0.5-0.6
- Decrease Trend Strength Requirement to 0.6-0.7
- Increase Range Filter multiplier to 3.5-4.0
**For More Conservative Signals:**
- Increase Signal Sensitivity to 0.7-0.8
- Increase Trend Strength Requirement to 0.8-0.9
- Enable all confirmation features
### Performance Issues
- Reduce lookback periods if chart loads slowly
- Disable some visual elements for better performance
- Use on liquid stocks/indices for best results
---
## 📞 Support & Updates
This super indicator combines the best of Range Filter, PMAX, and Support/Resistance analysis specifically optimized for Indian market swing trading. The multi-component approach significantly improves signal quality while the built-in risk management features help protect capital.
**Remember:** No indicator is 100% accurate. Always combine with proper risk management, market analysis, and your trading experience for best results.
**Happy Trading! 🚀**

Razor Precision — Buy/SellRazor Precision Stock Action Indicator
The Razor Precision indicator is an advanced, multi-layered market analysis tool designed for traders who demand accuracy and alignment across multiple timeframes. It combines price action, moving average crossovers, volume confirmation, swing structure mapping, and indicator confluence (RSI, MACD, ATR, OBV) to generate actionable buy/sell strength ratings.
Key Features:
Price Action Detection: Identifies higher highs/lows (uptrend) and lower highs/lows (downtrend).
MA Crossover Momentum: Monitors 50/200 moving average crossovers to detect trend shifts.
Volume Surge Analysis: Confirms breakouts or pullbacks with significant volume spikes.
Swing Structure Tracking: Maps internal/external breaks to align with Smart Money Concepts.
Indicator Confluence: Aggregates signals from RSI, MACD, ATR, and OBV for precision confirmation.
Multi-Timeframe Alignment: Compares trends across 15m, 1H, 4H, and Daily charts for stacked or conflicting signals.
Strength Levels: Signals range from SELL, STRONG SELL, ULTRA STRONG SELL to BUY, STRONG BUY, ULTRA STRONG BUY.
Dynamic Table Display: Updates every 5 minutes or when overall action changes, showing per-timeframe analysis and the aggregated decision.
Ideal for swing traders, scalpers, and intraday momentum players who want high-confidence trade direction filtered through multiple technical layers.

Ayman Entry Signal – Ultimate PRO (Scalping Gold Settings)1. Overview
This indicator is a professional gold scalping tool built for TradingView using Pine Script v6.
It combines multiple price action and technical filters to generate high-probability Buy/Sell signals with built-in trade management features (TP1, TP2, SL, Break Even, Partial Close, Stats tracking).
It is optimized for XAUUSD but can be applied to other assets with proper setting adjustments.
2. Key Features
Multi-Condition Trade Signals – EMA trend, Break of Structure, Order Blocks, FVG, Liquidity Sweeps, Pin Bars, Higher Timeframe confirmation, Trend Cloud, SMA Cross, and ADX.
Full Trade Management – Auto-calculates lot size, SL, TP1, TP2, Break Even, Partial Close.
Dynamic Chart Drawing – Entry lines, SL/TP lines, trade boxes, and real-time PnL.
Statistics Panel – Tracks wins, losses, breakeven trades, and total PnL over selected dates.
Customizable Filters – All filters can be turned ON/OFF to match your strategy.
3. Main Inputs & Settings
Account Settings
Capital ($) – Total trading capital.
Risk Percentage (%) – Risk per trade.
TP to SL Ratio – Risk-to-reward ratio.
Value Per Point ($) – Value per pip/point for lot size calculation.
SL Buffer – Extra points added to SL to avoid stop hunts.
Take Profit Settings
TP1 % of Full Target – Fraction of TP1 compared to TP2.
Move SL to Entry after TP1? – Activates Break Even after TP1.
Break Even Buffer – Extra points when moving SL to BE.
Take Partial Close at TP1 – Option to close half at TP1.
Signal Filters
ATR Period – For SL/TP calculation buffer.
EMA Trend – Uses EMA 9/21 crossover for trend.
Break of Structure (BoS) – Requires structure break confirmation.
Order Block (OB) – Validates trades within OB zones.
Fair Value Gap (FVG) – Confirms trades inside FVGs.
Liquidity Sweep – Checks if liquidity zones are swept.
Pin Bar Confirmation – Uses candlestick patterns for extra confirmation.
Pin Bar Body Ratio – Controls strictness of Pin Bar filter.
Higher Timeframe Filters (HTF)
HTF EMA Confirmation – Confirms lower timeframe trades with higher timeframe trend.
HTF BoS – Confirms with higher timeframe structure break.
HTF Timeframe – Selects higher timeframe.
Advanced Filters
SuperTrend Filter – Confirms trades based on SuperTrend.
ADX Filter – Filters out low volatility periods.
SMA Cross Filter – Uses SMA 8/9 cross as filter.
Trend Cloud Filter – Uses EMA 50/200 as a cloud trend filter.
4. How It Works
Buy Signal Conditions
EMA 9 > EMA 21 (trend bullish)
Optional filters (BoS, OB, FVG, Liquidity Sweep, Pin Bar, HTF confirmations, ADX, SMA Cross, Trend Cloud) must pass if enabled.
When all active filters pass → Buy signal triggers.
Sell Signal Conditions
EMA 9 < EMA 21 (trend bearish)
Same filtering process but for bearish conditions.
When all active filters pass → Sell signal triggers.
5. Trade Execution & Management
When a signal triggers:
Lot size is auto-calculated based on risk % and SL distance.
SL is placed beyond recent swing high/low + ATR buffer.
TP1 and TP2 are calculated from the SL using the reward-to-risk ratio.
Break Even: If enabled, SL moves to entry price after TP1 is hit.
Partial Close: If enabled, half of the position closes at TP1.
Trade Exit: Full exit at TP2, SL hit, or partial close at TP1.
6. Chart Display
Entry Line – Shows entry price.
SL Line – Red dashed line at stop loss level.
TP1 Line – Lime dashed line for TP1.
TP2 Line – Green dashed line for TP2.
PnL Labels – Displays real-time profit/loss in $.
Trade Box – Visual area showing trade range.
Pin Bar Shapes – Optional, marks Pin Bars.
7. Statistics Panel
Stats Header – Shows “Stats”.
Total Trades
Wins
Losses
Breakeven Trades
Total PnL
Can be reset or filtered by date.
8. How to Use
Load the Indicator in TradingView.
Select Gold (XAUUSD) on your preferred scalping timeframe (1m, 5m, 15m).
Adjust settings:
Use default gold scalping settings for quick start.
Enable/disable filters according to your style.
Wait for a Buy/Sell alert.
Confirm visually that all desired conditions align.
Place trade with calculated lot size, SL, and TP levels shown on chart.
Let trade run – the indicator manages Break Even & Partial Close if enabled.
9. Recommended Timeframes
Scalping: 1m, 5m, 15m
Day Trading: 15m, 30m, 1H
Swing: 4H, Daily (adjust settings accordingly)

Confluence Indicator: Fib, MACD, SMA 50/200This is a scalping indicator best used on the 1hour and 15min charts

Liquidity Zones, EMAs, Market Cipher BAll In One, market cipher b, divergences, ema 12/21/50/200, and liquidity zones

Neuracap Gap AnalysisThe Neuracap Gap Analysis indicator is a comprehensive tool designed to identify and track price gaps, special candlestick patterns, and high-volume breakout signals. It combines multiple trading strategies into one powerful indicator for gap trading, pattern recognition, and momentum analysis.
🎯 What This Indicator Does
1. Gap Detection & Tracking
Automatically identifies price gaps (up and down)
Tracks gap fills with visual boxes that extend until closed
Manages gap history with customizable limits
Color-coded visualization (Green = Gap Up, Red = Gap Down)
2. Upside Tasuki Gap Pattern
Identifies the bullish continuation pattern
Colors candles yellow when pattern is detected
Confirms trend continuation signals
3. Episodic Pivot Detection
High-volume breakout identification
EMA filter ensures signals only in uptrends
Strong momentum confirmation
Fuchsia-colored candles with arrow markers
🔍 How to Use for Trading
📈 Gap Trading Strategy
Gap Up Trading:
Wait for gap up (green box appears)
Check volume - Higher volume = stronger signal
Entry options:
Aggressive: Enter at market open
Conservative: Wait for pullback to gap level
Stop loss: Below the gap fill level
Target: Previous resistance or 2:1 risk/reward
Gap Down Trading:
Identify gap down (red box appears)
Look for bounce opportunities
Entry: When price shows reversal signs
Stop: Below recent lows
Target: Gap fill level
💫 Tasuki Gap Strategy
Yellow candle indicates bullish continuation
Confirms uptrend is likely to continue
Entry: On next candle after pattern
Stop: Below the gap low
Target: Next resistance level
🚀 Episodic Pivot Strategy
Fuchsia candle + arrow = High probability breakout
All conditions met:
Price above EMA 20, 50, 200
High volume (2x+ average)
Strong price move (4%+)
Entry: At close or next open
Stop: Below EMA 20 or recent swing low
Target: Measured move or next resistance
📊 Reading the Visual Signals
Gap Boxes
🟢 Green Box: Gap up - potential bullish continuation
🔴 Red Box: Gap down - potential bounce or bearish continuation
Box extends until gap is filled
Box disappears when gap closes
Candle Colors
🟡 Yellow: Tasuki gap pattern (bullish continuation)
🟪 Fuchsia: Episodic pivot (high-volume breakout)
⬜ Normal: No special pattern detected
Arrows & Markers
⬆️ Triangle Arrow: Episodic pivot confirmation
💡 Trading Tips & Best Practices
✅ Do's
Combine with trend analysis - Trade gaps in direction of trend
Check volume - Higher volume = more reliable signals
Use multiple timeframes - Confirm on higher timeframes
Risk management - Always set stop losses
Wait for confirmation - Don't chase, let signals develop
❌ Don'ts
Don't trade all gaps - Focus on high-quality setups
Avoid low volume - Weak volume = unreliable signals
Don't ignore trend - Counter-trend trading is risky
Don't overtrade - Quality over quantity
Don't ignore context - Consider market conditions
⚠️ Risk Management
Position sizing: Risk 1-2% per trade
Stop losses: Always define before entry
Target levels: Set realistic profit targets
Market conditions: Avoid trading in choppy markets
📈 Performance Optimization
For Conservative Traders:
Increase minimum gap size to 1%
Set volume multiplier to 3.0x
Only trade episodic pivots in strong uptrends
Wait for gap fill confirmation
For Aggressive Traders:
Decrease minimum gap size to 0.3%
Set volume multiplier to 1.5x
Trade both gap types
Enter on pattern confirmation
🚨 Alert Setup
The indicator provides alerts for:
Gap Up Detected
Gap Down Detected
Upside Tasuki Gap
Episodic Pivot
Recommended: Enable all alerts and filter manually based on your strategy.
📝 Summary
This indicator excels at identifying high-probability trading opportunities through gap analysis, pattern recognition, and momentum confirmation. Use it as part of a complete trading system with proper risk management for best results.

Volume Spike Analyzer(SMA10-Based)📊 **Volume Spike Analyzer (SMA10-Based)**
This indicator highlights abnormal volume activity by comparing current volume to the 10-period Simple Moving Average (SMA) of volume. It helps traders visually identify unusual activity that may precede breakouts, reversals, or news-driven moves.
---
🔧 **Features:**
• ✅ Colors volume bars:
• Green = Volume > SMA(10)
• Red = Volume ≤ SMA(10)
• ✅ Detects and labels spike levels:
• 🔶2x — Volume > 2x SMA(10)
• 🟢3x — Volume > 3x SMA(10)
• 🔴4x — Volume > 4x SMA(10)
• ✅ Built-in alerts for all 3 spike levels
---
📈 **Best Use Cases:**
• Confirm breakouts with strong volume
• Detect accumulation/distribution
• Filter low-volume setups
• Combine with VWAP/EMA for directional confirmation
---
⏱️ **Recommended Timeframes:**
• Intraday: 5m, 15m, 1h
• Also works on daily for swing trades
---
🧠 **Pro Tips:**
• Use with VWAP or EMA(20/50/200) for confluence
• Add SMA(Volume, 10) to your price chart for quick correlation
• Combine with candle pattern detection for signal validation
---
