Supertrend and Fast and Slow EMA StrategyThis strategy combines Exponential Moving Averages (EMAs) and Average True Range (ATR) to create a simple, yet effective, trend-following approach. The strategy filters out fake or sideways signals by incorporating the ATR as a volatility filter, ensuring that trades are only taken during trending conditions. The key idea is to buy when the short-term trend (Fast EMA) aligns with the long-term trend (Slow EMA), and to avoid trades during low volatility periods.
How It Works:
EMA Crossover:
1). Buy Signal: When the Fast EMA (shorter-term, e.g., 20-period) crosses above the Slow EMA (longer-term, e.g., 50-period), this indicates a potential uptrend.
2). Sell Signal: When the Fast EMA crosses below the Slow EMA, this indicates a potential downtrend.
ATR Filter:
1). The ATR (Average True Range) is used to measure market volatility.
2). Trending Market: If the ATR is above a certain threshold, it indicates high volatility and a trending market. Only when ATR is above the threshold will the strategy generate buy/sell signals.
3). Sideways Market: If ATR is low (sideways or choppy market), the strategy will suppress signals to avoid entering during non-trending conditions.
When to Buy:
1). Condition 1: The Fast EMA crosses above the Slow EMA.
2). Condition 2: The ATR is above the defined threshold, indicating that the market is trending (not sideways or choppy).
When to Sell:
1). Condition 1: The Fast EMA crosses below the Slow EMA.
2). Condition 2: The ATR is above the defined threshold, confirming that the market is in a downtrend.
When Not to Enter the Trade:
1). Sideways Market: If the ATR is below the threshold, signaling low volatility and sideways or choppy market conditions, the strategy will not trigger any buy or sell signals.
2). False Crossovers: In low volatility conditions, price action tends to be noisy, which could lead to false signals. Therefore, avoiding trades during these periods reduces the risk of false breakouts.
Additional Factors to Consider Adding:
=> RSI (Relative Strength Index): Adding an RSI filter can help confirm overbought or oversold conditions to avoid buying into overextended moves or selling too low.
1). RSI Buy Filter: Only take buy signals when RSI is below 70 (avoiding overbought conditions).
2). RSI Sell Filter: Only take sell signals when RSI is above 30 (avoiding oversold conditions).
=> MACD (Moving Average Convergence Divergence): Using MACD can help validate the strength of the trend.
1). Buy when the MACD histogram is above the zero line and the Fast EMA crosses above the Slow EMA.
2). Sell when the MACD histogram is below the zero line and the Fast EMA crosses below the Slow EMA.
=> Support/Resistance Levels: Adding support and resistance levels can help you understand market structure and decide whether to enter or exit a trade.
1). Buy when price breaks above a significant resistance level (after a valid buy signal).
2). Sell when price breaks below a major support level (after a valid sell signal).
=> Volume: Consider adding a volume filter to ensure that buy/sell signals are supported by strong market participation. You could only take signals if the volume is above the moving average of volume over a certain period.
=> Trailing Stop Loss: Instead of a fixed stop loss, use a trailing stop based on a percentage or ATR to lock in profits as the trade moves in your favor.
=> Exit Signals: Besides the EMA crossover, consider adding Take Profit or Stop Loss levels, or even using a secondary indicator like RSI to signal an overbought/oversold condition and exit the trade.
Example Usage:
=> Buy Example:
1). Fast EMA (20-period) crosses above the Slow EMA (50-period).
2). The ATR is above the threshold, confirming that the market is trending.
3). Optionally, if RSI is below 70, the buy signal is further confirmed as not being overbought.
=> Sell Example:
1). Fast EMA (20-period) crosses below the Slow EMA (50-period).
2). The ATR is above the threshold, confirming that the market is trending.
3). Optionally, if RSI is above 30, the sell signal is further confirmed as not being oversold.
Conclusion:
This strategy helps to identify trending markets and filters out sideways or choppy market conditions. By using Fast and Slow EMAs combined with the ATR volatility filter, it provides a reliable approach to catching trending moves while avoiding false signals during low-volatility, sideways markets.
스크립트에서 "北证50+股票+新浪财经"에 대해 찾기

SuperTrend AI Oscillator StrategySuperTrend AI Oscillator Strategy
Overview
This strategy is a trend-following approach that combines the SuperTrend indicator with oscillator-based filtering.
By identifying market trends while utilizing oscillator-based momentum analysis, it aims to improve entry precision.
Additionally, it incorporates a trailing stop to strengthen risk management while maximizing profits.
This strategy can be applied to various markets, including Forex, Crypto, and Stocks, as well as different timeframes. However, its effectiveness varies depending on market conditions, so thorough testing is required.
Features
1️⃣ Trend Identification Using SuperTrend
The SuperTrend indicator (a volatility-adjusted trend indicator based on ATR) is used to determine trend direction.
A long entry is considered when SuperTrend turns bullish.
A short entry is considered when SuperTrend turns bearish.
The goal is to capture clear trend reversals and avoid unnecessary trades in ranging markets.
2️⃣ Entry Filtering with an Oscillator
The Super Oscillator is used to filter entry signals.
If the oscillator exceeds 50, it strengthens long entries (indicating strong bullish momentum).
If the oscillator drops below 50, it strengthens short entries (indicating strong bearish momentum).
This filter helps reduce trades in uncertain market conditions and improves entry accuracy.
3️⃣ Risk Management with a Trailing Stop
Instead of a fixed stop loss, a SuperTrend-based trailing stop is implemented.
The stop level adjusts automatically based on market volatility.
This allows profits to run while managing downside risk effectively.
4️⃣ Adjustable Risk-Reward Ratio
The default risk-reward ratio is set at 1:2.
Example: A 1% stop loss corresponds to a 2% take profit target.
The ratio can be customized according to the trader’s risk tolerance.
5️⃣ Clear Trade Signals & Visual Support
Green "BUY" labels indicate long entry signals.
Red "SELL" labels indicate short entry signals.
The Super Oscillator is plotted in a separate subwindow to visually assess trend strength.
A real-time trailing stop is displayed to support exit strategies.
These visual aids make it easier to identify entry and exit points.
Trading Parameters & Considerations
Initial Account Balance: Default is $7,000 (adjustable).
Base Currency: USD
Order Size: 10,000 USD
Pyramiding: 1
Trading Fees: $0.94 per trade
Long Position Margin: 50%
Short Position Margin: 50%
Total Trades (M5 Timeframe): 1,032
Visual Aids for Clarity
This strategy includes clear visual trade signals to enhance decision-making:
Green "BUY" labels for long entries
Red "SELL" labels for short entries
Super Oscillator plotted in a subwindow with a 50 midline
Dynamic trailing stop displayed for real-time trend tracking
These visual aids allow traders to quickly identify trade setups and manage positions with greater confidence.
Summary
The SuperTrend AI Oscillator Strategy is developed based on indicators from Black Cat and LuxAlgo.
By integrating high-precision trend analysis with AI-based oscillator filtering, it provides a strong risk-managed trading approach.
Important Notes
This strategy does not guarantee profits—performance varies based on market conditions.
Past performance does not guarantee future results. Markets are constantly changing.
Always test extensively with backtesting and demo trading before using it in live markets.
Risk management, position sizing, and market conditions should always be considered when trading.
Conclusion
This strategy combines trend analysis with momentum filtering, enhancing risk management in trading.
By following market trends carefully, making precise entries, and using trailing stops, it seeks to reduce risk while maximizing potential profits.
Before using this strategy, be sure to test it thoroughly via backtesting and demo trading, and adjust the settings to match your trading style.

Ultimate Trading BotHow the "Ultimate Trading Bot" Works:
This Pine Script trading bot executes buy and sell trades based on a combination of technical indicators:
Indicators Used:
RSI (Relative Strength Index)
Measures momentum and determines overbought (70) and oversold (30) levels.
A crossover above 30 suggests a potential buy, and a cross below 70 suggests a potential sell.
Moving Average (MA)
A simple moving average (SMA) of 50 periods to track the trend.
Prices above the MA indicate an uptrend, while prices below indicate a downtrend.
Stochastic Oscillator (%K and %D)
Identifies overbought and oversold conditions using a smoothed stochastic formula.
A crossover of %K above %D signals a buy, and a crossover below %D signals a sell.
MACD (Moving Average Convergence Divergence)
Uses a 12-period fast EMA and a 26-period slow EMA, with a 9-period signal line.
A crossover of MACD above the signal line suggests a bullish move, and a cross below suggests bearish movement.
Trade Execution:
Buy (Long Entry) Conditions:
RSI crosses above 30 (indicating recovery from an oversold state).
The closing price is above the 50-period moving average (showing an uptrend).
The MACD line crosses above the signal line (indicating upward momentum).
The Stochastic %K crosses above %D (indicating bullish momentum).
→ If all conditions are met, the bot enters a long (buy) position.
Sell (Exit Trade) Conditions:
RSI crosses below 70 (indicating overbought conditions).
The closing price is below the 50-period moving average (downtrend).
The MACD line crosses below the signal line (bearish signal).
The Stochastic %K crosses below %D (bearish momentum).
→ If all conditions are met, the bot closes the long position.
Visuals:
The bot plots the moving average, RSI, MACD, and Stochastic indicators for reference.
It also displays buy/sell signals with arrows:
Green arrow (Buy Signal) → When all buy conditions are met.
Red arrow (Sell Signal) → When all sell conditions are met.
How to Use It in TradingView:

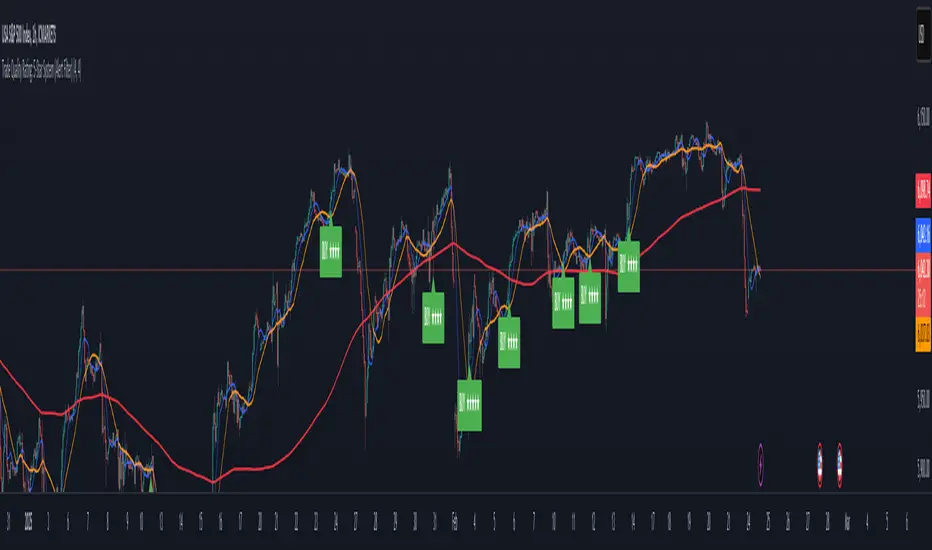
Trade Quality Rating: signal rating from 1 to 5 starsOverview
The indicator is built to generate trading signals based on a combination of technical indicators and then assign each signal a quality rating from 1 to 5 stars. The idea is that the more filters that are met, the stronger (or higher quality) the signal is assumed to be. You can then use these quality ratings to decide which signals to act upon, keeping in mind that a higher-rated signal has more confirming factors.
Components of the Indicator
Simple Moving Averages (SMAs):
SMA9 and SMA20:
These two moving averages are used to detect short-term trend changes via crossovers. A bullish signal is generated when the SMA9 crosses above the SMA20, and a bearish signal when it crosses below.
SMA200 (on the current timeframe) & Daily SMA200:
The SMA200 on your current chart helps smooth out the price action.
The Daily SMA200 serves as a long-term trend filter. For a valid long signal, the price must be above the Daily SMA200, and vice versa for a short signal.
MACD (Moving Average Convergence Divergence):
The MACD is calculated using standard parameters (12, 26, 9).
It adds momentum confirmation to the signal. For a long trade, the MACD line should be above its signal line, and for a short trade, below.
RSI (Relative Strength Index):
Calculated with a 14-period setting.
For long signals, the RSI must be above 50 (indicating upward momentum), while for short signals, it should be below 50.
This filter is one of the additional conditions that add to the quality rating.
Volume Filter:
A 20-period moving average of volume is computed.
The current volume must exceed this average, suggesting that there is enough market participation backing the move.
This is another extra filter that adds to the overall quality score.
ADX (Average Directional Index):
The ADX is manually calculated in the script (using a 14-period setting) to gauge the strength of the trend.
A value above 25 is considered to confirm that a strong trend is in place, making the signal more reliable.
VWAP (Volume Weighted Average Price):
The session VWAP is computed on a daily basis.
For long trades, the price should be above the VWAP, and for short trades, below.
This serves as a confirmation that the current price is moving in the right direction relative to the volume-weighted average.
Signal Generation and Quality Rating
Base Signal (1 Star):
The fundamental trade signal is generated when the SMA9/SMA20 crossover occurs, in combination with the MACD confirmation and the condition that the price is on the correct side of the Daily SMA200. This base signal provides a 1-star quality rating.
Additional Filters (Adding Extra Stars):
RSI Filter: Adds 1 extra star if the RSI condition is met (RSI > 50 for long or RSI < 50 for short).
Volume Filter: Adds 1 extra star if the current volume exceeds its 20-period moving average.
ADX Filter: Adds 1 extra star if the ADX value is above 25, confirming a strong trend.
VWAP Filter: Adds 1 extra star if the price is above the VWAP for long trades (or below for short trades).
When all filters are met, you get a 5-star rating (1 star base + 4 extra stars).
Display and Alerts:
The indicator plots your SMAs on the chart.
When a signal occurs, it places a label on the chart showing the trade direction ("BUY" or "SELL") along with the quality rating in stars.
Additionally, alert conditions are set up so that you can receive notifications when a valid signal (based on the base criteria) is generated.
How to Use This Indicator
Filtering Trades:
Use the quality rating as a visual guide. For instance, if you want to only act on the most reliable setups, you might decide to trade only signals that are rated 4 or 5 stars.
Manual Confirmation:
Even with a high star rating, you can perform your own final checks (e.g., checking price action or additional chart patterns) before entering a trade.
Backtesting and Adjustment:
Because market conditions differ, it’s advisable to backtest the indicator on your instrument of choice and adjust the parameters (such as the ADX threshold or the period for volume averaging) to better suit your trading style.
Conclusion
This 5-star system indicator is designed to provide a comprehensive overview of trade quality by integrating multiple technical filters into one visual signal. It helps filter out noise by ensuring that a trade signal not only meets a basic SMA and MACD condition but also aligns with volume, trend strength (ADX), and VWAP criteria. This multi-layered approach can lead to fewer but higher quality trades, allowing you to focus on setups that have more confluence.
Happy trading!
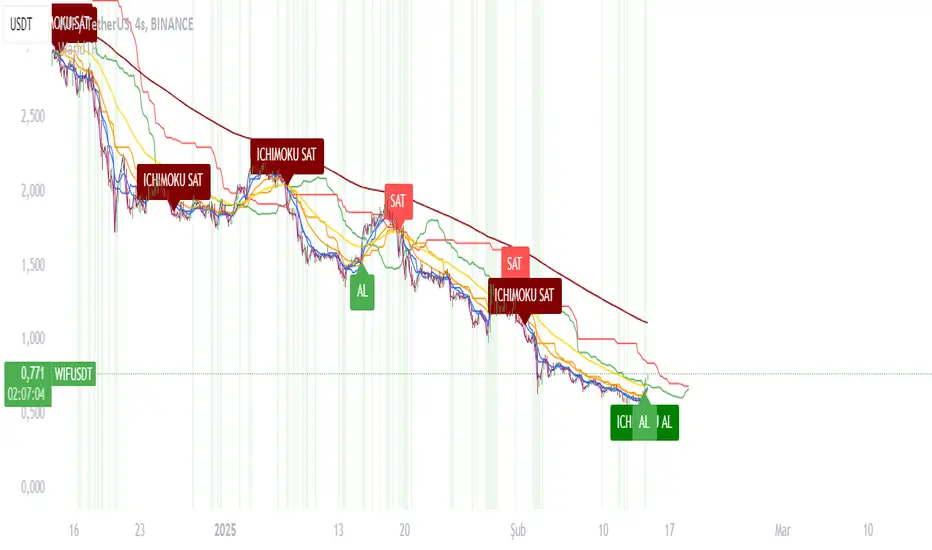
WaridTR15 Dakika ve Üzeri Periyotlar İçin Önerilen Ayarlar:
EMA Uzunlukları:
Kısa EMA: 9 yerine 12 veya 14 kullanılabilir.
Uzun EMA: 21 yerine 26 veya 50 kullanılabilir.
Golden Cross için 50 EMA ve 200 EMA zaten uzun vadeli trendleri yakalar, bu nedenle değiştirmeye gerek yok.
RSI Uzunluğu:
RSI uzunluğu 14 yerine 21 veya 28 yapılabilir. Bu, daha uzun vadeli aşırı alım/aşırı satım bölgelerini daha doğru tespit eder.
Volume Filtresi:
Volume ortalaması için 20 periyot yerine 50 veya 100 periyot kullanılabilir. Bu, daha uzun vadeli hacim eğilimlerini yakalar.
Ichimoku Parametreleri:
Ichimoku, varsayılan olarak 9-26-52 periyotlarıyla çalışır. Bu, zaten uzun vadeli trendleri yakalamak için uygundur. Ancak, daha uzun periyotlar için:
Tenkan-Sen: 9 yerine 14.
Kijun-Sen: 26 yerine 52.
Senkou Span B: 52 yerine 104.
Multi-Moving Average Buy/Sell IndicatorThis Multi-Moving Average Buy/Sell Indicator is a powerful and customizable tool designed to help traders identify potential buy and sell signals based on the interaction between price and multiple moving averages. Whether you're a day trader, swing trader, or long-term investor, this indicator provides clear visual cues and alerts to help you make informed trading decisions.
Key Features
1. Multiple Moving Averages
The indicator calculates four key moving averages:
9-period MA
20-period MA
50-period MA
180-period MA
You can choose the type of moving average:
SMA (Simple Moving Average)
EMA (Exponential Moving Average)
WMA (Weighted Moving Average)
2. Custom Timeframe
Select a custom timeframe from a user-friendly dropdown menu:
1 Minute
5 Minutes
15 Minutes
30 Minutes
1 Hour
4 Hours
Daily
Weekly
The indicator dynamically adjusts to the selected timeframe, making it suitable for all trading styles.
3. Buy/Sell Signals
Buy Signal: Triggered when the price crosses above any of the moving averages.
Sell Signal: Triggered when the price crosses below any of the moving averages.
Signals are displayed as labels on the chart:
Green "BUY" Label: Below the bar when a buy signal is triggered.
Red "SELL" Label: Above the bar when a sell signal is triggered.
4. Visualization
Toggle the visibility of all moving averages using the showAllMAs input.
Moving averages are plotted with distinct colors for easy identification:
9 MA: Blue
20 MA: Orange
50 MA: Purple
180 MA: Teal
5. Alerts
The indicator generates alerts for buy and sell signals, which can be used for notifications or automated trading.
How to Use
Add the Indicator:
Open TradingView and go to the Pine Script Editor.
Copy and paste the script into the editor.
Click Add to Chart.
Configure Inputs:
maType: Choose the type of moving average (SMA, EMA, WMA).
timeframe: Select a custom timeframe (e.g., "1 Minute", "Daily").
showSignals: Toggle to show or hide buy/sell signals.
showAllMAs: Toggle to show or hide all moving averages.
Interpret the Signals:
Look for green "BUY" labels below the bars for potential buy opportunities.
Look for red "SELL" labels above the bars for potential sell opportunities.
Set Alerts:
Use the built-in alert system to get notified when buy or sell signals are triggered.
Example Use Cases
Day Trading
Use a 1-minute or 5-minute timeframe with an EMA for quick signals.
Example Inputs:
maType = "EMA"
timeframe = "5 Minutes"
showAllMAs = true
Swing Trading
Use a daily timeframe with an SMA for longer-term signals.
Example Inputs:
maType = "SMA"
timeframe = "Daily"
showAllMAs = false
Why Use This Indicator?
Versatility: Suitable for all trading styles and timeframes.
Customization: Choose your preferred moving average type and timeframe.
Clear Signals: Easy-to-read buy/sell labels and moving averages.
Alerts: Never miss a trading opportunity with built-in alerts.
Limitations
False Signals:
The indicator may generate false signals in choppy or sideways markets. Always combine it with other tools (e.g., RSI, volume analysis) for better accuracy.
Timeframe Dependency:
The effectiveness of the signals depends on the selected timeframe. Shorter timeframes may produce more signals but with higher noise.
No Backtesting:
The script does not include backtesting functionality. Test the strategy manually on historical data.
Customization Options
Add More Moving Averages: Modify the script to include additional moving averages (e.g., 200 MA).
Change Signal Logic: Adjust the conditions for buy/sell signals (e.g., require confirmation from multiple moving averages).
Add Alerts for Specific MAs: Create separate alerts for signals based on specific moving averages (e.g., only 9 MA or 50 MA).

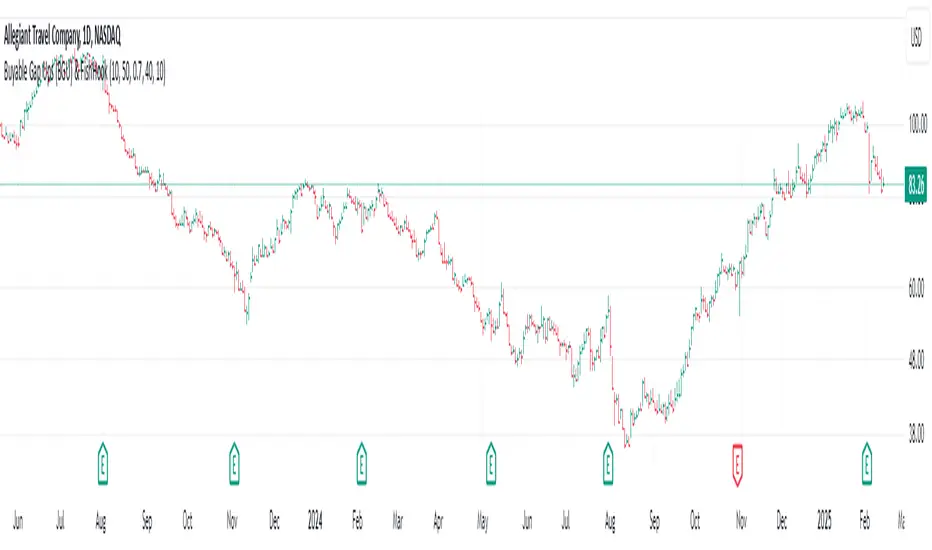
Buyable Gap Ups (BGU) ScreenerBuyable Gap Ups (BGU) Screener
This custom indicator detects Buyable Gap Ups (BGU), designed to identify stocks with significant price movements driven by gap-ups, often signaling strong bullish momentum. It helps traders spot potential opportunities where a stock has gapped up above the previous day's high with increased volume, suggesting the possibility of continued price strength.
Key Features:
Gap Percentage Threshold: Set a minimum gap percentage required for a valid buyable gap-up.
Volume Change Threshold: Identifies gap-ups accompanied by a significant increase in volume compared to the 50-day average.
ATR-Based Gap Detection (Optional): Use Average True Range (ATR) to determine whether the gap is large enough, factoring in recent volatility.
Customizable Lookback Period: Adjust the number of recent bars to track the frequency of BGU occurrences.
Volume Confirmation: Only signals buyable gaps when volume surpasses a defined threshold above the 50-day average.
Input Parameters:
Gap Percentage Threshold: Adjusts the minimum percentage gap for a valid signal.
Volume Change Threshold: Determines the minimum percentage increase in volume compared to the 50-day moving average.
Use ATR Gap: Option to use ATR to determine the minimum gap size instead of the percentage gap.
ATR Multiplier for Gap: Customizes the gap size based on the ATR.
ATR Length: Adjusts the lookback period for calculating ATR.
Lookback Period for BGU: Set the number of bars over which to calculate the BGU count.
Alerts & Signals:
The script will plot signals below bars where a valid BGU condition is met.
Alerts can be set for when a BGU is detected, giving real-time notifications for potential trading opportunities.
This indicator is designed to help traders find stocks showing strong bullish momentum, especially after earnings or other market-moving events, with the potential for continued uptrend. It is ideal for those looking to incorporate gap-based strategies in their trading.
Volatility Momentum Breakout StrategyDescription:
Overview:
The Volatility Momentum Breakout Strategy is designed to capture significant price moves by combining a volatility breakout approach with trend and momentum filters. This strategy dynamically calculates breakout levels based on market volatility and uses these levels along with trend and momentum conditions to identify trade opportunities.
How It Works:
1. Volatility Breakout:
• Methodology:
The strategy computes the highest high and lowest low over a defined lookback period (excluding the current bar to avoid look-ahead bias). A multiple of the Average True Range (ATR) is then added to (or subtracted from) these levels to form dynamic breakout thresholds.
• Purpose:
This method helps capture significant price movements (breakouts) while ensuring that only past data is used, thereby maintaining realistic signal generation.
2. Trend Filtering:
• Methodology:
A short-term Exponential Moving Average (EMA) is applied to determine the prevailing trend.
• Purpose:
Long trades are considered only when the current price is above the EMA, indicating an uptrend, while short trades are taken only when the price is below the EMA, indicating a downtrend.
3. Momentum Confirmation:
• Methodology:
The Relative Strength Index (RSI) is used to gauge market momentum.
• Purpose:
For long entries, the RSI must be above a mid-level (e.g., above 50) to confirm upward momentum, and for short entries, it must be below a similar threshold. This helps filter out signals during overextended conditions.
Entry Conditions:
• Long Entry:
A long position is triggered when the current closing price exceeds the calculated long breakout level, the price is above the short-term EMA, and the RSI confirms momentum (e.g., above 50).
• Short Entry:
A short position is triggered when the closing price falls below the calculated short breakout level, the price is below the EMA, and the RSI confirms momentum (e.g., below 50).
Risk Management:
• Position Sizing:
Trades are sized to risk a fixed percentage of account equity (set here to 5% per trade in the code, with each trade’s stop loss defined so that risk is limited to approximately 2% of the entry price).
• Stop Loss & Take Profit:
A stop loss is placed a fixed ATR multiple away from the entry price, and a take profit target is set to achieve a 1:2 risk-reward ratio.
• Realistic Backtesting:
The strategy is backtested using an initial capital of $10,000, with a commission of 0.1% per trade and slippage of 1 tick per bar—parameters chosen to reflect conditions faced by the average trader.
Important Disclaimers:
• No Look-Ahead Bias:
All breakout levels are calculated using only past data (excluding the current bar) to ensure that the strategy does not “peek” into future data.
• Educational Purpose:
This strategy is experimental and provided solely for educational purposes. Past performance is not indicative of future results.
• User Responsibility:
Traders should thoroughly backtest and paper trade the strategy under various market conditions and adjust parameters to fit their own risk tolerance and trading style before live deployment.
Conclusion:
By integrating volatility-based breakout signals with trend and momentum filters, the Volatility Momentum Breakout Strategy offers a unique method to capture significant price moves in a disciplined manner. This publication provides a transparent explanation of the strategy’s components and realistic backtesting parameters, making it a useful tool for educational purposes and further customization by the TradingView community.

SMA + RSI + Volume + ATR StrategySMA + RSI + Volume + ATR Strategy
1. Indicators Used:
SMA (Simple Moving Average): This is a trend-following indicator that calculates the average price of a security over a specified period (50 periods in this case). It's used to identify the overall trend of the market.
RSI (Relative Strength Index): This measures the speed and change of price movements. It tells us if the market is overbought (too high) or oversold (too low). Overbought is above 70 and oversold is below 30.
Volume: This is the amount of trading activity. A higher volume often indicates strong interest in a particular price move.
ATR (Average True Range): This measures volatility, or how much the price is moving in a given period. It helps us adjust stop losses and take profits based on market volatility.
2. Conditions for Entering Trades:
Buy Signal (Green Up Arrow):
Price is above the 50-period SMA (indicating an uptrend).
RSI is below 30 (indicating the market might be oversold or undervalued, signaling a potential reversal).
Current volume is higher than average volume (indicating strong interest in the move).
ATR is increasing (indicating higher volatility, suggesting that the market might be ready for a move).
Sell Signal (Red Down Arrow):
Price is below the 50-period SMA (indicating a downtrend).
RSI is above 70 (indicating the market might be overbought or overvalued, signaling a potential reversal).
Current volume is higher than average volume (indicating strong interest in the move).
ATR is increasing (indicating higher volatility, suggesting that the market might be ready for a move).
3. Take Profit & Stop Loss:
Take Profit: When a trade is made, the strategy will set a target price at a certain percentage above or below the entry price (1.5% in this case) to automatically exit the trade once that target is hit.
Stop Loss: If the price goes against the position, a stop loss is set at a percentage below or above the entry price (0.5% in this case) to limit losses.
4. Execution of Trades:
When the buy condition is met, the strategy will enter a long position (buying).
When the sell condition is met, the strategy will enter a short position (selling).
5. Visual Representation:
Green Up Arrow: Appears on the chart when the buy condition is met.
Red Down Arrow: Appears on the chart when the sell condition is met.
These arrows help you see at a glance when the strategy suggests you should buy or sell.
In Summary:
This strategy uses a combination of trend-following (SMA), momentum (RSI), volume, and volatility (ATR) to decide when to buy or sell a stock. It looks for opportunities when the market is either oversold (buy signal) or overbought (sell signal) and makes sure there’s enough volume and volatility to back up the move. It also includes take-profit and stop-loss levels to manage risk.

PT Least Squares Moving AveragePT LSMA Multi-Period Indicator
The PT Least Squares Moving Average (LSMA) Multi-Period Indicator is a powerful tool designed for investors who want to track market trends across multiple time horizons in a single, convenient indicator. This indicator calculates the LSMA for four different periods— 25 bars, 50 bars, 450 bars, and 500 bars providing a comprehensive view of short-term and long-term market movements.
Key Features:
- Multi-Timeframe Trend Analysis: Tracks both short-term (25 & 50 bars) and long-term (450 & 500 bars) market trends, helping investors make informed decisions.
- Smoothing Capability: The LSMA reduces noise by fitting a linear regression line to past price data, offering a clearer trend direction compared to traditional moving averages.
- One-Indicator Solution: Combines multiple LSMA periods into a single chart, reducing clutter and enhancing visual clarity.
- Versatile Applications: Suitable for trend identification, market timing, and spotting potential reversals across different timeframes.
- Customizable Styling: Allows users to customize colors and line styles for each period to suit their preferences.
How to Use:
1. Short-Term Trends (25 & 50 bars):Ideal for identifying recent price movements and short-term trade opportunities.
2. Long-Term Trends (450 & 500 bars): Helps investors gauge broader market sentiment and position themselves accordingly for longer holding periods.
3. Trend Confirmation: When shorter LSMA periods cross above longer ones, it may signal bullish momentum, whereas the opposite may indicate bearish sentiment.
4. Support and Resistance: The LSMA lines can act as dynamic support and resistance levels during trending markets.
Best For:
- Long-term investors looking to align their positions with dominant market trends.
- Swing traders seeking confirmation from multiple time horizons.
- Portfolio managers tracking price momentum across various investment durations.
This LSMA Multi-Period Indicator equips investors with a well-rounded perspective on price movements, offering a strategic edge in navigating market cycles with confidence.
Created by Prince Thomas

Dynamic Time Zone EMA with Candle Trend AnalysisCandleTrend TZ is a powerful analytical tool that integrates time zones, exponential moving averages (EMA), and custom candle coloring based on trend direction. This indicator is ideal for traders looking to analyze market trends within specific time sessions effectively.
Key Features:
Time Zones:
Divides the chart into four distinct time intervals, each highlighted with a unique background color.
Fully customizable start and end times for each interval, allowing for adaptation to various trading schedules.
Exponential Moving Averages (EMA):
Displays three EMAs with user-defined lengths:
EMA 200 (blue) for long-term trends.
EMA 50 (green) for medium-term trends.
EMA 20 (red) for short-term trends.
Helps identify trend direction and strength.
Custom Candle Coloring:
Utilizes smoothed Heiken Ashi and Triple EMA (TEMA) calculations for enhanced candle coloring:
Green candles indicate an upward trend.
Red candles signal a downward trend.
Filters out market noise, providing a clear visual representation of market dynamics.
Customization Options:
Time Zones:
Adjustable start and end times for each of the four sessions:
Input hour and minute for start and end times (e.g., Interval 1 Start/End Hour/Minute).
Background colors are pre-defined but can be modified in the code.
EMAs:
User-defined lengths for each EMA:
EMA 200 Length (default: 200)
EMA 50 Length (default: 50)
EMA 20 Length (default: 20)
TEMA Settings:
Parameters for trend smoothing:
TEMA Length (default: 55)
EMA Length (default: 60)
Use Cases:
Intraday Session Analysis:
Use time zones to differentiate between morning, afternoon, and evening market activity.
The background colors make it easy to track session-specific trends.
Trend Trading:
Analyze EMA crossings and their slopes to confirm market direction.
Green candles indicate buying opportunities, while red candles highlight selling signals.
Noise Reduction:
TEMA smoothing removes market noise, allowing you to focus on the primary market trend.
Adaptation to Custom Strategies:
By adjusting time intervals, you can tailor the indicator to specific trading styles or market conditions.
Benefits:
Versatility for both trending and sideways markets.
Intuitive and user-friendly setup.
Suitable for traders of all skill levels, from beginners to professionals.
CandleTrend TZ is an indispensable tool for understanding market dynamics, enhancing your trading precision, and making well-informed decisions. 🚀
MATA GOLD RATIOMata Gold Instrument: User Guide
The Instrument to Gold Oscillator is a technical analysis tool that normalizes the ratio of an instrument's price (e.g., BTC/USD) to the price of gold (XAU/USD) into a 0-100 scale. This provides a clear and intuitive way to evaluate the relative performance of an instrument compared to gold over a specified period.
---
How It Works
1. Calculation of the Ratio:
The ratio is calculated as:
\text{Ratio} = \frac{\text{Instrument Price}}{\text{Gold Price}}
2. Normalization:
The ratio is normalized using the highest and lowest values over a user-defined period (length), typically 14 periods:
\text{Normalized Ratio} = \frac{\text{Ratio} - \text{Min(Ratio)}}{\text{Max(Ratio)} - \text{Min(Ratio)}} \times 100
3. Overbought/Oversold Levels:
Above 80: The instrument is relatively expensive compared to gold (overbought).
Below 20: The instrument is relatively cheap compared to gold (oversold).
---
How to Use the Oscillator
1. Identify Overbought and Oversold Levels:
If the oscillator rises above 80, the instrument may be overvalued relative to gold. This could signal a potential reversal or correction.
If the oscillator falls below 20, the instrument may be undervalued relative to gold. This could signal a buying opportunity.
2. Track Trends:
Rising oscillator values indicate the instrument is gaining value relative to gold.
Falling oscillator values indicate the instrument is losing value relative to gold.
3. Crossing the Midline (50):
When the oscillator crosses above 50, the instrument's value is gaining strength relative to gold.
When it crosses below 50, the instrument is weakening relative to gold.
4. Combine with Other Indicators:
Use this oscillator alongside other technical indicators (e.g., RSI, MACD, STOCH) for more robust decision-making.
Confirm signals from the oscillator with price action or volume analysis.
---
Example Scenarios
1. Trading Cryptocurrencies Against Gold:
If BTC/USD's oscillator value is above 80, Bitcoin may be overvalued relative to gold. Consider reducing exposure or looking for short opportunities.
If BTC/USD's oscillator value is below 20, Bitcoin may be undervalued relative to gold. This could be a good time to accumulate.
2. Commodities vs. Gold:
Analyze the relative strength of commodities (e.g., oil, silver) against gold using the oscillator to identify periods of overperformance or underperformance.
---
Advantages of the Oscillator
Relative Performance Insight: Tracks the performance of an instrument relative to gold, providing a macro perspective.
Clear Visual Representation: The 0-100 scale makes it easy to identify overbought/oversold conditions and trend shifts.
Customizable Periods: The user-defined length allows flexibility in analyzing short- or long-term trends.
---
Limitations
Dependence on Gold: As the oscillator is based on gold prices, any external shocks to gold (e.g., geopolitical events) can influence its signals.
No Absolute Buy/Sell Signals: The oscillator should not be used in isolation but as part of a broader analysis strategy.
---
By using the Instrument to Gold Oscillator effectively, traders and investors can gain valuable insights into the relative valuation and performance of assets compared to gold, enabling more informed trading and investment decisions.

Phase Cross Strategy with Zone### Introduction to the Strategy
Welcome to the **Phase Cross Strategy with Zone and EMA Analysis**. This strategy is designed to help traders identify potential buy and sell opportunities based on the crossover of smoothed oscillators (referred to as "phases") and exponential moving averages (EMAs). By combining these two methods, the strategy offers a versatile tool for both trend-following and short-term trading setups.
### Key Features
1. **Phase Cross Signals**:
- The strategy uses two smoothed oscillators:
- **Leading Phase**: A simple moving average (SMA) with an upward offset.
- **Lagging Phase**: An exponential moving average (EMA) with a downward offset.
- Buy and sell signals are generated when these phases cross over or under each other, visually represented on the chart with green (buy) and red (sell) labels.
2. **Phase Zone Visualization**:
- The area between the two phases is filled with a green or red zone, indicating bullish or bearish conditions:
- Green zone: Leading phase is above the lagging phase (potential uptrend).
- Red zone: Leading phase is below the lagging phase (potential downtrend).
3. **EMA Analysis**:
- Includes five commonly used EMAs (13, 26, 50, 100, and 200) for additional trend analysis.
- Crossovers of the EMA 13 and EMA 26 act as secondary buy/sell signals to confirm or enhance the phase-based signals.
4. **Customizable Parameters**:
- You can adjust the smoothing length, source (price data), and offset to fine-tune the strategy for your preferred trading style.
### What to Pay Attention To
1. **Phases and Zones**:
- Use the green/red phase zone as an overall trend guide.
- Avoid taking trades when the phases are too close or choppy, as it may indicate a ranging market.
2. **EMA Trends**:
- Align your trades with the longer-term trend shown by the EMAs. For example:
- In an uptrend (price above EMA 50 or EMA 200), prioritize buy signals.
- In a downtrend (price below EMA 50 or EMA 200), prioritize sell signals.
3. **Signal Confirmation**:
- Consider combining phase cross signals with EMA crossovers for higher-confidence trades.
- Look for confluence between the phase signals and EMA trends.
4. **Risk Management**:
- Always set stop-loss and take-profit levels to manage risk.
- Use the phase and EMA zones to estimate potential support/resistance areas for exits.
5. **Whipsaws and False Signals**:
- Be cautious in low-volatility or sideways markets, as the strategy may generate false signals.
- Use additional indicators or filters to avoid entering trades during unclear market conditions.
### How to Use
1. Add the strategy to your chart in TradingView.
2. Adjust the input settings (e.g., smoothing length, offsets) to suit your trading preferences.
3. Enable the strategy tester to evaluate its performance on historical data.
4. Combine the signals with your own analysis and risk management plan for best results.
This strategy is a versatile tool, but like any trading method, it requires proper understanding and discretion. Always backtest thoroughly and trade with discipline. Let me know if you need further assistance or adjustments to the strategy!

Snipe 1-Minute IntradayPurpose
This script demonstrates a simple intraday approach using RSI, EMAs, VWAP, and an optional volume filter. It plots visual buy (bullish) and sell (bearish) signals on the chart under certain conditions. You can use it as a starting point to explore or develop your own intraday strategies.
Key Features
1. VWAP (Volume Weighted Average Price)
Plots the built-in VWAP for additional context on intraday price action.
2. EMA Crossover
Uses two EMAs (fast and slow). A bullish signal triggers when the fast EMA is above the slow EMA, and a bearish signal triggers when the fast EMA is below the slow EMA.
3. RSI Momentum Filter
An RSI reading above 50 indicates bullish momentum; below 50 indicates bearish momentum.
4. Volume Filter (Optional)
Compares the current bar’s volume against the average volume (over a user-defined period). When enabled, signals only appear if the current volume exceeds the average.
5. Time Window (Optional)
Allows you to define a specific time window (e.g., the first hour of trading) for valid signals. You can enable or disable this filter and set your preferred time zone.
How the Signals Are Generated
• Bullish Signal
o Occurs when:
1. Price is above VWAP.
2. Fast EMA is above Slow EMA.
3. RSI is above 50.
4. (Optional) Current volume exceeds the average volume if the volume filter is enabled.
5. (Optional) The chart’s timestamp is within the specified session if the time filter is enabled.
A green triangle is plotted below the bar, and an optional background highlight is shown.
• Bearish Signal
Occurs when the conditions are inverted (price below VWAP, fast EMA below slow EMA, RSI below 50, volume filter and time window—if enabled—are satisfied).
A red triangle is plotted above the bar, and an optional background highlight is shown.
How to Use
1. Load on a 1-Minute Chart (Recommended)
This script is intended for intraday timeframes (specifically 1-minute). Feel free to experiment with other timeframes.
2. Adjust Inputs
You can modify the RSI length, EMA lengths, and volume lookback to suit your preferences or trading style.
If you prefer signals outside the default session hours, turn off “Use Time Filter for Signals?” or change the session window and time zone.
3. Enable or Disable Volume Filter
Turn this on if you only want signals during higher-than-average volume bars.
4. Combine with Other Analysis
This script can be used as a visual tool; however, it is not a complete trading system by itself. Consider additional technical or fundamental analysis to validate your trading decisions.
5. Risk Management
Always practice sound risk management. Setting appropriate stop-losses or using position sizing techniques can help manage potential losses.
Important Notes and Disclaimers
• Educational Only: This script is for demonstration and educational purposes and does not guarantee future results.
• No Financial Advice: Nothing here should be construed as financial or investment advice. Always do your own research and consider consulting a qualified financial professional.
• Test Before Using Live: If you plan to incorporate this script into a strategy, backtest it on historical data and consider forward-testing on a demo account.
• License: This code is subject to the Mozilla Public License 2.0.

three Supertrend EMA Strategy by Prasanna +DhanuThe indicator described in your Pine Script is a Supertrend EMA Strategy that combines the Supertrend and EMA (Exponential Moving Average) to create a trend-following strategy. Here’s a detailed breakdown of how this indicator works:
1. EMA (Exponential Moving Average):
The EMA is a moving average that places more weight on recent prices, making it more responsive to price changes compared to a simple moving average (SMA). In this strategy, the EMA is used to determine the overall trend direction.
Input Parameter:
ema_length: This is the period for the EMA, set to 50 periods by default. A shorter EMA will respond more quickly to price movements, while a longer EMA is smoother and less sensitive to short-term fluctuations.
How it's used:
If the price is above the EMA, it indicates an uptrend.
If the price is below the EMA, it indicates a downtrend.
2. Supertrend Indicator:
The Supertrend indicator is a trend-following tool based on the Average True Range (ATR), which is a volatility measure. It helps to identify the direction of the trend by setting a dynamic support or resistance level.
Input Parameters:
supertrend_atr_period: The period used for calculating the ATR, set to 10 periods by default.
supertrend_multiplier1: Multiplier for the first Supertrend, set to 3.0.
supertrend_multiplier2: Multiplier for the second Supertrend, set to 2.0.
supertrend_multiplier3: Multiplier for the third Supertrend, set to 1.0.
Each Supertrend line has a different multiplier, which affects its sensitivity to price changes. The ATR period defines how many periods of price data are used to calculate the ATR.
How the Supertrend works:
If the Supertrend value is below the price, the trend is considered bullish (uptrend).
If the Supertrend value is above the price, the trend is considered bearish (downtrend).
The Supertrend will switch between up and down based on price movement and ATR, providing a dynamic trend-following signal.
3. Three Supertrend Lines:
In this strategy, three Supertrend lines are calculated with different multipliers and the same ATR period (10 periods). Each line is more or less sensitive to price changes, and they are plotted on the chart in different colors based on whether the trend is bullish (green) or bearish (red).
Supertrend 1: The most sensitive Supertrend with a multiplier of 3.0.
Supertrend 2: A moderately sensitive Supertrend with a multiplier of 2.0.
Supertrend 3: The least sensitive Supertrend with a multiplier of 1.0.
Each Supertrend line signals a bullish trend when its value is below the price and a bearish trend when its value is above the price.
4. Strategy Rules:
This strategy uses the three Supertrend lines combined with the EMA to generate trade signals.
Entry Conditions:
A long entry is triggered when all three Supertrend lines are in an uptrend (i.e., all three Supertrend lines are below the price), and the price is above the EMA. This suggests a strong bullish market condition.
A short entry is triggered when all three Supertrend lines are in a downtrend (i.e., all three Supertrend lines are above the price), and the price is below the EMA. This suggests a strong bearish market condition.
Exit Conditions:
A long exit occurs when the third Supertrend (the least sensitive one) switches to a downtrend (i.e., the price falls below it).
A short exit occurs when the third Supertrend switches to an uptrend (i.e., the price rises above it).
5. Visualization:
The strategy also plots the following on the chart:
The EMA is plotted as a blue line, which helps identify the overall trend.
The three Supertrend lines are plotted with different colors:
Supertrend 1: Green (for uptrend) and Red (for downtrend).
Supertrend 2: Green (for uptrend) and Red (for downtrend).
Supertrend 3: Green (for uptrend) and Red (for downtrend).
Summary of the Strategy:
The strategy combines three Supertrend indicators (with different multipliers) and an EMA to capture both short-term and long-term trends.
Long positions are entered when all three Supertrend lines are bullish and the price is above the EMA.
Short positions are entered when all three Supertrend lines are bearish and the price is below the EMA.
Exits occur when the third Supertrend line (the least sensitive) signals a change in trend direction.
This combination of indicators allows for a robust trend-following strategy that adapts to both short-term volatility and long-term trend direction. The Supertrend lines provide quick reaction to price changes, while the EMA offers a smoother, more stable trend direction for confirmation.
The indicator described in your Pine Script is a Supertrend EMA Strategy that combines the Supertrend and EMA (Exponential Moving Average) to create a trend-following strategy. Here’s a detailed breakdown of how this indicator works:
1. EMA (Exponential Moving Average):
The EMA is a moving average that places more weight on recent prices, making it more responsive to price changes compared to a simple moving average (SMA). In this strategy, the EMA is used to determine the overall trend direction.
Input Parameter:
ema_length: This is the period for the EMA, set to 50 periods by default. A shorter EMA will respond more quickly to price movements, while a longer EMA is smoother and less sensitive to short-term fluctuations.
How it's used:
If the price is above the EMA, it indicates an uptrend.
If the price is below the EMA, it indicates a downtrend.
2. Supertrend Indicator:
The Supertrend indicator is a trend-following tool based on the Average True Range (ATR), which is a volatility measure. It helps to identify the direction of the trend by setting a dynamic support or resistance level.
Input Parameters:
supertrend_atr_period: The period used for calculating the ATR, set to 10 periods by default.
supertrend_multiplier1: Multiplier for the first Supertrend, set to 3.0.
supertrend_multiplier2: Multiplier for the second Supertrend, set to 2.0.
supertrend_multiplier3: Multiplier for the third Supertrend, set to 1.0.
Each Supertrend line has a different multiplier, which affects its sensitivity to price changes. The ATR period defines how many periods of price data are used to calculate the ATR.
How the Supertrend works:
If the Supertrend value is below the price, the trend is considered bullish (uptrend).
If the Supertrend value is above the price, the trend is considered bearish (downtrend).
The Supertrend will switch between up and down based on price movement and ATR, providing a dynamic trend-following signal.
3. Three Supertrend Lines:
In this strategy, three Supertrend lines are calculated with different multipliers and the same ATR period (10 periods). Each line is more or less sensitive to price changes, and they are plotted on the chart in different colors based on whether the trend is bullish (green) or bearish (red).
Supertrend 1: The most sensitive Supertrend with a multiplier of 3.0.
Supertrend 2: A moderately sensitive Supertrend with a multiplier of 2.0.
Supertrend 3: The least sensitive Supertrend with a multiplier of 1.0.
Each Supertrend line signals a bullish trend when its value is below the price and a bearish trend when its value is above the price.
4. Strategy Rules:
This strategy uses the three Supertrend lines combined with the EMA to generate trade signals.
Entry Conditions:
A long entry is triggered when all three Supertrend lines are in an uptrend (i.e., all three Supertrend lines are below the price), and the price is above the EMA. This suggests a strong bullish market condition.
A short entry is triggered when all three Supertrend lines are in a downtrend (i.e., all three Supertrend lines are above the price), and the price is below the EMA. This suggests a strong bearish market condition.
Exit Conditions:
A long exit occurs when the third Supertrend (the least sensitive one) switches to a downtrend (i.e., the price falls below it).
A short exit occurs when the third Supertrend switches to an uptrend (i.e., the price rises above it).
5. Visualization:
The strategy also plots the following on the chart:
The EMA is plotted as a blue line, which helps identify the overall trend.
The three Supertrend lines are plotted with different colors:
Supertrend 1: Green (for uptrend) and Red (for downtrend).
Supertrend 2: Green (for uptrend) and Red (for downtrend).
Supertrend 3: Green (for uptrend) and Red (for downtrend).
Summary of the Strategy:
The strategy combines three Supertrend indicators (with different multipliers) and an EMA to capture both short-term and long-term trends.
Long positions are entered when all three Supertrend lines are bullish and the price is above the EMA.
Short positions are entered when all three Supertrend lines are bearish and the price is below the EMA.
Exits occur when the third Supertrend line (the least sensitive) signals a change in trend direction.
This combination of indicators allows for a robust trend-following strategy that adapts to both short-term volatility and long-term trend direction. The Supertrend lines provide quick reaction to price changes, while the EMA offers a smoother, more stable trend direction for confirmation.

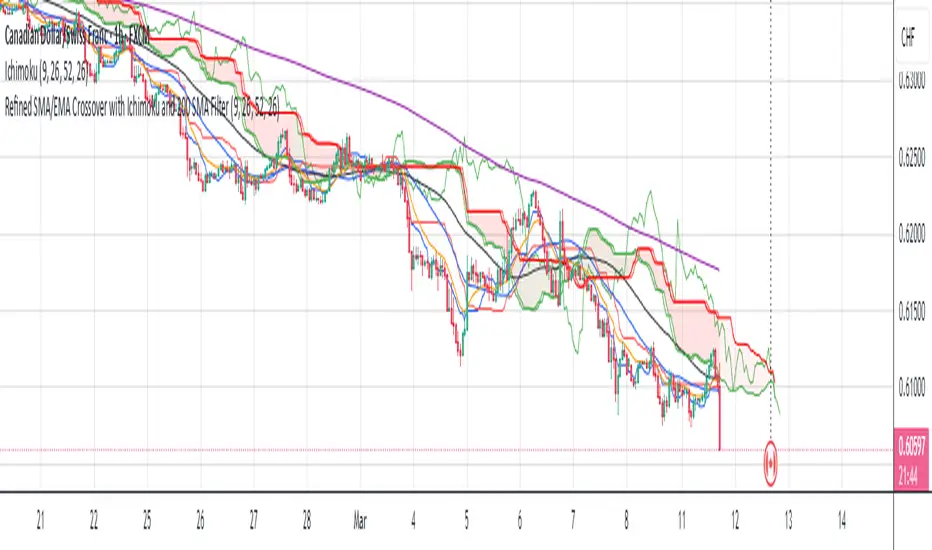
Refined SMA/EMA Crossover with Ichimoku and 200 SMA FilterYour **Refined SMA/EMA Crossover with Ichimoku and 200 SMA Filter** strategy is a multi-faceted technical trading strategy that combines several key technical indicators to refine entry and exit points for trades. Here's a breakdown of the components and how they work together:
### 1. **SMA/EMA Crossover**
- **Simple Moving Average (SMA) & Exponential Moving Average (EMA) Crossover**:
- The core idea behind the crossover strategy is to use the relationship between two moving averages to generate buy or sell signals.
- **SMA** (Simple Moving Average) gives an average of past prices over a set period.
- **EMA** (Exponential Moving Average) places more weight on recent prices, making it more responsive to price movements.
- A **bullish crossover** occurs when a shorter period moving average (such as a 50-period EMA) crosses above a longer period moving average (such as a 200-period SMA), signaling a potential buy.
- A **bearish crossover** occurs when a shorter period moving average crosses below the longer period moving average, signaling a potential sell.
### 2. **Ichimoku Cloud**
- The **Ichimoku Cloud** is a versatile indicator that provides insight into trend direction, support and resistance levels, and momentum.
- **Cloud (Kumo)**: The space between the Senkou Span A and Senkou Span B lines. It helps identify whether the market is in an uptrend, downtrend, or consolidation.
- **Tenkan-sen** (Conversion Line) and **Kijun-sen** (Base Line): These lines are used for additional confirmation of trend direction.
- **Chikou Span**: A lagging line that is used to confirm the trend.
- The general trading rules based on the Ichimoku Cloud are:
- **Bullish Signal**: When the price is above the cloud and the Tenkan-sen crosses above the Kijun-sen.
- **Bearish Signal**: When the price is below the cloud and the Tenkan-sen crosses below the Kijun-sen.
### 3. **200 SMA Filter**
- The **200 SMA Filter** serves as a long-term trend filter.
- When the price is **above the 200 SMA**, it signals a long-term bullish trend, and you only look for buying opportunities.
- When the price is **below the 200 SMA**, it signals a long-term bearish trend, and you only look for selling opportunities.
- This filter helps to avoid counter-trend trades, aligning your positions with the broader market trend.
### **How the Strategy Works Together**
- **Trade Setup (Long Position)**
1. The **200 SMA Filter** must confirm an **uptrend** by ensuring that the price is above the 200 SMA.
2. A **bullish crossover** (e.g., the 50 EMA crossing above the 200 SMA) occurs.
3. **Ichimoku Cloud** confirms a bullish trend, with the price above the cloud and the Tenkan-sen crossing above the Kijun-sen.
4. You enter a **long trade** with this confluence of signals.
- **Trade Setup (Short Position)**
1. The **200 SMA Filter** must confirm a **downtrend** by ensuring the price is below the 200 SMA.
2. A **bearish crossover** (e.g., the 50 EMA crossing below the 200 SMA) occurs.
3. **Ichimoku Cloud** confirms a bearish trend, with the price below the cloud and the Tenkan-sen crossing below the Kijun-sen.
4. You enter a **short trade** with this confluence of signals.
### **Exit Strategy**
- Exits can be determined based on any of the following:
- **SMA/EMA crossover reversal**: Exit when the shorter-term moving average crosses back below the longer-term moving average for a long position or crosses above for a short position.
- **Ichimoku Cloud reversal**: If the price breaks through the cloud or the Tenkan-sen and Kijun-sen lines cross in the opposite direction.
- **Profit target or stop loss**: Setting predefined profit targets or using a trailing stop to lock in profits as the trade moves in your favor.
Summary of the Strategy
This strategy is designed to identify strong trends and avoid false signals by combining:
SMA/EMA crossovers for immediate market direction signals.
Ichimoku Cloud for confirming the strength and trend direction.
A 200
SMA filter to ensure trades align with the long-term trend.
By using these multiple indicators together, the strategy aims to refine entry and exit points, minimize risk, and increase the likelihood of successful trades.